Home > Comparison > Technology > STM vs MCHP
The strategic rivalry between STMicroelectronics N.V. and Microchip Technology Incorporated defines the current trajectory of the semiconductor industry. STMicroelectronics operates as a diversified semiconductor manufacturer with broad analog, MEMS, and automotive segments. In contrast, Microchip Technology focuses on embedded control solutions and specialized microcontrollers. This analysis will determine which company’s operational model offers a superior risk-adjusted return for a diversified technology portfolio.
Table of contents
Companies Overview
STMicroelectronics and Microchip Technology stand as key players in the global semiconductor industry, driving innovation across multiple sectors.
STMicroelectronics N.V.: Diverse Semiconductor Powerhouse
STMicroelectronics dominates the semiconductor market by designing and manufacturing a broad range of integrated circuits. Its core revenue stems from automotive ICs, industrial analog products, MEMS sensors, and microcontrollers. In 2026, the company strategically focused on expanding its automotive and industrial semiconductor solutions, leveraging its diversified product portfolio to serve multiple end markets worldwide.
Microchip Technology Incorporated: Embedded Control Specialist
Microchip Technology leads by providing smart, connected embedded control solutions including microcontrollers, analog devices, and memory products. Its revenue engine relies on specialized microcontrollers and development tools for automotive, industrial, and communications applications. In 2026, the firm emphasized enhancing its secure embedded control technologies to address growing demand in IoT and automotive sectors.
Strategic Collision: Similarities & Divergences
Both companies thrive in the semiconductor space but diverge in strategy: STMicroelectronics pursues a broad multi-segment approach, while Microchip focuses on specialized embedded systems. Their competitive battle centers on automotive and industrial electronics markets. Investors face distinct profiles—ST offers broad exposure with diversified risks; Microchip provides targeted growth in embedded controls, appealing to niche technology investors.
Income Statement Comparison
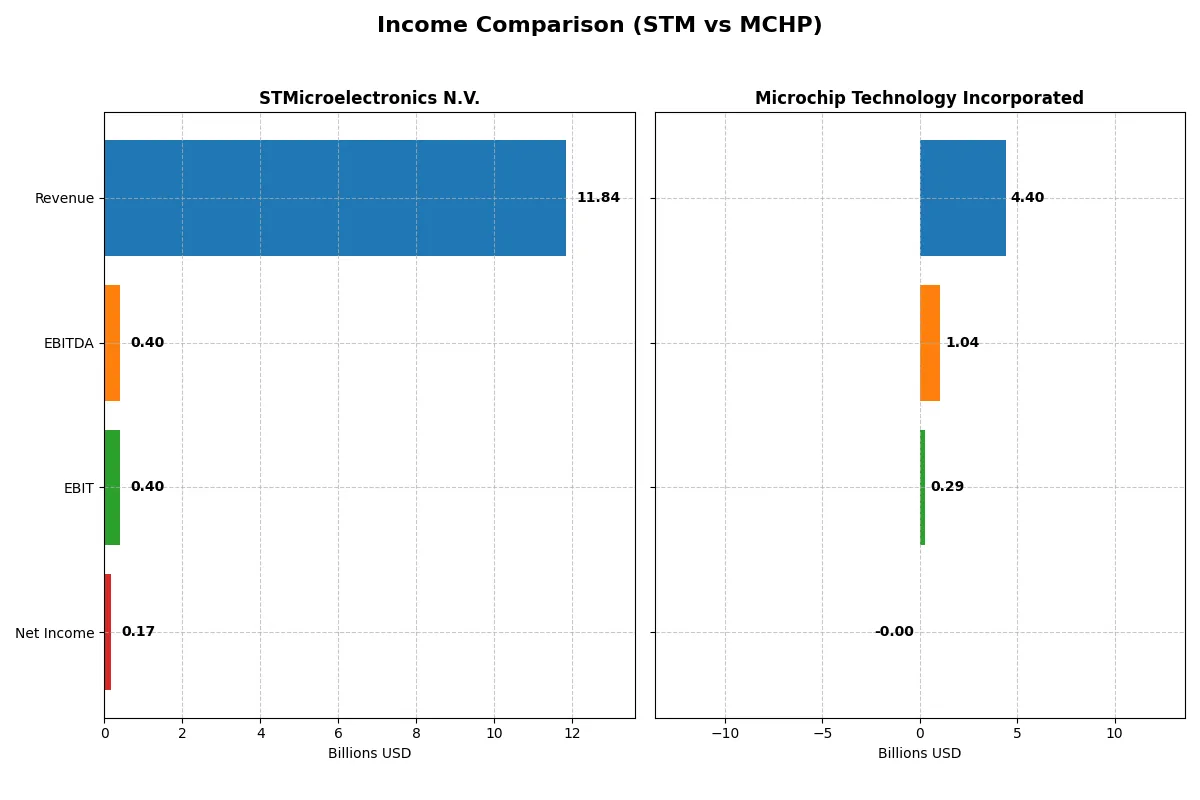
This data dissects the core profitability and scalability of both corporate engines to reveal who dominates the bottom line:
| Metric | STMicroelectronics N.V. (STM) | Microchip Technology Incorporated (MCHP) |
|---|---|---|
| Revenue | 11.8B | 4.4B |
| Cost of Revenue | 7.8B | 1.9B |
| Operating Expenses | 3.7B | 2.2B |
| Gross Profit | 4.0B | 2.5B |
| EBITDA | 401M | 1.0B |
| EBIT | 401M | 290M |
| Interest Expense | 0 | 251M |
| Net Income | 167M | -0.5M |
| EPS | 0.19 | -0.005 |
| Fiscal Year | 2025 | 2025 |
Income Statement Analysis: The Bottom-Line Duel
Comparing these income statements reveals which company converts revenue into profit most efficiently through market cycles and operational execution.
STMicroelectronics N.V. Analysis
STM’s revenue declined from 17.3B in 2023 to 11.8B in 2025, dragging net income sharply from 4.2B to 167M. Gross margin fell to 33.9%, reflecting cost pressures, while net margin shrank to 1.4%. Despite a challenging environment, STM maintains positive interest income and a slight operating income, signaling resilience but weakening profitability momentum.
Microchip Technology Incorporated Analysis
MCHP’s revenue plunged from 8.4B in early 2023 to 4.4B in 2025, with net income turning negative at -0.5M. Gross margin remains strong at 56.1%, but net margin slipped into the red. EBIT margin holds at 6.6%, showing some operational control. However, significant interest expenses and a steep profit decline highlight severe earnings pressure and deteriorating capital efficiency.
Margin Strength vs. Earnings Durability
STM and MCHP both face unfavorable revenue and net income trends, but STM preserves modest profitability with positive net income and interest gains. MCHP’s stronger gross margin fails to offset high interest costs and losses at the bottom line. For investors, STM’s profile suggests a more durable earnings base despite margin compression, while MCHP’s volatile net results signal higher risk.
Financial Ratios Comparison
These vital ratios act as a diagnostic tool to expose the underlying fiscal health, valuation premiums, and capital efficiency of the companies compared below:
| Ratios | STMicroelectronics N.V. (STM) | Microchip Technology Incorporated (MCHP) |
|---|---|---|
| ROE | 0.0093 | -0.00007 |
| ROIC | 0.0067 | -0.00027 |
| P/E | 14.43 | -52021 |
| P/B | 1.29 | 3.67 |
| Current Ratio | 3.11 | 2.59 |
| Quick Ratio | 2.37 | 1.47 |
| D/E | 0.18 | 0.80 |
| Debt-to-Assets | 0.13 | 0.37 |
| Interest Coverage | 19.72 | 1.18 |
| Asset Turnover | 0.54 | 0.29 |
| Fixed Asset Turnover | 1.22 | 3.72 |
| Payout ratio | 0.18 | -1951 |
| Dividend yield | 0.013 | 0.038 |
| Fiscal Year | 2024 | 2025 |
Efficiency & Valuation Duel: The Vital Signs
Financial ratios serve as a company’s DNA, exposing hidden risks and operational excellence to refine investment decisions.
STMicroelectronics N.V.
STMicroelectronics reports weak profitability with ROE at 0.93% and net margin at 1.41%, signaling operational challenges. Its valuation ratios, including P/E, show a favorable stance, suggesting the stock is attractively priced. The company does not pay dividends but invests heavily in R&D, aiming to fuel future growth and shareholder value.
Microchip Technology Incorporated
Microchip shows negative returns with ROE and net margin below zero, reflecting profitability struggles. Its P/E ratio appears favorable due to negative earnings, but a high P/B ratio signals an expensive valuation. The company offers a 3.75% dividend yield, returning cash to shareholders despite operational headwinds and moderate asset efficiency.
Valuation and Profitability: Balancing Risk and Yield
STMicroelectronics offers an attractive valuation but struggles with profitability and operational efficiency. Microchip pays dividends but faces profitability and leverage concerns. Investors seeking growth may lean toward STMicroelectronics, while income-focused investors might prefer Microchip’s dividend profile despite higher risk.
Which one offers the Superior Shareholder Reward?
I compare STMicroelectronics (STM) and Microchip Technology (MCHP) on dividends, payout ratios, and buybacks for 2026. STM yields 1.28% with a modest 18.5% payout, supported by solid FCF in 2024 but negative in 2025, signaling volatility. STM’s buybacks appear limited. MCHP boasts a higher 3.75% dividend yield with a 48% payout, backed by strong free cash flow of 4.8/share and a history of aggressive buybacks, enhancing total returns. However, MCHP carries higher leverage risk. I see MCHP’s shareholder reward as superior in 2026 due to its balanced mix of sustainable dividends and robust buybacks, despite higher debt. STM’s cautious approach may appeal to risk-averse investors but offers lower immediate returns.
Comparative Score Analysis: The Strategic Profile
The radar chart reveals the fundamental DNA and trade-offs of STMicroelectronics and Microchip Technology, highlighting their financial strengths and weaknesses across key metrics:
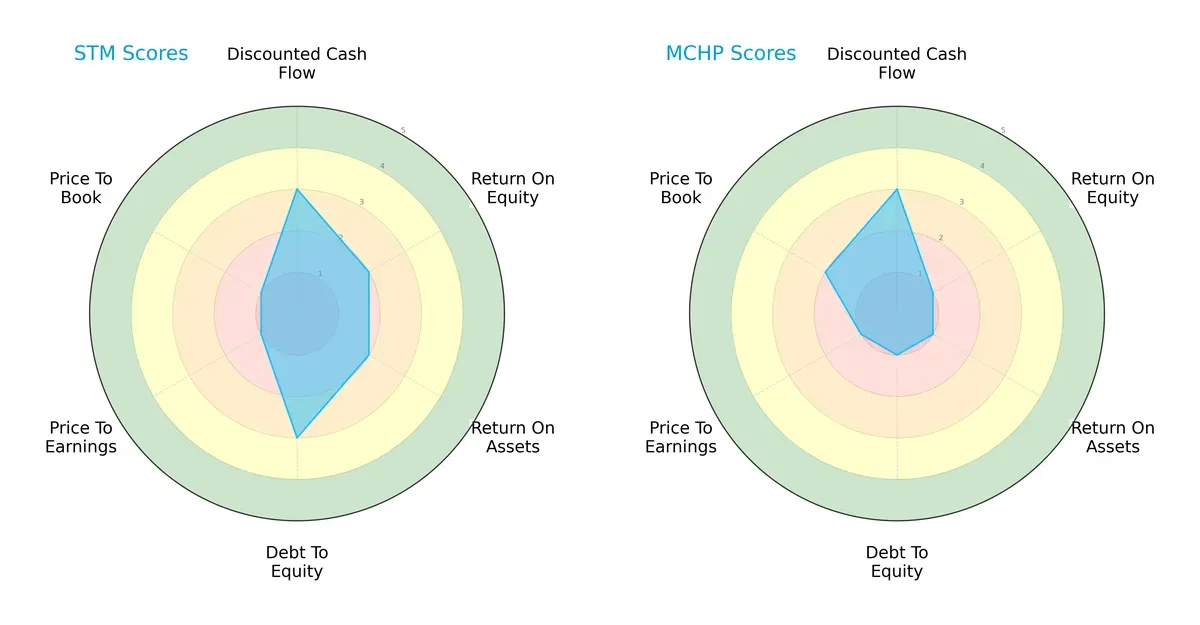
STMicroelectronics shows a more balanced profile with moderate scores in DCF (3), ROE (2), ROA (2), and Debt/Equity (3). However, it struggles on valuation metrics, scoring very unfavorable (1) on both P/E and P/B. In contrast, Microchip relies heavily on its DCF score (3) but shows weak profitability (ROE 1, ROA 1) and financial risk (Debt/Equity 1). Its valuation is also poor with a very unfavorable P/E (1) but slightly better P/B (2). Overall, STMicroelectronics presents a steadier financial foundation, while Microchip depends on discounted cash flow strength amid weaker operational performance.
—
Bankruptcy Risk: Solvency Showdown
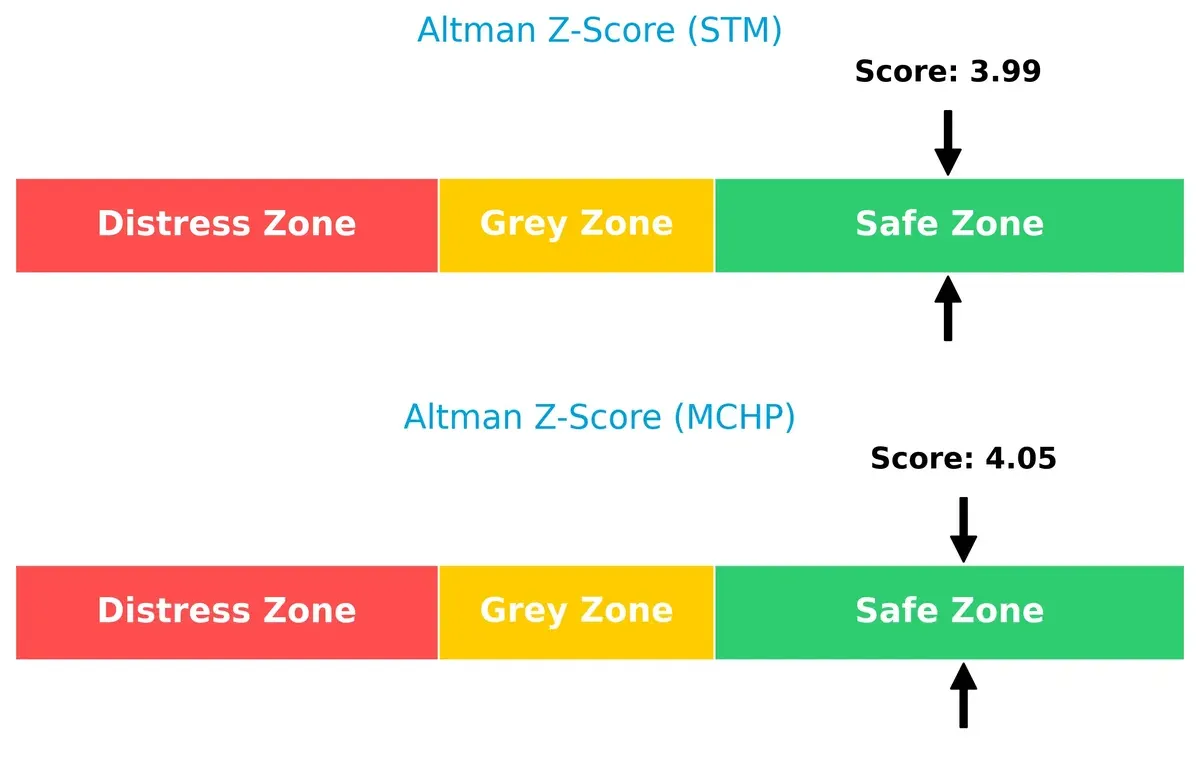
The Altman Z-Score comparison indicates both firms sit comfortably in the safe zone, but Microchip edges STMicroelectronics slightly with a 4.05 versus 3.99 score, suggesting marginally stronger long-term solvency:
—
Financial Health: Quality of Operations
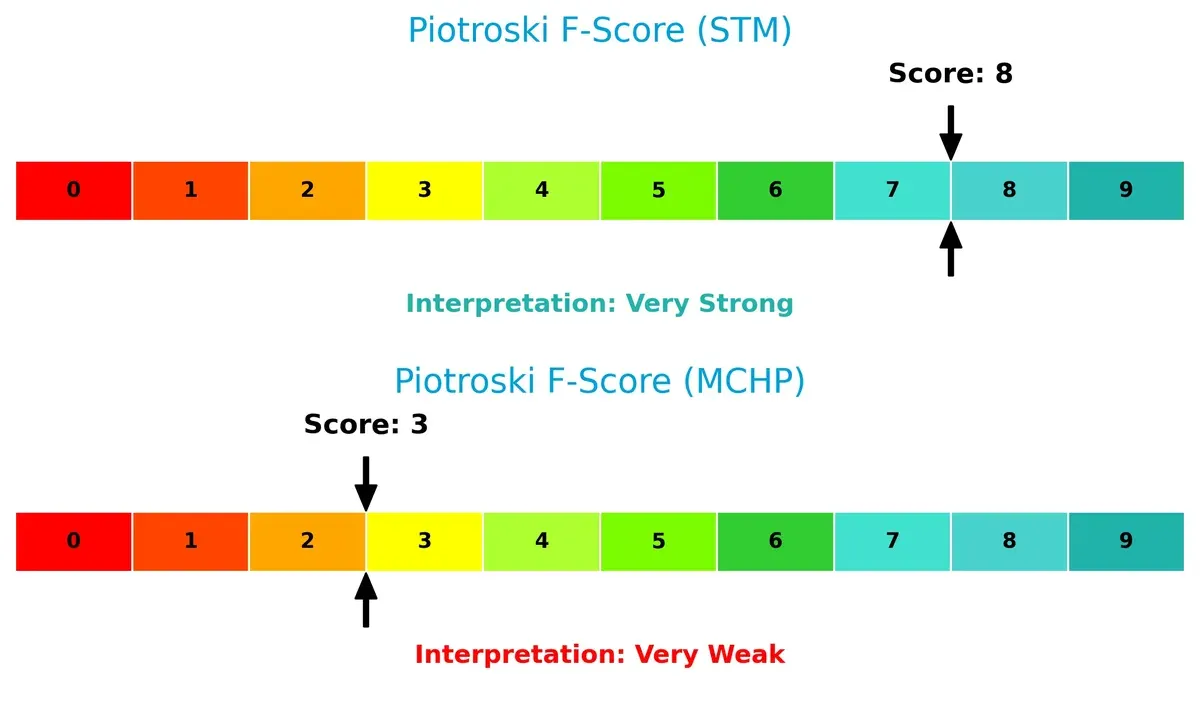
STMicroelectronics demonstrates superior financial health with a Piotroski F-Score of 8, signaling very strong internal metrics. Microchip’s score of 3 flags potential red flags in profitability and efficiency, indicating weaker operational quality:
How are the two companies positioned?
This section dissects STM and MCHP’s operational DNA by comparing revenue distribution and internal strengths and weaknesses. The goal is to confront their economic moats, revealing which business model sustains the strongest competitive advantage today.
Revenue Segmentation: The Strategic Mix
This visual comparison dissects how STMicroelectronics and Microchip Technology diversify their income streams and where their primary sector bets lie:
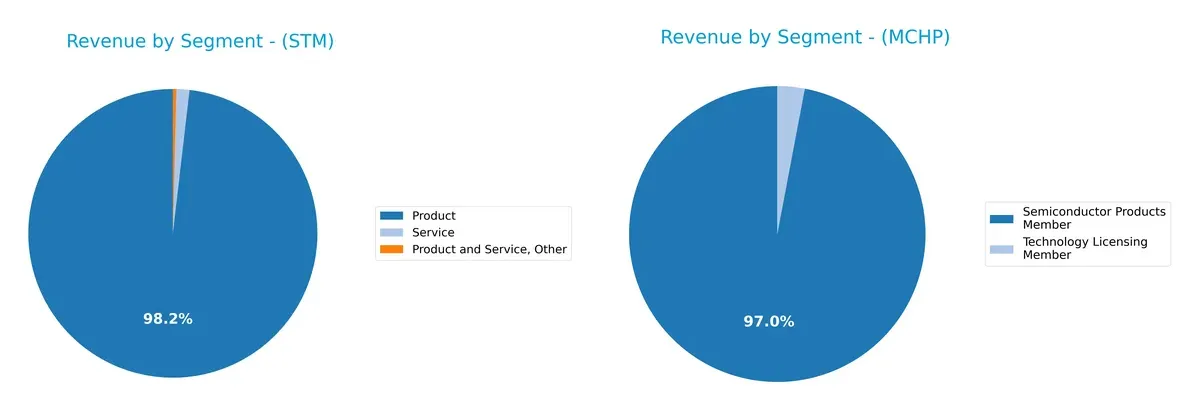
STMicroelectronics anchors its revenue heavily in Product sales, reaching $13.2B in 2024, with minimal Service and Other segments, signaling a concentrated exposure. Microchip Technology relies almost entirely on Semiconductor Products, generating $7.5B in 2024, with a small Technology Licensing stream. STM’s broader product mix suggests ecosystem lock-in potential, while MCHP’s narrow focus raises concentration risk but benefits from operational specialization.
Strengths and Weaknesses Comparison
This table compares the strengths and weaknesses of STMicroelectronics N.V. (STM) and Microchip Technology Incorporated (MCHP):
STM Strengths
- High quick ratio at 2.43 supports liquidity
- Low debt-to-equity at 0.12 enables financial flexibility
- Favorable interest coverage at infinity reduces default risk
- Large and diversified geographic presence including Singapore, US, and Europe
MCHP Strengths
- Favorable dividend yield at 3.75% attracts income investors
- Strong fixed asset turnover at 3.72 indicates efficient asset use
- Favorable PE ratio signals growth potential
- Current and quick ratios above 1.4 support adequate liquidity
STM Weaknesses
- Low profitability with net margin at 1.41% and ROE below 1%
- Asset turnover at 0.48 is weak, limiting revenue generation from assets
- Current ratio very high at 3.36 may indicate inefficient asset use
- Absence of dividend yield reduces shareholder income
MCHP Weaknesses
- Negative net margin and ROE indicate operational challenges
- Interest coverage barely above 1 signals vulnerability to interest shocks
- High debt-to-assets at 36.85% raises financial risk
- Unfavorable PB ratio at 3.67 suggests overvaluation concerns
STM’s strengths center on liquidity and low leverage, supporting operational resilience but burdened by weak profitability and asset efficiency. MCHP shows income appeal and asset efficiency but faces profitability and leverage pressures. These contrasts illustrate differing financial profiles that influence strategic priorities in capital allocation and market positioning.
The Moat Duel: Analyzing Competitive Defensibility
A structural moat is the only reliable barrier that protects long-term profits from relentless competition pressure. Let’s dissect how these two semiconductor firms defend their turf:
STMicroelectronics N.V.: Diverse Product Portfolio Moat
STM’s competitive edge lies in its broad analog and microcontroller product lineup. Historically, this diversity has supported moderate gross margins near 34%. However, declining ROIC signals weakening efficiency. In 2026, new sensor innovations could deepen its moat if operational execution improves.
Microchip Technology Incorporated: Embedded Control Solutions Moat
MCHP’s moat stems from its specialization in embedded microcontrollers and mixed-signal products, commanding a superior gross margin above 56%. Yet, a steep ROIC decline highlights margin pressure and value erosion. Future market disruptions and digital security demands offer avenues to reinforce its position.
Moat Depth Battle: Product Breadth vs. Specialized Embedded Control
Both STM and MCHP suffer from declining ROICs, signaling shrinking moats and value destruction. MCHP’s higher gross margin and product focus give it a slightly wider moat, but both face significant profitability headwinds. Neither currently commands a strong defensive advantage to fully protect market share.
Which stock offers better returns?
The past year reveals stark contrasts in price action and trading dynamics between STMicroelectronics N.V. and Microchip Technology Incorporated, highlighting differing investor sentiment and momentum shifts.
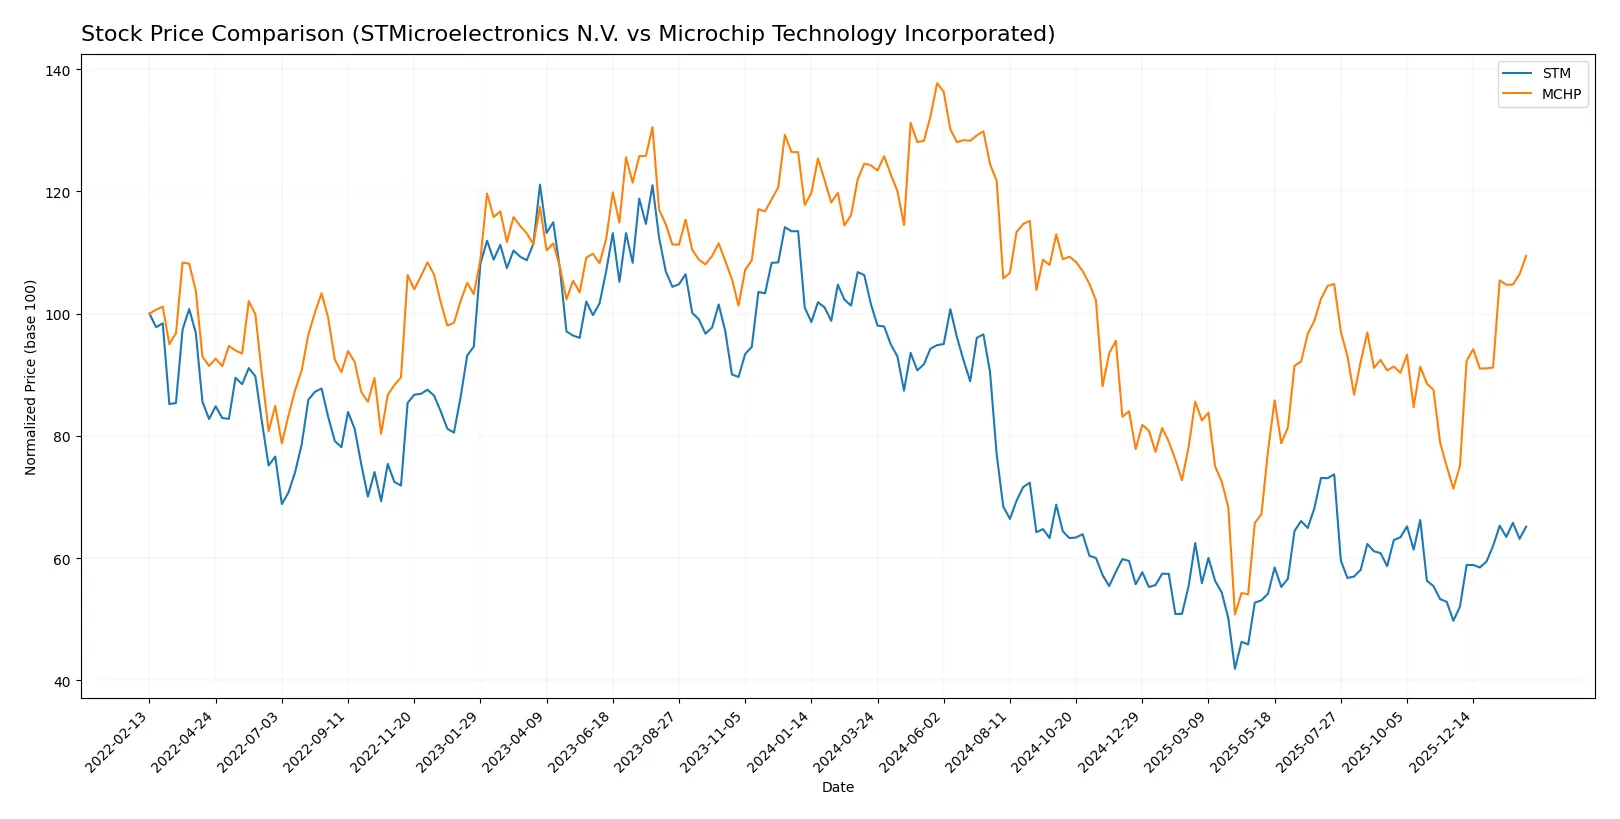
Trend Comparison
STMicroelectronics N.V. experienced a 35.85% price decline over the past 12 months, marking a bearish trend with accelerating downward momentum, hitting a low of 18.49 before a recent recovery of 30.95%.
Microchip Technology Incorporated’s stock fell 11.91% over the same period, also bearish, but with greater volatility and an acceleration in decline; it showed a stronger recent rebound of 53.4%.
Comparing both, Microchip’s higher recent recovery and smaller overall loss reflect better market performance despite volatility, outperforming STMicroelectronics in the 12-month window.
Target Prices
Analysts present a cautiously optimistic consensus on STMicroelectronics and Microchip Technology.
| Company | Target Low | Target High | Consensus |
|---|---|---|---|
| STMicroelectronics N.V. | 28 | 45 | 37.67 |
| Microchip Technology Incorporated | 60 | 100 | 82.46 |
The consensus target for STMicroelectronics stands about 31% above its current price of $28.77, signaling moderate upside potential. Microchip’s consensus target exceeds its current $78.08 price by roughly 6%, implying limited near-term appreciation.

Don’t Let Luck Decide Your Entry Point
Optimize your entry points with our advanced ProRealTime indicators. You’ll get efficient buy signals with precise price targets for maximum performance. Start outperforming now!
How do institutions grade them?
STMicroelectronics N.V. Grades
The following table summarizes recent institutional grades for STMicroelectronics N.V.:
| Grading Company | Action | New Grade | Date |
|---|---|---|---|
| TD Cowen | Maintain | Buy | 2025-10-24 |
| Susquehanna | Maintain | Positive | 2025-10-22 |
| Susquehanna | Maintain | Positive | 2025-07-25 |
| Baird | Upgrade | Outperform | 2025-07-22 |
| Susquehanna | Maintain | Positive | 2025-07-22 |
| Jefferies | Upgrade | Buy | 2025-02-19 |
| Bernstein | Downgrade | Market Perform | 2025-02-05 |
| Susquehanna | Maintain | Positive | 2025-01-31 |
| Barclays | Downgrade | Underweight | 2025-01-22 |
| JP Morgan | Downgrade | Neutral | 2024-12-09 |
Microchip Technology Incorporated Grades
Below is a summary of institutional grades for Microchip Technology Incorporated:
| Grading Company | Action | New Grade | Date |
|---|---|---|---|
| Cantor Fitzgerald | Maintain | Overweight | 2026-02-02 |
| UBS | Maintain | Buy | 2026-01-26 |
| Susquehanna | Maintain | Positive | 2026-01-22 |
| B of A Securities | Maintain | Neutral | 2026-01-21 |
| Citigroup | Maintain | Buy | 2026-01-15 |
| Piper Sandler | Maintain | Overweight | 2026-01-15 |
| B. Riley Securities | Maintain | Buy | 2026-01-12 |
| Mizuho | Maintain | Outperform | 2026-01-09 |
| Wells Fargo | Maintain | Equal Weight | 2026-01-07 |
| JP Morgan | Maintain | Overweight | 2026-01-06 |
Which company has the best grades?
Microchip Technology has consistently received strong and stable buy and overweight ratings from multiple institutions in early 2026. In contrast, STMicroelectronics shows more mixed ratings, including several downgrades and neutral opinions in 2025. Investors may view Microchip’s more positive and recent consensus as a sign of stronger institutional confidence.
Risks specific to each company
The following categories identify critical pressure points and systemic threats facing STMicroelectronics N.V. and Microchip Technology Incorporated in the 2026 market environment:
1. Market & Competition
STMicroelectronics N.V.
- Faces intense competition in automotive and industrial segments with moderate innovation pace.
Microchip Technology Incorporated
- Struggles with negative margins amid aggressive pricing and rapid technology shifts.
2. Capital Structure & Debt
STMicroelectronics N.V.
- Maintains low debt-to-equity (0.12) and strong interest coverage, signaling conservative leverage.
Microchip Technology Incorporated
- Carries high debt-to-equity (0.8) and weak interest coverage (1.15), raising financial risk.
3. Stock Volatility
STMicroelectronics N.V.
- Beta of 1.32 implies moderate volatility relative to the tech sector.
Microchip Technology Incorporated
- Higher beta of 1.44 shows greater stock price swings and investor risk.
4. Regulatory & Legal
STMicroelectronics N.V.
- Operates globally with exposure to European regulatory frameworks, requiring compliance agility.
Microchip Technology Incorporated
- US-based, subject to evolving US semiconductor export controls and IP regulations.
5. Supply Chain & Operations
STMicroelectronics N.V.
- Broad global manufacturing footprint supports resilience but adds complexity.
Microchip Technology Incorporated
- Leaner operations focused on embedded solutions may face supply bottlenecks.
6. ESG & Climate Transition
STMicroelectronics N.V.
- Strong ESG initiatives aligned with EU mandates and climate goals.
Microchip Technology Incorporated
- ESG efforts less transparent; US regulatory pressures increasing.
7. Geopolitical Exposure
STMicroelectronics N.V.
- High exposure to Asia Pacific and Europe, vulnerable to trade tensions.
Microchip Technology Incorporated
- Primarily US-based, but global supply chains expose it to geopolitical risks.
Which company shows a better risk-adjusted profile?
STMicroelectronics faces market and operational pressures but benefits from a conservative balance sheet and strong financial health scores. Microchip’s leverage and profitability issues amplify its risk, despite a higher dividend yield. STM’s Altman Z-Score near 4 and Piotroski score of 8 confirm financial stability. Microchip’s weaker profitability and interest coverage create a riskier profile. I see STM as the better risk-adjusted choice given its balanced capital structure and strong financial scores in this turbulent 2026 semiconductor landscape.
Final Verdict: Which stock to choose?
STMicroelectronics N.V. (STM) stands out with its resilient cash generation and strong liquidity, showcasing a robust balance sheet. Its key point of vigilance lies in declining profitability and a shrinking economic moat, which could pressure future returns. STM suits investors with an appetite for cyclical recovery and potential turnaround plays.
Microchip Technology Incorporated (MCHP) boasts a strategic moat in recurring revenue streams and solid gross margins, underpinning its market position. While it carries higher leverage and weaker profitability, its cash flow stability offers relative safety versus STM. MCHP fits portfolios focused on GARP—balancing growth potential with financial prudence.
If you prioritize liquidity and turnaround potential, STM is the compelling choice due to its superior balance sheet strength and recent positive price momentum. However, if you seek steady cash flow and a moat in niche markets, MCHP offers better stability despite its leverage risks. Both present analytical scenarios worth consideration, aligned with distinct investor profiles.
Disclaimer: Investment carries a risk of loss of initial capital. The past performance is not a reliable indicator of future results. Be sure to understand risks before making an investment decision.
Go Further
I encourage you to read the complete analyses of STMicroelectronics N.V. and Microchip Technology Incorporated to enhance your investment decisions: