Home > Comparison > Technology > STM vs LSCC
The strategic rivalry between STMicroelectronics N.V. and Lattice Semiconductor Corporation defines the current trajectory of the semiconductor industry. STMicroelectronics operates as a capital-intensive global semiconductor manufacturer with diverse product segments, while Lattice focuses on niche programmable logic devices with a leaner operational model. This head-to-head represents a contest between broad industrial scale and specialized innovation. This analysis aims to identify which corporate path delivers superior risk-adjusted returns for a diversified portfolio.
Table of contents
Companies Overview
STMicroelectronics and Lattice Semiconductor stand as pivotal players in the global semiconductor industry, shaping innovation across diverse markets.
STMicroelectronics N.V.: Global Semiconductor Powerhouse
STMicroelectronics commands a broad semiconductor portfolio, generating revenue through automotive ICs, analog and MEMS sensors, and microcontrollers. Its 2026 strategy emphasizes integrated solutions in automotive and industrial sectors to capture growing demand for smart electronics and connectivity.
Lattice Semiconductor Corporation: FPGA Innovator
Lattice Semiconductor specializes in field programmable gate arrays (FPGAs) and video connectivity products. In 2026, it focuses on expanding IP licensing and targeting communications, computing, and automotive markets with flexible, low-power semiconductor solutions.
Strategic Collision: Similarities & Divergences
Both companies compete in semiconductors but diverge in approach: STMicroelectronics offers a diversified product ecosystem, while Lattice pursues a niche FPGA and IP-driven model. The key battlefield is embedded systems for automotive and industrial use. Their investment profiles differ sharply—STMicroelectronics benefits from scale and diversification, whereas Lattice bets on innovation and specialization.
Income Statement Comparison
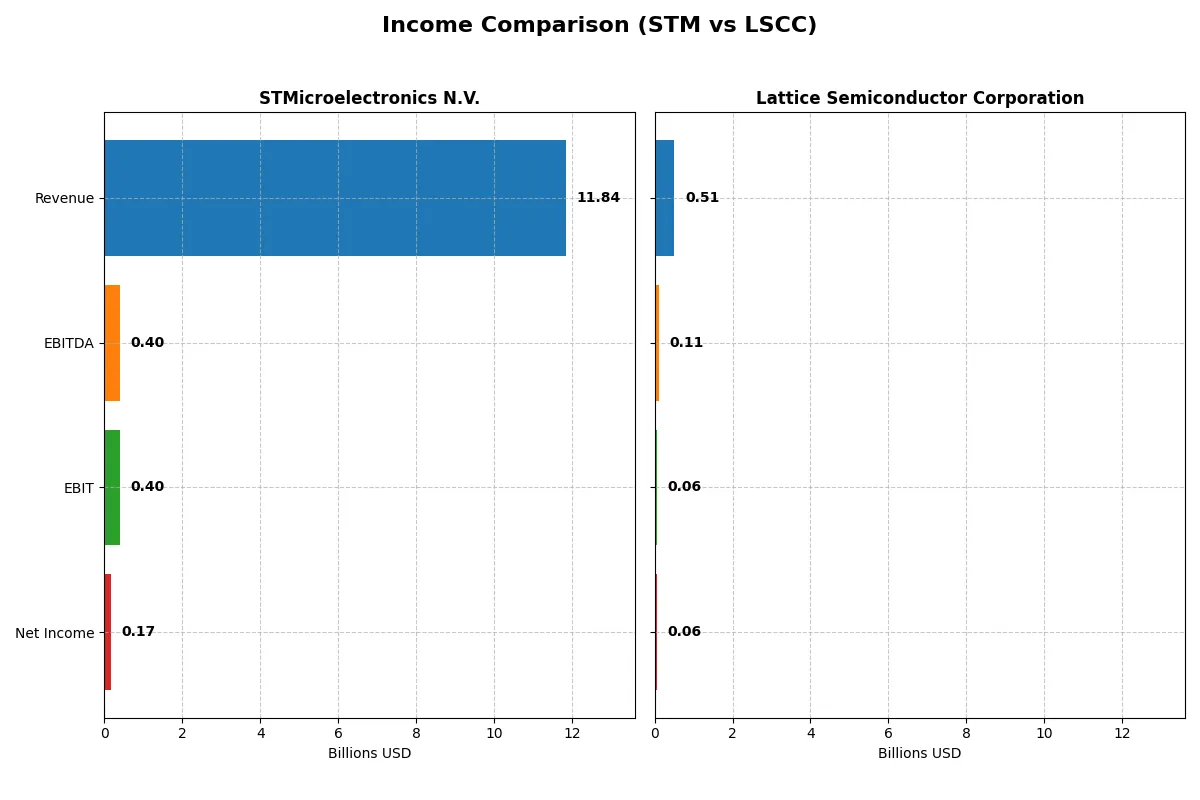
This data dissects the core profitability and scalability of both corporate engines to reveal who dominates the bottom line:
| Metric | STMicroelectronics N.V. (STM) | Lattice Semiconductor Corporation (LSCC) |
|---|---|---|
| Revenue | 11.8B | 509M |
| Cost of Revenue | 7.8B | 169M |
| Operating Expenses | 3.7B | 306M |
| Gross Profit | 4.0B | 340M |
| EBITDA | 401M | 107M |
| EBIT | 401M | 61M |
| Interest Expense | 0 | 0.3M |
| Net Income | 167M | 61M |
| EPS | 0.19 | 0.44 |
| Fiscal Year | 2025 | 2024 |
Income Statement Analysis: The Bottom-Line Duel
This income statement comparison exposes the true operational efficiency and profitability trends of STMicroelectronics and Lattice Semiconductor.
STMicroelectronics N.V. Analysis
STMicroelectronics’ revenue declined by 10.8% in 2025 to $11.8B, with net income plunging 89% to $167M. Gross margin contracted to 33.9%, reflecting margin pressure, and net margin remained thin at 1.4%. The company’s EBIT margin dropped sharply, signaling weak operational momentum and deteriorating profitability.
Lattice Semiconductor Corporation Analysis
Lattice Semiconductor posted $509M in 2024 revenue, down 31% year-over-year, with net income falling 76% to $61M. However, it maintains a robust gross margin of 66.8% and a healthy net margin of 12%. Despite recent setbacks, Lattice shows stronger margin resilience and improved profitability over the longer term.
Margin Resilience vs. Scale Decline
Lattice Semiconductor demonstrates superior margin strength and a favorable income growth trend over five years, despite recent revenue pressure. STMicroelectronics, while larger in scale, suffers steep margin erosion and a severe net income decline. For investors prioritizing profitability and margin sustainability, Lattice’s profile appears more compelling.
Financial Ratios Comparison
These vital ratios act as a diagnostic tool to expose the underlying fiscal health, valuation premiums, and capital efficiency of the companies compared:
| Ratios | STMicroelectronics N.V. (STM) | Lattice Semiconductor Corporation (LSCC) |
|---|---|---|
| ROE | 9.0% | 8.6% |
| ROIC | 0.7% | 4.6% |
| P/E | 14.4 | 132.7 |
| P/B | 1.29 | 11.41 |
| Current Ratio | 3.11 | 3.66 |
| Quick Ratio | 2.37 | 2.62 |
| D/E (Debt-to-Equity) | 0.18 | 0.02 |
| Debt-to-Assets | 12.8% | 1.8% |
| Interest Coverage | 19.7 | 129.5 |
| Asset Turnover | 0.54 | 0.60 |
| Fixed Asset Turnover | 1.22 | 7.62 |
| Payout Ratio | 18.5% | 0 |
| Dividend Yield | 1.28% | 0 |
| Fiscal Year | 2024 | 2024 |
Efficiency & Valuation Duel: The Vital Signs
Ratios act as a company’s DNA, exposing hidden risks and operational strengths that shape investment decisions.
STMicroelectronics N.V.
STMicroelectronics shows weak profitability with ROE at 0.93% and net margin at 1.41%, signaling operational struggles. Valuation metrics like P/E and P/B appear favorable, suggesting the stock isn’t overpriced. The firm does not pay dividends, instead heavily reinvesting 15.7% of revenue into R&D to fuel future growth.
Lattice Semiconductor Corporation
Lattice Semiconductor posts a strong net margin of 12% but weaker returns on equity (8.6%) and invested capital (4.59%). Its valuation is stretched, with a P/E of 132.7 and P/B of 11.4, reflecting high market expectations. The company also opts against dividends, channeling over 31% of revenue into R&D to support innovation.
Premium Valuation vs. Operational Safety
STMicroelectronics trades at reasonable valuations but suffers low profitability and returns, while Lattice offers higher margins yet commands a premium price. For cautious investors, STMicroelectronics’ conservative valuation and reinvestment may appeal, whereas growth seekers might tolerate Lattice’s rich multiples for its stronger profitability.
Which one offers the Superior Shareholder Reward?
I see STMicroelectronics (STM) pays a modest 1.28% dividend yield with a conservative 18% payout ratio, supported by a solid free cash flow coverage. Its buyback intensity is moderate but steady, underpinning sustainable shareholder return. Lattice Semiconductor (LSCC) offers no dividends, opting instead for aggressive reinvestment in R&D and growth, fueling high margins and robust free cash flow with a strong buyback program. Historically, STM’s balanced distribution and capital allocation offer a more predictable income and value stability. LSCC’s high valuation and zero yield imply higher growth risk. For 2026, I favor STM for superior total return through income plus buybacks, reflecting a more sustainable reward profile.
Comparative Score Analysis: The Strategic Profile
The radar chart reveals the fundamental DNA and trade-offs of STMicroelectronics N.V. and Lattice Semiconductor Corporation, highlighting their distinct financial strengths and weaknesses:
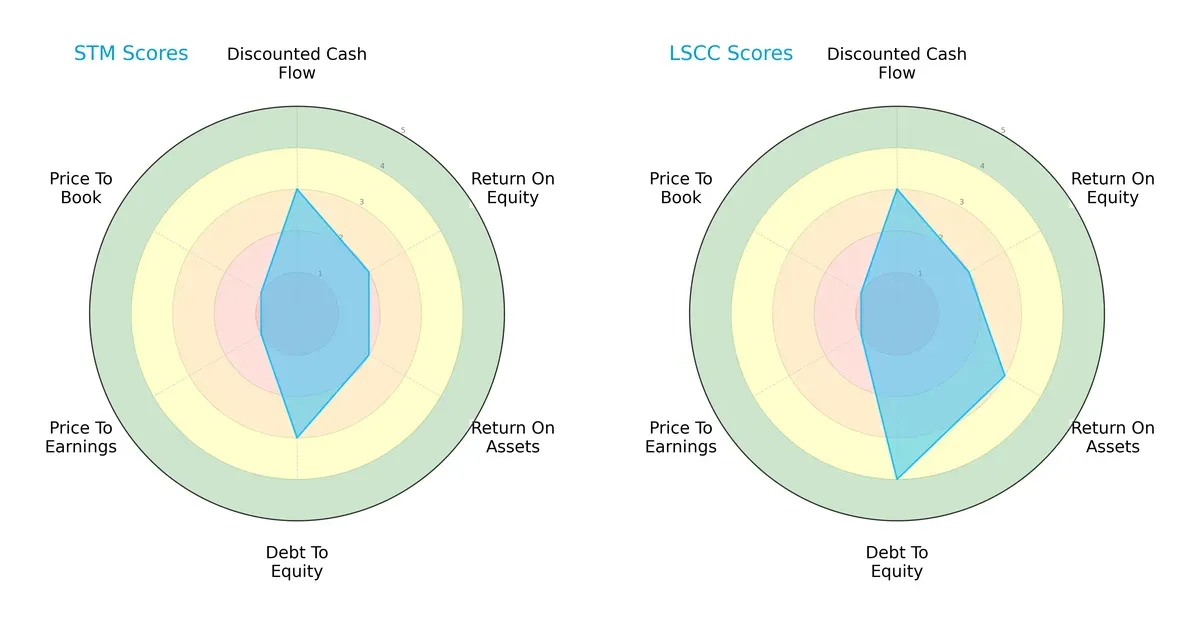
STMicroelectronics and Lattice Semiconductor both score moderately overall with strong discounted cash flow scores (3 each). Lattice edges STM in asset utilization (ROA 3 vs. 2) and maintains a stronger balance sheet (debt/equity 4 vs. 3). However, both struggle with valuation metrics (P/E and P/B scores at 1), indicating potential overvaluation risks. STM shows a more balanced profile, while Lattice leans on superior asset efficiency and leverage management.
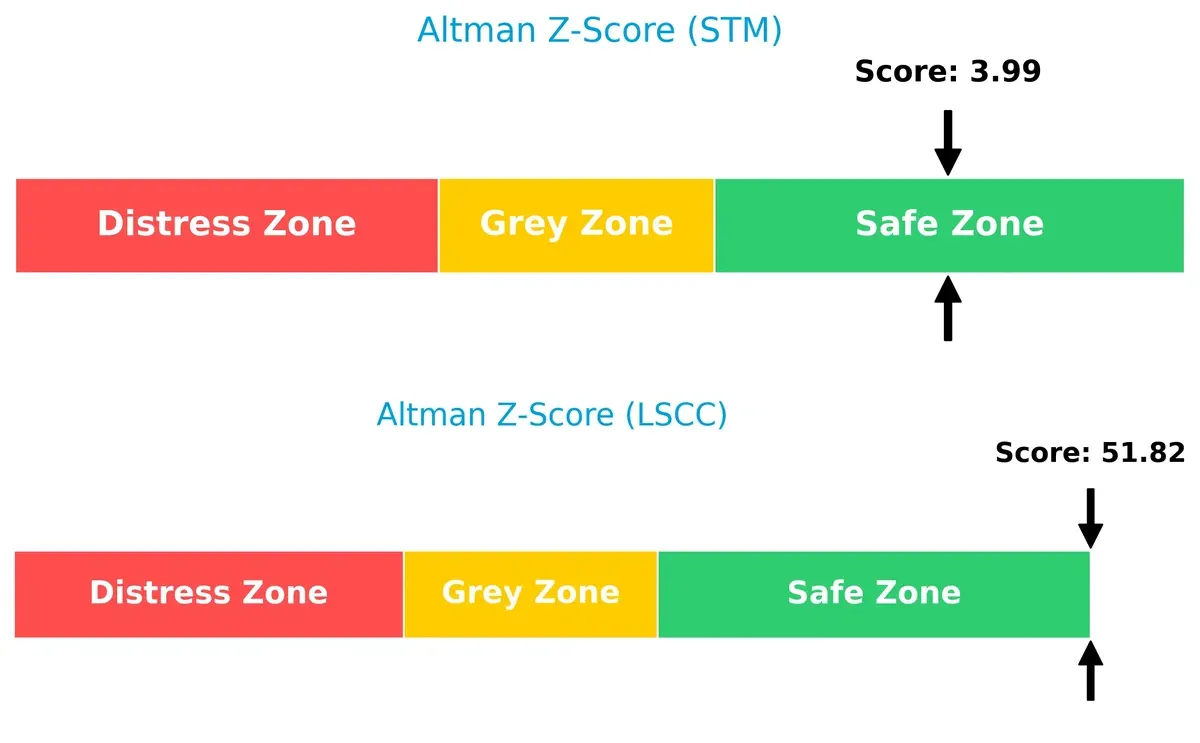
Bankruptcy Risk: Solvency Showdown
Lattice Semiconductor’s Altman Z-Score at 51.8 vastly surpasses STM’s 3.99, placing both firmly in the safe zone but showing Lattice as exceptionally solvent and low risk:
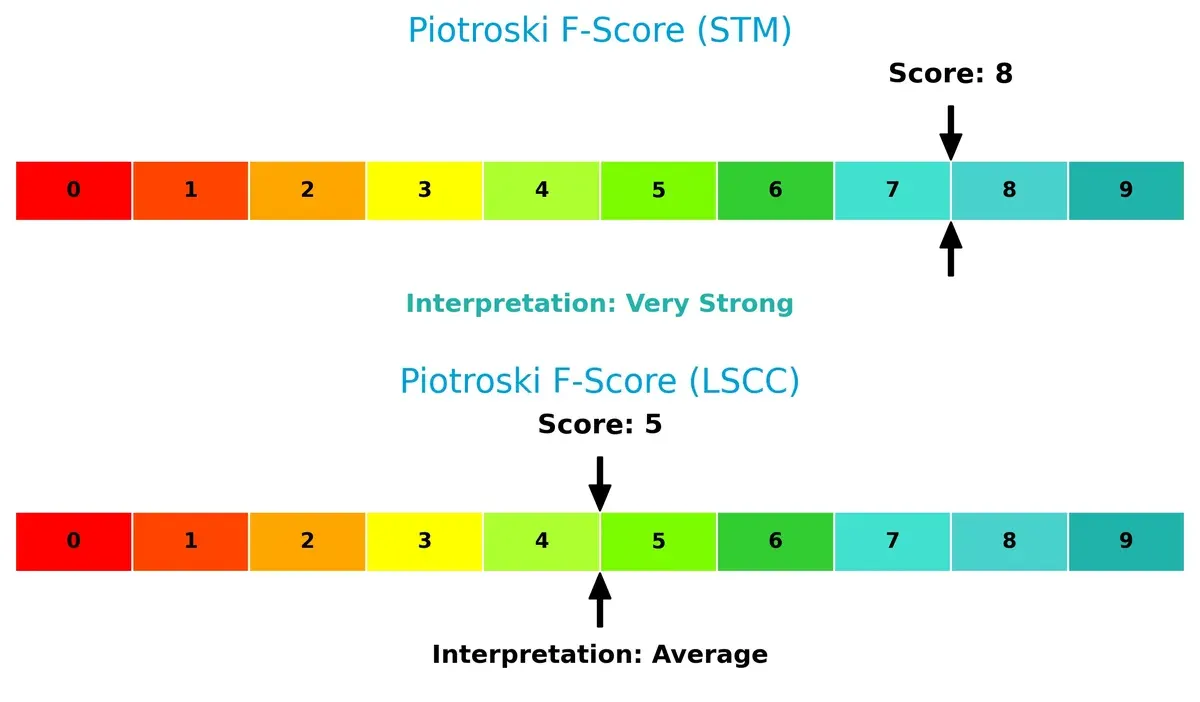
Financial Health: Quality of Operations
STM reports a Piotroski F-Score of 8, signaling robust financial health and operational strength. Lattice’s 5 represents average quality, suggesting some internal weaknesses relative to STM:
How are the two companies positioned?
This section dissects STM and LSCC’s operational DNA by comparing their revenue distribution and internal dynamics, including strengths and weaknesses. The objective is to confront their economic moats to identify the more resilient and sustainable competitive advantage today.
Revenue Segmentation: The Strategic Mix
This visual comparison dissects how STMicroelectronics N.V. and Lattice Semiconductor diversify their income streams and reveals their primary sector bets:
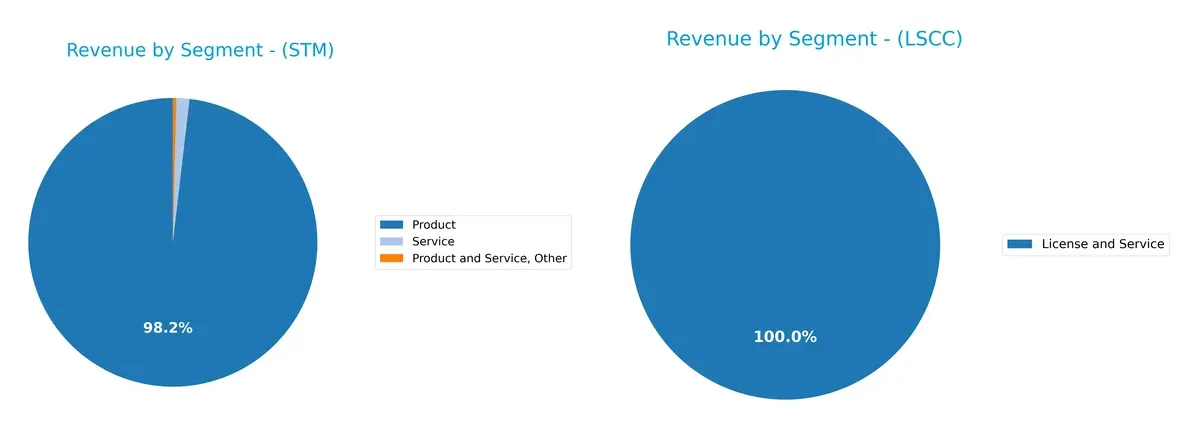
STMicroelectronics anchors most revenue in its Product segment, earning $13.2B in 2024, complemented by modest Service and Other revenues. This signals a classic semiconductor manufacturing focus with some service support. Lattice Semiconductor pivots on distributor-driven product sales totaling $331.9M, dwarfing its direct product and license-service revenue. Lattice’s reliance on distributors introduces concentration risk, while STM’s broader product base supports ecosystem lock-in and infrastructure dominance.
Strengths and Weaknesses Comparison
This table compares the Strengths and Weaknesses of STMicroelectronics and Lattice Semiconductor:
STMicroelectronics Strengths
- Diverse product segments generating over 13B USD revenue
- Strong global presence with key markets in Singapore, US, Switzerland
- Low debt-to-assets ratio at 8.6%
- Favorable quick ratio of 2.43 indicates good liquidity
Lattice Semiconductor Strengths
- High net margin at 12% shows strong profitability
- Extremely low debt-to-assets ratio at 1.81% enhances financial stability
- Outstanding interest coverage ratio at 228.11
- High fixed asset turnover of 7.62 suggests efficient asset use
STMicroelectronics Weaknesses
- Low profitability ratios: net margin 1.41%, ROE 0.93%, ROIC 0.67% below cost of capital
- High current ratio at 3.36 may indicate inefficient asset use
- Asset turnover at 0.48 is unfavorable
- No dividend yield
Lattice Semiconductor Weaknesses
- PE ratio at 132.74 and PB at 11.41 indicate possible overvaluation
- ROE 8.6% and ROIC 4.59% below WACC of 11.72%
- High current ratio at 3.66 may signal ineffective working capital
- No dividend yield
Both companies exhibit financial strengths in liquidity and low leverage, supporting operational stability. STMicroelectronics benefits from broader diversification and global market reach, while Lattice Semiconductor excels in profitability metrics but faces valuation concerns. Each company’s weaknesses highlight challenges in capital efficiency and return on invested capital, which are critical for long-term value creation.
The Moat Duel: Analyzing Competitive Defensibility
A structural moat shields long-term profits from relentless competition erosion. Let’s dissect the competitive defenses of STMicroelectronics and Lattice Semiconductor:
STMicroelectronics N.V.: Diversified Analog & Automotive Moat
STMicroelectronics relies on broad product diversification and niche automotive ICs as its moat. Its financials show margin stability but shrinking ROIC signals weakening profitability. New automotive and industrial markets could deepen this moat if innovation accelerates in 2026.
Lattice Semiconductor Corporation: Specialized FPGA & IP Licensing Moat
Lattice’s moat centers on specialized field programmable gate arrays (FPGAs) and IP licensing. It outperforms STMicroelectronics with higher margins and value creation despite recent revenue dips. Expansion in communications and industrial sectors offers upside potential amid market volatility.
Verdict: Diversification vs. Specialization in a Value-Destroying Environment
Both firms currently destroy value with declining ROICs, but Lattice’s focused product niche and higher margins create a deeper moat. I see Lattice better positioned to defend market share if it leverages IP assets and sector-specific growth efficiently.
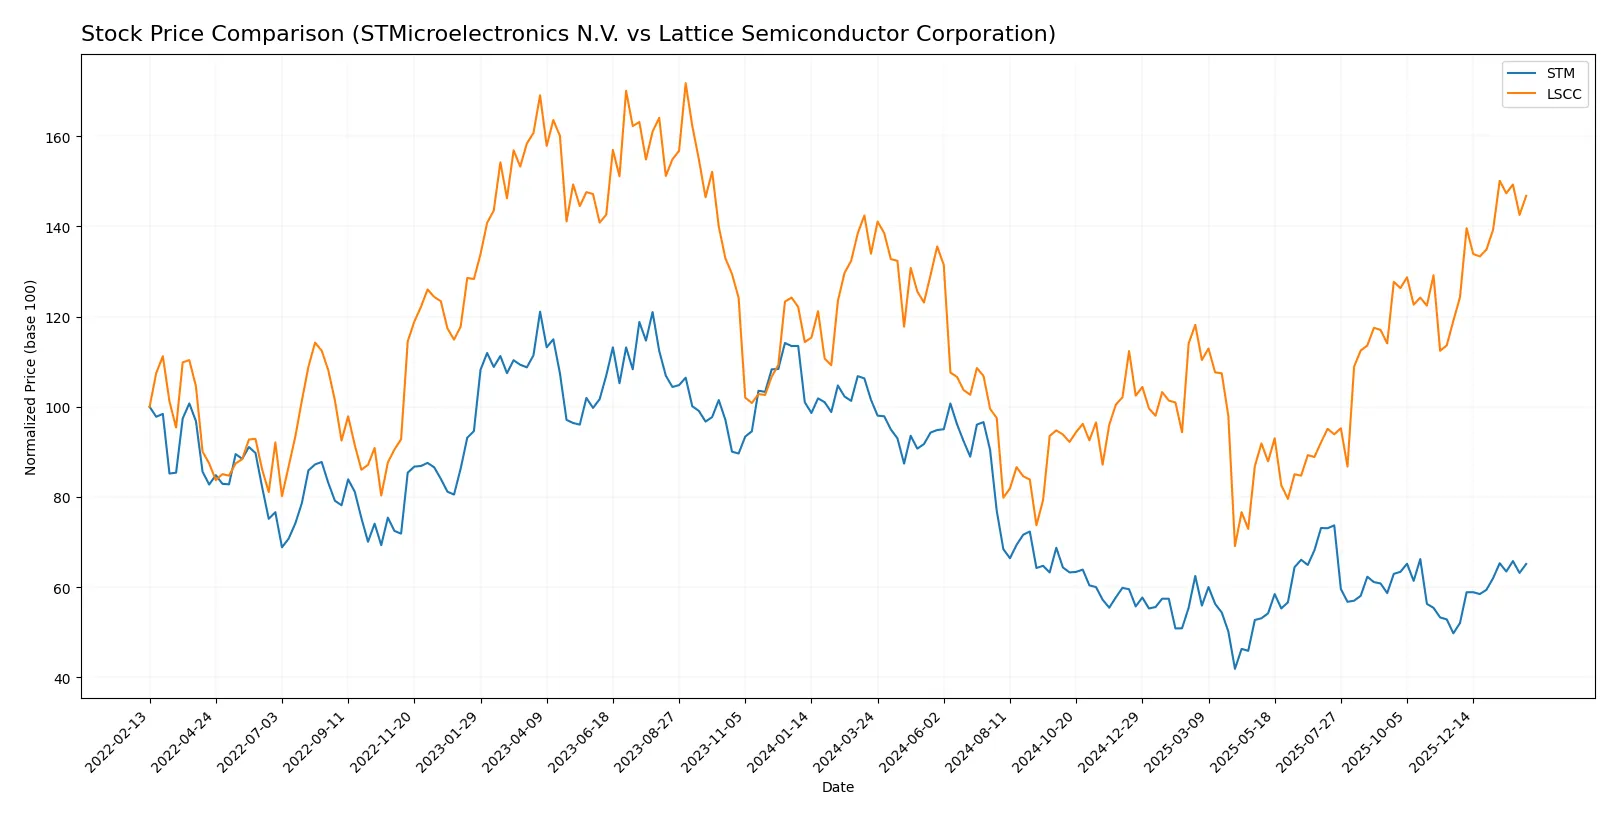
Which stock offers better returns?
The past year shows contrasting price dynamics: STMicroelectronics N.V. declined sharply overall but rebounded recently, while Lattice Semiconductor Corporation gained steadily with accelerating momentum.
Trend Comparison
STMicroelectronics N.V. declined 35.85% over the past 12 months, marking a bearish trend with accelerating downward momentum and a high volatility of 6.54%. It hit a low of 18.49 and a high of 44.85.
Lattice Semiconductor Corporation rose 9.6% over the past year, displaying a bullish trend with accelerating gains and greater volatility at 11.21%. Its price ranged from 39.03 to 84.8.
Comparing recent performance, both stocks accelerated gains since November 2025, but STMicroelectronics’ recent 30.95% rise contrasts with Lattice’s 23.27%, showing stronger short-term recovery despite the longer-term loss.
Target Prices
Analysts present a bullish consensus for STMicroelectronics N.V. and Lattice Semiconductor Corporation with solid upside potential.
| Company | Target Low | Target High | Consensus |
|---|---|---|---|
| STMicroelectronics N.V. | 28 | 45 | 37.67 |
| Lattice Semiconductor Corporation | 65 | 105 | 84.67 |
The target consensus for STM at 37.67 suggests a roughly 31% upside from the current 28.77 price. LSCC’s 84.67 target implies a modest 2% premium over its current 82.91 price.

Don’t Let Luck Decide Your Entry Point
Optimize your entry points with our advanced ProRealTime indicators. You’ll get efficient buy signals with precise price targets for maximum performance. Start outperforming now!
How do institutions grade them?
STMicroelectronics N.V. Grades
The following table summarizes recent analyst grades for STMicroelectronics N.V.:
| Grading Company | Action | New Grade | Date |
|---|---|---|---|
| TD Cowen | Maintain | Buy | 2025-10-24 |
| Susquehanna | Maintain | Positive | 2025-10-22 |
| Susquehanna | Maintain | Positive | 2025-07-25 |
| Baird | Upgrade | Outperform | 2025-07-22 |
| Susquehanna | Maintain | Positive | 2025-07-22 |
| Jefferies | Upgrade | Buy | 2025-02-19 |
| Bernstein | Downgrade | Market Perform | 2025-02-05 |
| Susquehanna | Maintain | Positive | 2025-01-31 |
| Barclays | Downgrade | Underweight | 2025-01-22 |
| JP Morgan | Downgrade | Neutral | 2024-12-09 |
Lattice Semiconductor Corporation Grades
Below is a summary of recent analyst grades for Lattice Semiconductor Corporation:
| Grading Company | Action | New Grade | Date |
|---|---|---|---|
| Susquehanna | Maintain | Positive | 2026-01-22 |
| Keybanc | Maintain | Overweight | 2026-01-13 |
| Baird | Maintain | Outperform | 2025-11-04 |
| Rosenblatt | Maintain | Buy | 2025-11-04 |
| Benchmark | Maintain | Buy | 2025-11-04 |
| Stifel | Maintain | Buy | 2025-11-04 |
| Needham | Maintain | Buy | 2025-11-04 |
| Susquehanna | Maintain | Positive | 2025-10-22 |
| Keybanc | Maintain | Overweight | 2025-09-30 |
| Needham | Maintain | Buy | 2025-09-22 |
Which company has the best grades?
Lattice Semiconductor consistently receives strong Buy and Outperform ratings without downgrades. STMicroelectronics shows mixed grades, including recent downgrades. This suggests Lattice may have more stable institutional support, potentially influencing investor confidence differently.
Risks specific to each company
The following categories identify the critical pressure points and systemic threats facing both firms in the 2026 market environment:
1. Market & Competition
STMicroelectronics N.V.
- Competes globally in diverse semiconductor segments, facing intense competition from large integrated device manufacturers.
Lattice Semiconductor Corporation
- Operates in niche FPGA and ASIC markets but faces aggressive competition from larger semiconductor firms and IP licensors.
2. Capital Structure & Debt
STMicroelectronics N.V.
- Maintains low debt-to-equity (0.12) and debt-to-assets (8.6%), indicating a conservative capital structure.
Lattice Semiconductor Corporation
- Exhibits an even lower debt load (debt-to-equity 0.02, debt-to-assets 1.81%), reflecting strong balance sheet discipline.
3. Stock Volatility
STMicroelectronics N.V.
- Beta of 1.32 signals moderate volatility, slightly above the S&P 500 average, implying moderate market risk.
Lattice Semiconductor Corporation
- Higher beta of 1.67 suggests elevated volatility and sensitivity to market fluctuations.
4. Regulatory & Legal
STMicroelectronics N.V.
- Exposes to EU and global regulatory frameworks, including export controls and product compliance in automotive and industrial sectors.
Lattice Semiconductor Corporation
- Subject to US regulatory environment and IP licensing risks, with potential challenges in international trade policies.
5. Supply Chain & Operations
STMicroelectronics N.V.
- Large global footprint and diverse supplier base reduce supply chain concentration risk but increase complexity.
Lattice Semiconductor Corporation
- Smaller scale and reliance on third-party manufacturers elevate operational risk amid semiconductor supply constraints.
6. ESG & Climate Transition
STMicroelectronics N.V.
- European headquarters imply stricter ESG standards and climate transition pressures, with growing regulatory scrutiny.
Lattice Semiconductor Corporation
- US-based but smaller scale may face less regulatory pressure; however, ESG trends in semiconductor manufacturing remain a concern.
7. Geopolitical Exposure
STMicroelectronics N.V.
- Operates in multiple regions, including Asia-Pacific, exposing it to US-China tensions and supply chain disruptions.
Lattice Semiconductor Corporation
- Primarily US-focused but sells globally, facing similar geopolitical risks with potential tariff and export restrictions.
Which company shows a better risk-adjusted profile?
STMicroelectronics’ most impactful risk lies in its complex global supply chain and geopolitical exposure, which could disrupt production. Lattice Semiconductor faces its biggest risk from elevated stock volatility and valuation concerns amid competitive pressures. I observe that STM’s robust capital structure and strong Altman Z-Score (3.99) provide a safer financial cushion. Conversely, LSCC’s higher beta (1.67) and stretched valuation metrics pose downside risks. Overall, STM presents a more balanced risk profile suited for cautious investors seeking stability in a volatile 2026 semiconductor market.
Final Verdict: Which stock to choose?
STMicroelectronics N.V. (STM) stands out for its robust liquidity and solid capital structure, reflecting a strong balance sheet foundation. Its key superpower lies in operational resilience, yet its declining profitability signals a point of vigilance. STM fits portfolios focused on value-seeking investors willing to tolerate near-term earnings challenges for potential long-term turnaround.
Lattice Semiconductor Corporation (LSCC) boasts a strategic moat through its high-margin niche and impressive R&D intensity, underpinning innovation leadership. Relative to STM, LSCC offers a more dynamic growth profile but at a higher valuation and with greater volatility. It suits growth-at-a-reasonable-price (GARP) investors who prioritize market potential and innovation-driven expansion.
If you prioritize financial stability and capital preservation, STM is the compelling choice due to its healthier balance sheet and operational endurance. However, if you seek growth fueled by innovation and are comfortable with valuation premiums and cyclical risks, LSCC offers superior upside potential. Both present analytical scenarios rather than clear-cut calls, demanding careful risk assessment aligned with your investment horizon.
Disclaimer: Investment carries a risk of loss of initial capital. The past performance is not a reliable indicator of future results. Be sure to understand risks before making an investment decision.
Go Further
I encourage you to read the complete analyses of STMicroelectronics N.V. and Lattice Semiconductor Corporation to enhance your investment decisions: