Home > Comparison > Technology > STM vs INDI
The strategic rivalry between STMicroelectronics N.V. and indie Semiconductor, Inc. shapes the semiconductor industry’s evolution. STMicroelectronics operates as a diversified, capital-intensive giant with a broad portfolio across automotive, industrial, and consumer markets. Indie Semiconductor, a nimble innovator, focuses on high-growth automotive semiconductor and software solutions. This analysis will assess which business model offers superior risk-adjusted returns amid shifting technology trends and sector dynamics.
Table of contents
Companies Overview
STMicroelectronics and indie Semiconductor are key players shaping the automotive semiconductor market.
STMicroelectronics N.V.: Global Semiconductor Powerhouse
STMicroelectronics dominates as a diversified semiconductor manufacturer with a broad product portfolio. It generates revenue from automotive integrated circuits, industrial ASICs, MEMS sensors, and microcontrollers. In 2026, its strategic focus centers on expanding automotive and industrial applications while leveraging cutting-edge analog and digital IC technologies.
indie Semiconductor, Inc.: Specialized Automotive Innovator
indie Semiconductor targets the automotive semiconductor niche with advanced driver assistance and connected car solutions. Its revenue stems from ultrasound sensors, in-cabin wireless charging, infotainment, and photonic components. The company’s 2026 strategy emphasizes innovation in electrification and enhanced user experience through software-driven semiconductor products.
Strategic Collision: Similarities & Divergences
Both firms prioritize automotive semiconductor technologies but differ in scope and scale. STMicroelectronics embraces a broad, multi-segment approach, while indie Semiconductor focuses on specialized software-integrated devices. Their primary battleground is the evolving automotive electronics market. Investors face contrasting profiles: STMicroelectronics offers stability through diversification; indie Semiconductor embodies high growth potential with elevated volatility.
Income Statement Comparison
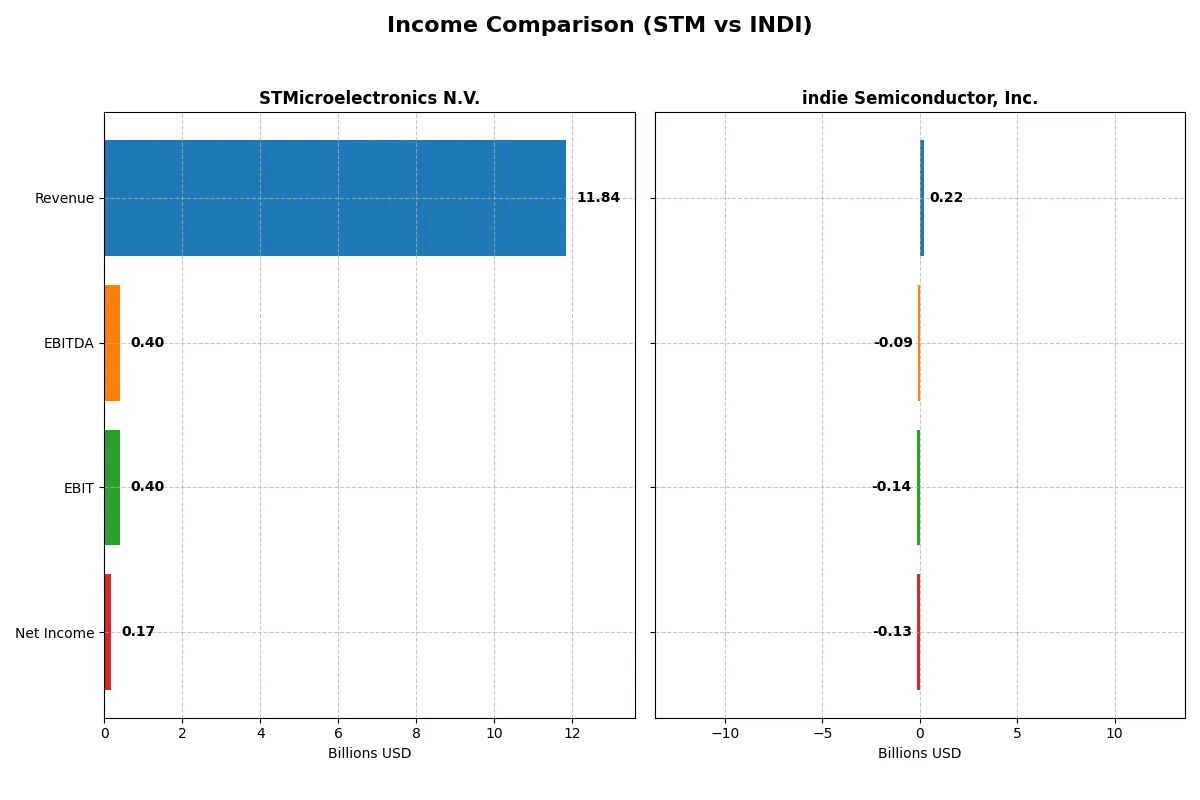
This data dissects the core profitability and scalability of both corporate engines to reveal who dominates the bottom line:
| Metric | STMicroelectronics N.V. (STM) | indie Semiconductor, Inc. (INDI) |
|---|---|---|
| Revenue | 11.8B | 217M |
| Cost of Revenue | 7.8B | 126M |
| Operating Expenses | 3.7B | 260M |
| Gross Profit | 4.0B | 90M |
| EBITDA | 401M | -94M |
| EBIT | 401M | -137M |
| Interest Expense | 0 | 9.3M |
| Net Income | 167M | -133M |
| EPS | 0.19 | -0.76 |
| Fiscal Year | 2025 | 2024 |
Income Statement Analysis: The Bottom-Line Duel
Comparing these income statements reveals the true operational efficiency and profitability dynamics driving each company’s financial engine.
STMicroelectronics N.V. Analysis
STMicroelectronics’s revenue declined by 10.8% in 2025, dropping to $11.8B, with net income plunging 89% to $167M. Gross margin remains healthy at 33.9%, but net margin shrank to 1.4%, signaling margin compression. The sharp fall in EBIT and EPS highlights efficiency challenges and weak momentum entering 2026.
indie Semiconductor, Inc. Analysis
indie Semiconductor’s 2024 revenue slipped 2.9% to $217M, yet gross profit surged 264%, lifting gross margin to 41.7%. Despite an EBIT loss of -$137M and net margin at -61.2%, EPS improved 6.2%, reflecting operational progress. The steep negative margins show ongoing scaling costs amid improving core profitability signals.
Margin Resilience vs. Revenue Scale
STMicroelectronics dominates by scale and positive net income, but its deteriorating margins and earnings cast doubt on near-term efficiency. indie Semiconductor posts stronger gross margins and EPS growth but remains deeply unprofitable. For investors, STMicroelectronics offers stability albeit with margin risks; indie’s profile suits those focused on early-stage margin expansion and future growth potential.
Financial Ratios Comparison
These vital ratios act as a diagnostic tool to expose the underlying fiscal health, valuation premiums, and capital efficiency of each company:
| Ratios | STMicroelectronics N.V. (STM) | indie Semiconductor, Inc. (INDI) |
|---|---|---|
| ROE | 0.0093 | -0.3173 |
| ROIC | 0.0067 | -0.1925 |
| P/E | 14.43 | -5.35 |
| P/B | 1.29 | 1.70 |
| Current Ratio | 3.11 | 4.82 |
| Quick Ratio | 2.37 | 4.23 |
| D/E | 0.18 | 0.95 |
| Debt-to-Assets | 0.13 | 0.42 |
| Interest Coverage | 19.72 | -18.37 |
| Asset Turnover | 0.54 | 0.23 |
| Fixed Asset Turnover | 1.22 | 4.30 |
| Payout ratio | 0.18 | 0 |
| Dividend yield | 1.28% | 0% |
| Fiscal Year | 2024 | 2024 |
Efficiency & Valuation Duel: The Vital Signs
Financial ratios act as a company’s DNA, exposing hidden risks and operational excellence critical to investor decisions.
STMicroelectronics N.V.
STMicroelectronics shows weak profitability with a 0.93% ROE and 1.41% net margin, signaling operational challenges. Its valuation metrics like P/E and P/B are favorable, suggesting the stock is reasonably priced. The company pays no dividend but invests heavily in R&D, fueling future growth prospects despite a stretched current ratio of 3.36.
indie Semiconductor, Inc.
Indie Semiconductor struggles with deeply negative returns: a -31.73% ROE and -61.2% net margin reflect heavy losses. Its P/E is favorable due to negative earnings, but overall valuation feels stretched. The firm pays no dividend and focuses on aggressive R&D and stock-based compensation, highlighting a growth strategy amid substantial financial risks and a high debt ratio.
Growth Aspirations vs. Operational Stability
STMicroelectronics offers a more balanced risk-reward profile with reasonable valuation and sustainable capital allocation. Indie Semiconductor’s high-risk growth approach presents potential but suffers from poor profitability and financial stress. Investors seeking stability lean toward STMicroelectronics, while those accepting volatility might consider Indie’s speculative profile.
Which one offers the Superior Shareholder Reward?
I find STMicroelectronics (STM) delivers superior shareholder reward compared to indie Semiconductor (INDI). STM pays a steady dividend with a 1.28% yield and a sustainable payout ratio near 18%, supported by positive free cash flow. Its moderate buyback activity further enhances returns. INDI pays no dividends, burns cash deeply, and shows negative margins. Its reinvestment focuses on growth but lacks cash generation and buybacks, raising sustainability concerns. STM’s balanced distribution and solid cash flow underpin a more reliable total return profile for 2026 investors.
Comparative Score Analysis: The Strategic Profile
The radar chart reveals the fundamental DNA and trade-offs of STMicroelectronics N.V. and indie Semiconductor, Inc., highlighting their financial strengths and weaknesses:
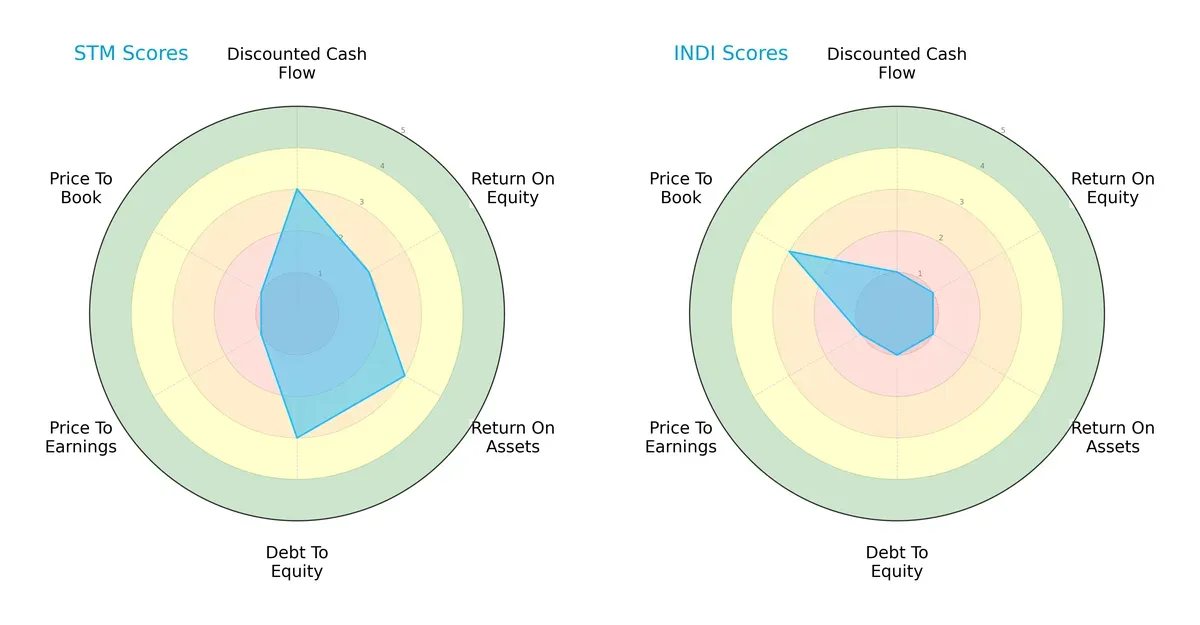
STMicroelectronics shows a more balanced profile with moderate scores in discounted cash flow (3), return on equity (2), return on assets (3), and debt-to-equity (3). However, it suffers in valuation metrics, scoring very low in price-to-earnings (1) and price-to-book (1). Indie Semiconductor relies heavily on a slightly better price-to-book score (3) but lags significantly in all other areas, including DCF, ROE, ROA, and debt-to-equity, all scoring 1. Overall, STM exhibits diversified strengths, while INDI depends on a single valuation advantage.
Bankruptcy Risk: Solvency Showdown
The Altman Z-Score gap underscores stark differences in financial stability:
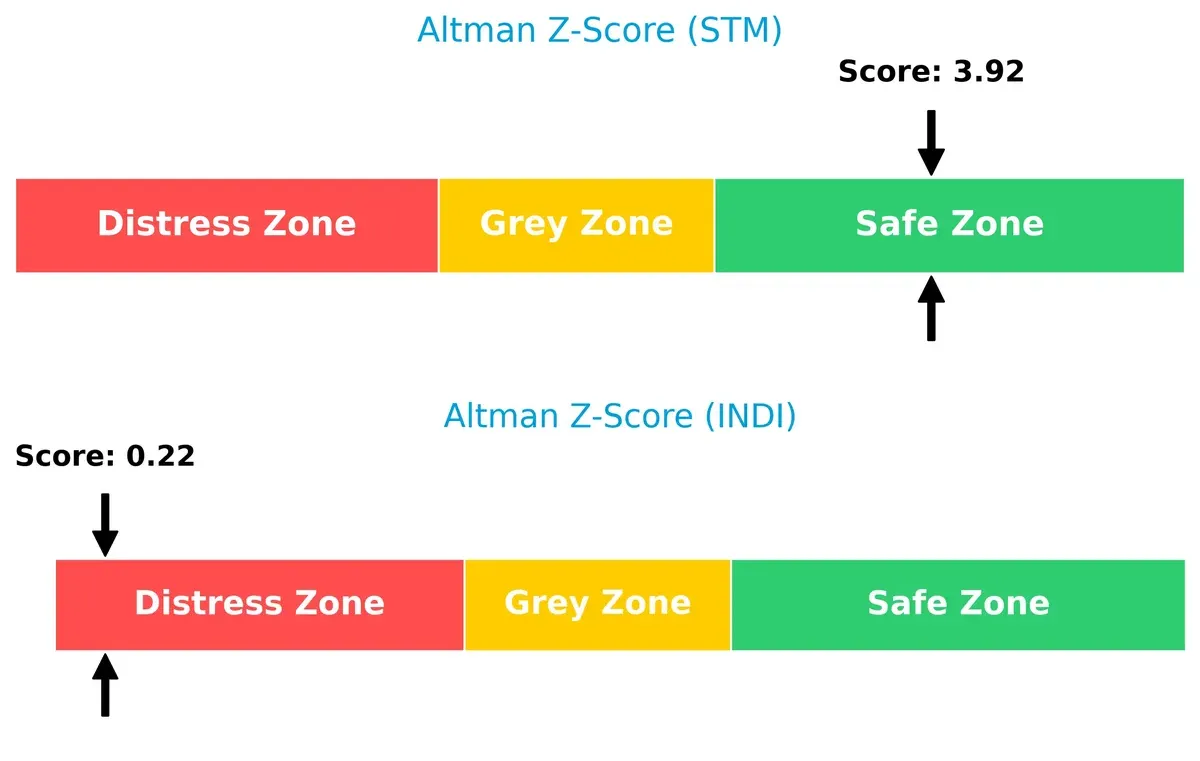
STMicroelectronics scores a robust 3.92, placing it firmly in the safe zone, indicating low bankruptcy risk and resilience in this economic cycle. Indie Semiconductor’s score of 0.22 signals distress and a high probability of financial distress. This contrast highlights STM’s superior long-term survivability.
Financial Health: Quality of Operations
Piotroski F-Score comparisons reveal operational quality differences:
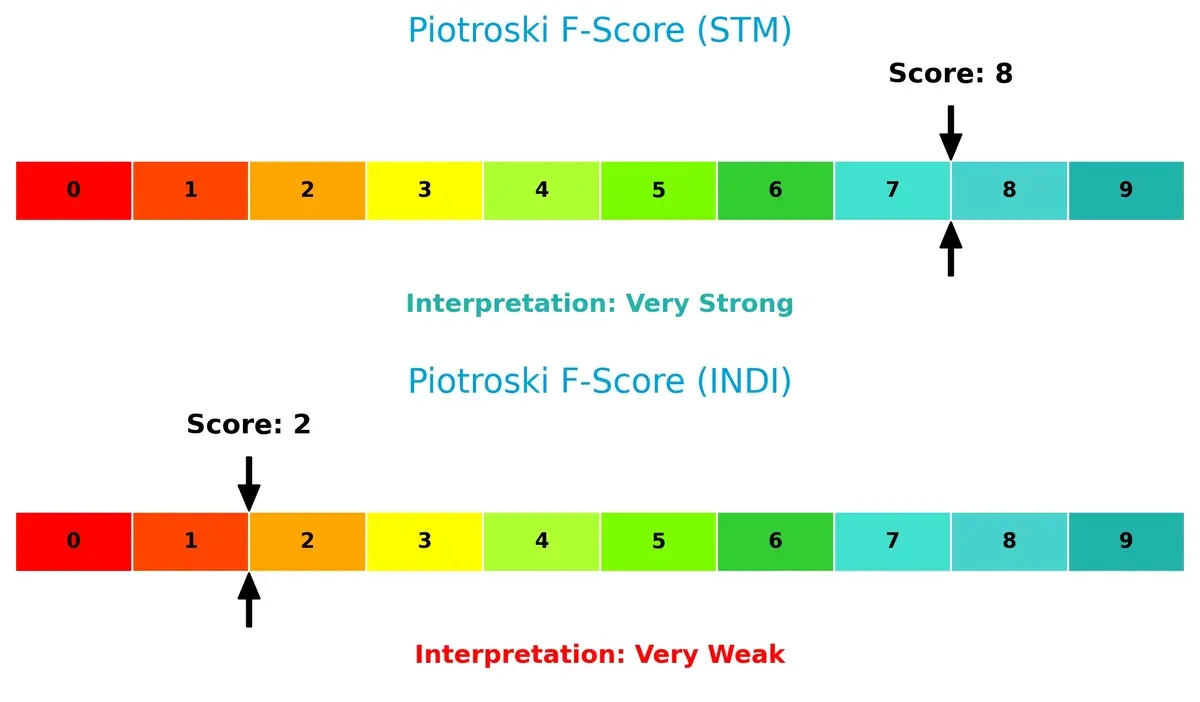
STMicroelectronics achieves a very strong score of 8, indicating excellent financial health and internal operational strength. Indie Semiconductor’s score of 2 flags significant red flags and weak fundamentals. Investors should treat INDI’s operational metrics with caution relative to STM’s robust profile.
How are the two companies positioned?
This section dissects STM and INDI’s operational DNA by comparing their revenue distribution and internal dynamics. The goal: confront their economic moats to reveal which model delivers the most resilient competitive advantage today.
Revenue Segmentation: The Strategic Mix
The following visual comparison dissects how STMicroelectronics N.V. and indie Semiconductor, Inc. diversify their income streams and where their primary sector bets lie:
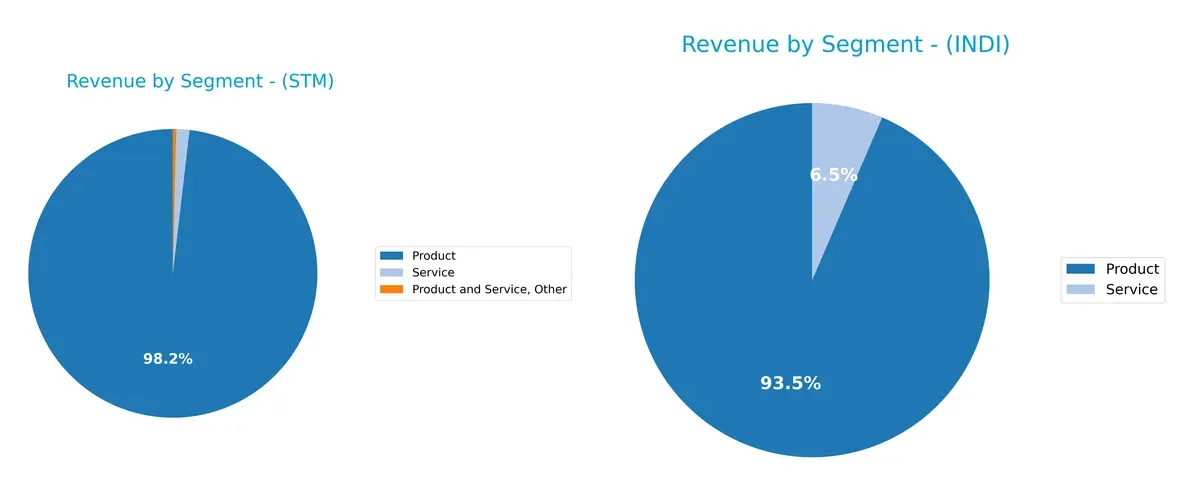
STMicroelectronics anchors its revenue with a massive $13.2B product segment and a small $52M other segment, showing a concentrated but stable product-driven model. Indie Semiconductor, with $203M product and $14M service revenues, leans heavily on product sales but shows slightly more balance with service income. STM’s dominance in products signals infrastructure strength, while indie’s smaller scale and service exposure suggest evolving diversification but higher concentration risk.
Strengths and Weaknesses Comparison
This table compares the strengths and weaknesses of STMicroelectronics and indie Semiconductor based on key financial and operational metrics:
STMicroelectronics Strengths
- Strong global presence with significant revenues from Singapore, US, and Switzerland
- Favorable quick ratio at 2.43 and low debt-to-assets at 8.6%
- Infinite interest coverage indicates robust ability to meet interest expenses
- Favorable PE and PB ratios reflecting market valuation
indie Semiconductor Strengths
- Favorable fixed asset turnover of 4.3 indicating efficient asset use
- Favorable quick ratio of 4.23 supports short-term liquidity
- Favorable PE ratio despite negative earnings
- Diversified geographic sales including China, US, and Europe
STMicroelectronics Weaknesses
- Low profitability with net margin 1.41% and ROE 0.93% below cost of capital
- Unfavorable asset turnover at 0.48 suggests low capital efficiency
- High current ratio at 3.36 flagged as unfavorable, possible working capital inefficiency
- Zero dividend yield limits income appeal
indie Semiconductor Weaknesses
- Large negative net margin (-61.2%) and ROE (-31.73%) highlight severe losses
- Unfavorable WACC at 11.32% and negative interest coverage (-14.8) imply high financial risk
- High current ratio at 4.82 signals potential liquidity management issues
- Debt-to-equity near 1 and no dividends indicate capital structure strain
STMicroelectronics shows balanced financial health with strong geographic diversification but struggles with profitability and operational efficiency. indie Semiconductor faces significant profitability and financial leverage challenges despite efficient asset use and geographic diversification. These factors shape each company’s capacity to pursue growth and stability.
The Moat Duel: Analyzing Competitive Defensibility
A structural moat is the only barrier protecting long-term profits from relentless competitive erosion. Let’s dissect the distinct moats of these two semiconductor players:
STMicroelectronics N.V.: Diversified Analog and Automotive Integration Moat
STM’s moat stems from its broad analog and automotive semiconductor portfolio, creating moderate switching costs and industrial embeddedness. Its financials show stable gross margins near 34% but shrinking EBIT and net margins signal pressure. In 2026, expansion into MEMS and GaN power transistors could deepen its moat if profitability recovers.
indie Semiconductor, Inc.: Innovation-Driven Automotive Software and Sensors Moat
indie’s moat relies on cutting-edge automotive semiconductors and software, focusing on user experience and connectivity. Unlike STM, indie exhibits higher gross margins (42%) but suffers steep net losses and negative EBIT margins, reflecting early-stage investment. Continued innovation and market penetration in ADAS systems could widen its moat if scaled efficiently.
Legacy Diversification vs. Innovation Focus: The Moat Battle
STM’s moat benefits from diversification and established industrial ties but suffers declining ROIC and profitability. indie’s moat is innovation-centric but hampered by negative returns and high capital burn. Both destroy value currently, yet STM’s broader product base offers a more durable moat to defend market share under economic pressure.
Which stock offers better returns?
The past year shows both STMicroelectronics N.V. and indie Semiconductor, Inc. faced steep declines but ended with cautious upward momentum in recent months.
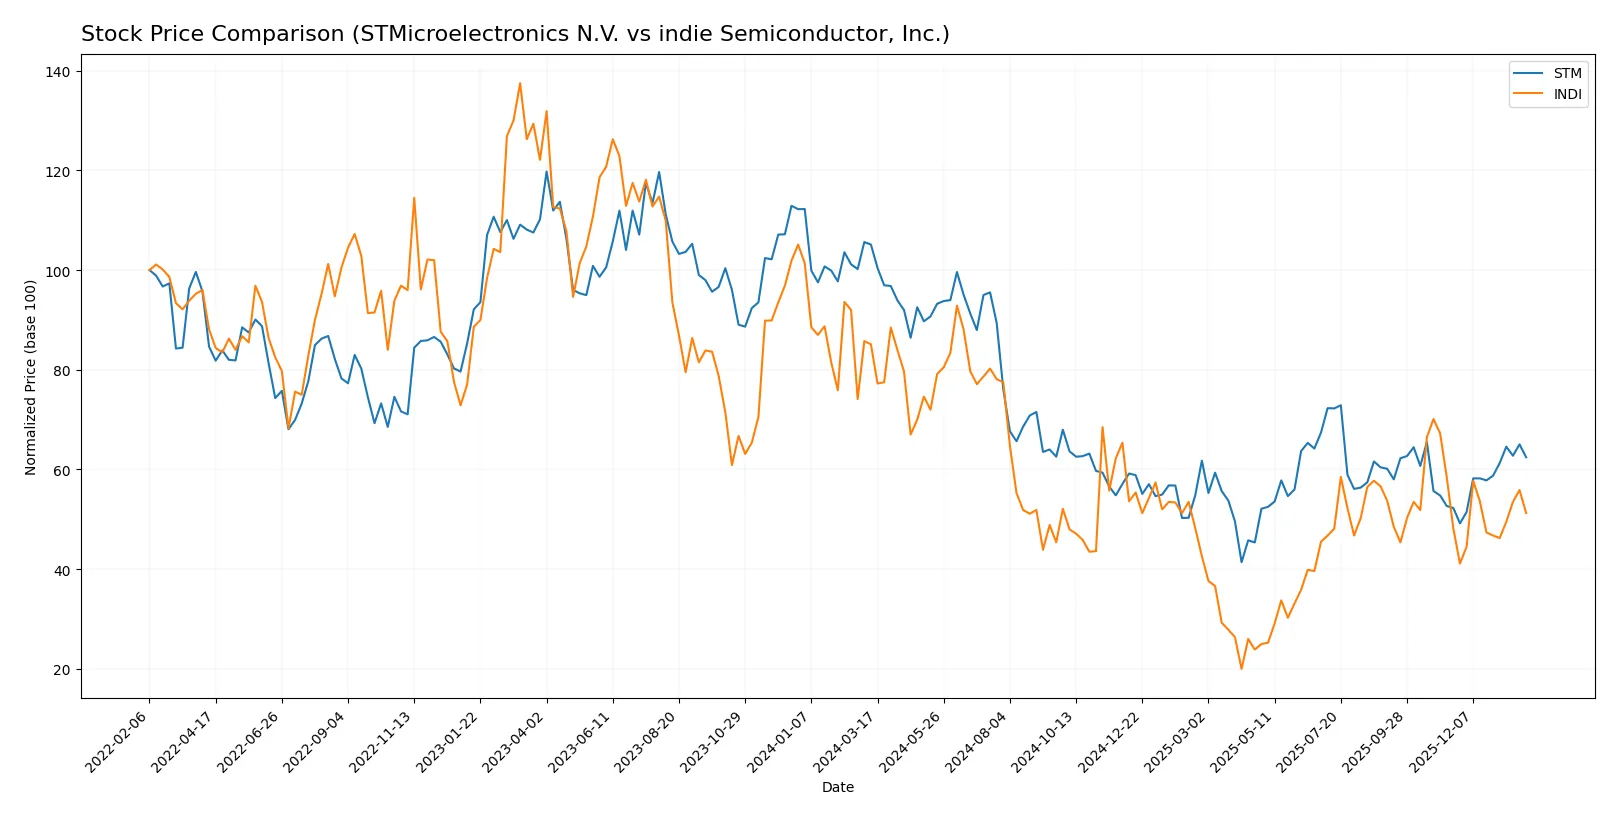
Trend Comparison
STMicroelectronics N.V. exhibits a bearish trend over the past 12 months, with a 40.6% price drop and accelerating downward momentum, despite a recent 19.49% rebound since November 2025. The stock’s volatility is notable, reflected by a 6.77 standard deviation and a wide price range between 18.49 and 46.95.
indie Semiconductor, Inc. also trends bearish with a 39.79% decline over the year, accompanied by accelerating losses. Its recent recovery is milder, at 6.49% since November 2025, with lower volatility indicated by a 1.32 standard deviation and a price range from 1.6 to 7.43.
Both stocks remain in bearish territory over the full year. STMicroelectronics N.V. delivered a stronger recent recovery and higher volatility, ultimately underperforming indie Semiconductor, Inc. in overall market resilience.
Target Prices
Analysts present a mixed but generally optimistic outlook for these semiconductor stocks.
| Company | Target Low | Target High | Consensus |
|---|---|---|---|
| STMicroelectronics N.V. | 28 | 45 | 37.67 |
| indie Semiconductor, Inc. | 8 | 8 | 8 |
STMicroelectronics’ consensus target of 37.67 implies roughly 35% upside from the current 27.89 price. indie Semiconductor’s target at 8 suggests nearly 95% upside from 4.1, reflecting high growth expectations but also elevated risk.

Don’t Let Luck Decide Your Entry Point
Optimize your entry points with our advanced ProRealTime indicators. You’ll get efficient buy signals with precise price targets for maximum performance. Start outperforming now!
How do institutions grade them?
STMicroelectronics N.V. Grades
The following table summarizes the recent grades assigned to STMicroelectronics by reputable firms:
| Grading Company | Action | New Grade | Date |
|---|---|---|---|
| TD Cowen | Maintain | Buy | 2025-10-24 |
| Susquehanna | Maintain | Positive | 2025-10-22 |
| Susquehanna | Maintain | Positive | 2025-07-25 |
| Baird | Upgrade | Outperform | 2025-07-22 |
| Susquehanna | Maintain | Positive | 2025-07-22 |
| Jefferies | Upgrade | Buy | 2025-02-19 |
| Bernstein | Downgrade | Market Perform | 2025-02-05 |
| Susquehanna | Maintain | Positive | 2025-01-31 |
| Barclays | Downgrade | Underweight | 2025-01-22 |
| JP Morgan | Downgrade | Neutral | 2024-12-09 |
indie Semiconductor, Inc. Grades
Below are the recent grades assigned to indie Semiconductor by recognized grading companies:
| Grading Company | Action | New Grade | Date |
|---|---|---|---|
| UBS | Maintain | Neutral | 2025-11-10 |
| Benchmark | Maintain | Buy | 2025-06-25 |
| Benchmark | Maintain | Buy | 2025-06-11 |
| Benchmark | Maintain | Buy | 2025-05-21 |
| Benchmark | Maintain | Buy | 2025-05-13 |
| Craig-Hallum | Maintain | Buy | 2025-05-13 |
| Keybanc | Maintain | Overweight | 2025-05-13 |
| Benchmark | Maintain | Buy | 2025-04-09 |
| Benchmark | Maintain | Buy | 2025-02-21 |
| Keybanc | Maintain | Overweight | 2025-02-21 |
Which company has the best grades?
STMicroelectronics has a diverse mix of Buy, Outperform, and Positive grades, but also several downgrades. indie Semiconductor consistently earns Buy and Overweight ratings with no downgrades. This suggests indie Semiconductor’s grades appear more stable, potentially signaling steadier investor sentiment.
Risks specific to each company
The following categories identify the critical pressure points and systemic threats facing both firms in the 2026 market environment:
1. Market & Competition
STMicroelectronics N.V.
- Established global footprint with broad semiconductor portfolio faces intense competition from integrated device manufacturers.
indie Semiconductor, Inc.
- Niche focus on automotive semiconductors exposes it to high competition from larger, diversified players and emerging startups.
2. Capital Structure & Debt
STMicroelectronics N.V.
- Low debt-to-equity ratio (0.12) signals conservative leverage with strong interest coverage (infinite).
indie Semiconductor, Inc.
- High debt ratio (0.95) and negative interest coverage (-14.8) indicate elevated financial risk and potential solvency concerns.
3. Stock Volatility
STMicroelectronics N.V.
- Beta of 1.29 suggests moderate market sensitivity, typical for established semiconductor firms.
indie Semiconductor, Inc.
- Beta of 2.54 reveals significant price volatility, reflecting higher risk and speculative trading.
4. Regulatory & Legal
STMicroelectronics N.V.
- Compliance complexity across multiple regions requires vigilant regulatory management but benefits from scale and experience.
indie Semiconductor, Inc.
- Smaller scale and US-centric operations may amplify vulnerability to regulatory shifts in automotive and technology sectors.
5. Supply Chain & Operations
STMicroelectronics N.V.
- Diversified global supply chain offers resilience but faces potential disruption from geopolitical tensions.
indie Semiconductor, Inc.
- Limited operational scale and newer supply chain networks increase exposure to raw material shortages and delays.
6. ESG & Climate Transition
STMicroelectronics N.V.
- Larger company with established ESG initiatives but must continually adapt to evolving climate regulations.
indie Semiconductor, Inc.
- Emerging firm with growing ESG focus but risks lagging behind established competitors in sustainability practices.
7. Geopolitical Exposure
STMicroelectronics N.V.
- Significant presence in Europe and Asia subjects it to trade policy risks and regional tensions.
indie Semiconductor, Inc.
- Primarily US-based, facing risks from domestic policy shifts and global semiconductor supply chain constraints.
Which company shows a better risk-adjusted profile?
STMicroelectronics shows a superior risk-adjusted profile. Its strong balance sheet, lower volatility, and higher Altman Z-Score (3.92) place it safely above distress. indie Semiconductor, with negative profitability, high leverage, and a distress-zone Altman Z-Score (0.22), carries elevated financial and operational risks. The most impactful risk for STMicroelectronics is geopolitical exposure, which could disrupt its global supply chain. For indie Semiconductor, the critical risk is its fragile capital structure and poor financial health, threatening its survival amid market volatility.
Final Verdict: Which stock to choose?
STMicroelectronics (STM) showcases its superpower as a capital-efficient innovator with a very strong balance sheet and solid cash conversion. However, its declining profitability and shrinking returns on invested capital serve as a critical point of vigilance. STM fits portfolios aiming for selective exposure to semiconductor resilience with a cautionary eye on margin pressure.
indie Semiconductor (INDI) leverages a strategic moat in cutting-edge R&D intensity, signaling potential for future breakthroughs despite current financial distress. Its high current ratio and moderate debt profile offer some safety compared to STM’s cyclical challenges. INDI might appeal to high-risk investors targeting deep-value turnaround plays with a long-term horizon.
If you prioritize financial stability and proven operational strength, STM outshines as the more compelling choice due to its robust scores and safer credit profile. However, if you seek contrarian growth opportunities with a focus on innovation potential, INDI offers a scenario for higher volatility and speculative upside, but with significant execution risks.
Disclaimer: Investment carries a risk of loss of initial capital. The past performance is not a reliable indicator of future results. Be sure to understand risks before making an investment decision.
Go Further
I encourage you to read the complete analyses of STMicroelectronics N.V. and indie Semiconductor, Inc. to enhance your investment decisions: