Home > Comparison > Technology > STM vs CEVA
The strategic rivalry between STMicroelectronics N.V. and CEVA, Inc. shapes the semiconductor industry’s future. STMicroelectronics operates as a diversified manufacturer with broad product lines across automotive, industrial, and consumer markets. CEVA, in contrast, focuses on licensing cutting-edge wireless and AI processor technologies, targeting OEMs and semiconductor firms. This analysis pits a capital-intensive innovator against a high-margin IP licensor to determine which model offers superior risk-adjusted returns for a diversified portfolio.
Table of contents
Companies Overview
STMicroelectronics and CEVA stand as influential players shaping the global semiconductor sector.
STMicroelectronics N.V.: Global Semiconductor Manufacturer
STMicroelectronics dominates as a semiconductor manufacturer with diverse product lines, including automotive ICs, sensors, and microcontrollers. Its revenue stems from manufacturing and selling integrated circuits across automotive, industrial, and personal electronics markets. In 2026, the company emphasizes expanding its analog, MEMS, and sensor technologies to solidify its leadership in automotive and industrial sectors.
CEVA, Inc.: Wireless Connectivity IP Licensor
CEVA leads as a licensor of wireless connectivity and smart sensing technologies to chipmakers and OEMs. It generates revenue by licensing digital signal processors, AI platforms, and software for 5G, IoT, and AI applications. CEVA’s 2026 strategy focuses on advancing DSP-based platforms and AI processors to meet rising demand in mobile, IoT, and consumer electronics markets.
Strategic Collision: Similarities & Divergences
STMicroelectronics operates a manufacturing-centric model, while CEVA pursues an IP licensing approach. Their competition centers on enabling next-gen connectivity and sensing in automotive and IoT devices. STMicroelectronics offers tangible semiconductor products; CEVA delivers critical technology blueprints. This contrast creates distinct risk and growth profiles for investors seeking exposure in semiconductors.
Income Statement Comparison
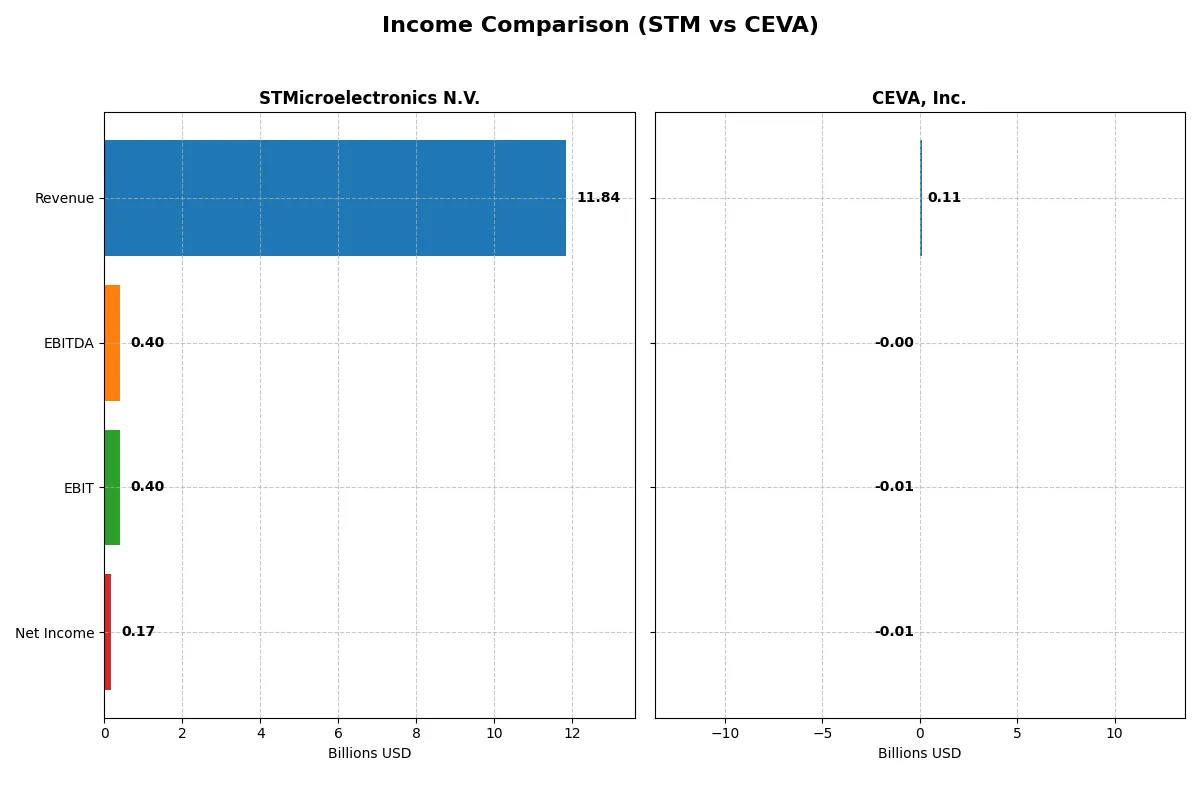
This data dissects the core profitability and scalability of both corporate engines to reveal who dominates the bottom line:
| Metric | STMicroelectronics N.V. (STM) | CEVA, Inc. (CEVA) |
|---|---|---|
| Revenue | 11.8B | 107M |
| Cost of Revenue | 7.8B | 13M |
| Operating Expenses | 3.7B | 102M |
| Gross Profit | 4.0B | 94M |
| EBITDA | 401M | -3.4M |
| EBIT | 401M | -7.5M |
| Interest Expense | 0 | 0 |
| Net Income | 167M | -8.8M |
| EPS | 0.19 | -0.37 |
| Fiscal Year | 2025 | 2024 |
Income Statement Analysis: The Bottom-Line Duel
This income statement comparison exposes each company’s operational efficiency and profitability under current market conditions.
STMicroelectronics N.V. Analysis
STM’s revenue fell from 17.3B in 2023 to 11.8B in 2025, dragging net income down sharply from 4.2B to 167M. Gross margin remains solid near 34%, but net margin plunged to 1.4%, reflecting squeezed profitability and weaker operational leverage in 2025. The downward trend signals mounting headwinds eroding STM’s earnings power.
CEVA, Inc. Analysis
CEVA grew revenue modestly to 107M in 2024, improving gross margin to 88%, which signifies excellent cost control on sales. However, the company posted a net loss of 8.8M, narrowing losses compared to prior years. Despite negative net margin near -8%, improving EBIT and EPS growth in the latest year suggest momentum toward operational stabilization.
Margin Strength vs. Scale Decline
STM dominates in scale but suffers from steep declines in net income and margin compression. CEVA operates at a much smaller scale but improves profitability metrics and narrows losses. For investors, STM’s profile reflects a cyclical semiconductor firm facing near-term challenges, while CEVA’s profile appeals to those monitoring a turnaround with margin resilience.
Financial Ratios Comparison
These vital ratios act as a diagnostic tool to expose the underlying fiscal health, valuation premiums, and capital efficiency of the companies compared below:
| Ratios | STMicroelectronics N.V. (STM) | CEVA, Inc. (CEVA) |
|---|---|---|
| ROE | 8.9% | -3.3% |
| ROIC | 6.3% | -2.7% |
| P/E | 14.4 | -84.8 |
| P/B | 1.29 | 2.79 |
| Current Ratio | 3.11 | 7.09 |
| Quick Ratio | 2.37 | 7.09 |
| D/E | 0.18 | 0.02 |
| Debt-to-Assets | 12.8% | 1.8% |
| Interest Coverage | 19.7 | 0 |
| Asset Turnover | 0.54 | 0.35 |
| Fixed Asset Turnover | 1.22 | 8.43 |
| Payout Ratio | 18.5% | 0% |
| Dividend Yield | 1.28% | 0% |
| Fiscal Year | 2024 | 2024 |
Efficiency & Valuation Duel: The Vital Signs
Financial ratios serve as the company’s DNA, uncovering hidden risks and operational strengths that raw numbers often conceal.
STMicroelectronics N.V.
STMicroelectronics displays weak profitability with a low ROE of 0.93% and slim net margins at 1.41%, signaling operational challenges. Its valuation appears reasonable with favorable P/E and P/B ratios, while a strong current ratio of 3.36 contrasts with a less efficient asset turnover of 0.48. The firm reinvests heavily in R&D (15.7% of revenue), prioritizing growth over dividends.
CEVA, Inc.
CEVA struggles with negative returns, including a -3.3% ROE and a net margin of -8.22%, reflecting persistent losses. Despite a high EV/Sales multiple of 6.85 suggesting a stretched valuation, it maintains a very strong liquidity position (current ratio 7.09) and low debt. The company eschews dividends, funneling resources into intensive R&D (67% of revenue) to fuel future growth.
Valuation Discipline vs. Growth Gambit
STMicroelectronics offers a more balanced risk-reward profile with moderate valuation and a stable capital structure, albeit with operational inefficiencies. CEVA’s high valuation and heavy losses heighten risk but underline a bold growth strategy via R&D. Investors seeking stability may prefer STMicroelectronics, while those favoring aggressive growth might consider CEVA’s profile.
Which one offers the Superior Shareholder Reward?
I observe that STMicroelectronics (STM) offers a modest dividend yield around 1.28% with a sustainable payout ratio near 18%. STM balances dividends with share buybacks, enhancing total shareholder return. CEVA, Inc. pays no dividends, focusing on reinvestment to fuel growth. Its high price-to-sales and volatile margins suggest riskier returns. STM’s disciplined capital allocation and steady cash flow underpin a more reliable shareholder reward in 2026. I conclude STM delivers the superior total return profile for investors seeking stable income and capital appreciation.
Comparative Score Analysis: The Strategic Profile
The radar chart reveals the fundamental DNA and trade-offs of STMicroelectronics and CEVA, highlighting their core financial strengths and weaknesses:
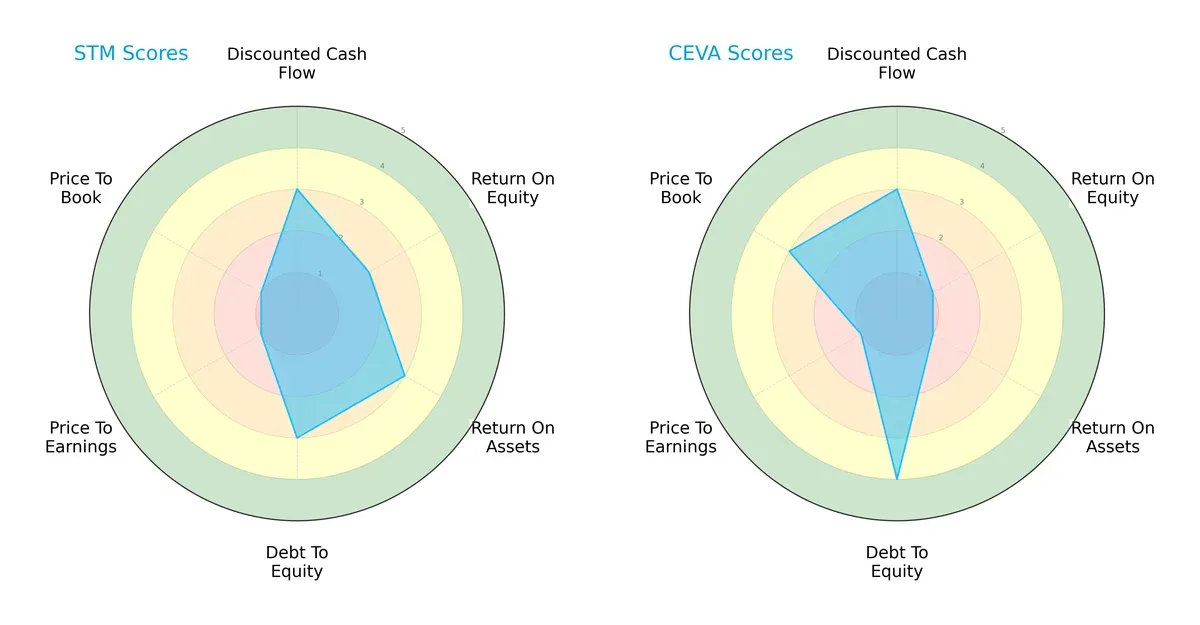
STMicroelectronics shows balanced strength with moderate scores in DCF (3), ROE (2), ROA (3), and Debt/Equity (3), but its valuation metrics (PE and PB) are very unfavorable (1 each). CEVA leans heavily on a strong Debt/Equity score (4) and better Price-to-Book valuation (3), yet suffers from weak profitability scores (ROE and ROA at 1). STMicroelectronics offers a more balanced profile, while CEVA relies on financial leverage and relative valuation advantages.
Bankruptcy Risk: Solvency Showdown
The Altman Z-Score gap favors CEVA, indicating stronger solvency and lower bankruptcy risk in this cycle:
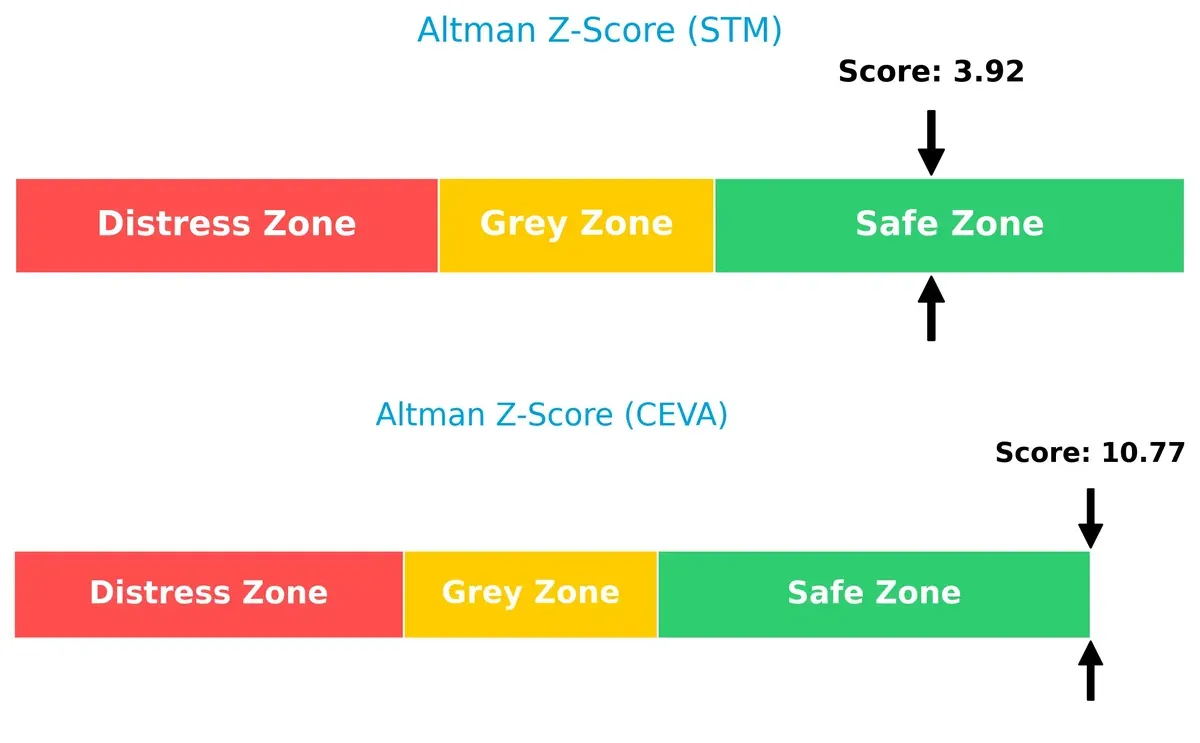
CEVA’s Z-Score of 10.77 places it deep in the safe zone, signaling robust financial stability. STMicroelectronics, with 3.92, also sits safely but closer to the grey zone threshold, suggesting moderate resilience but less cushion against shocks.
Financial Health: Quality of Operations
STMicroelectronics leads decisively in operational quality and financial health, reflected in its high Piotroski F-Score:
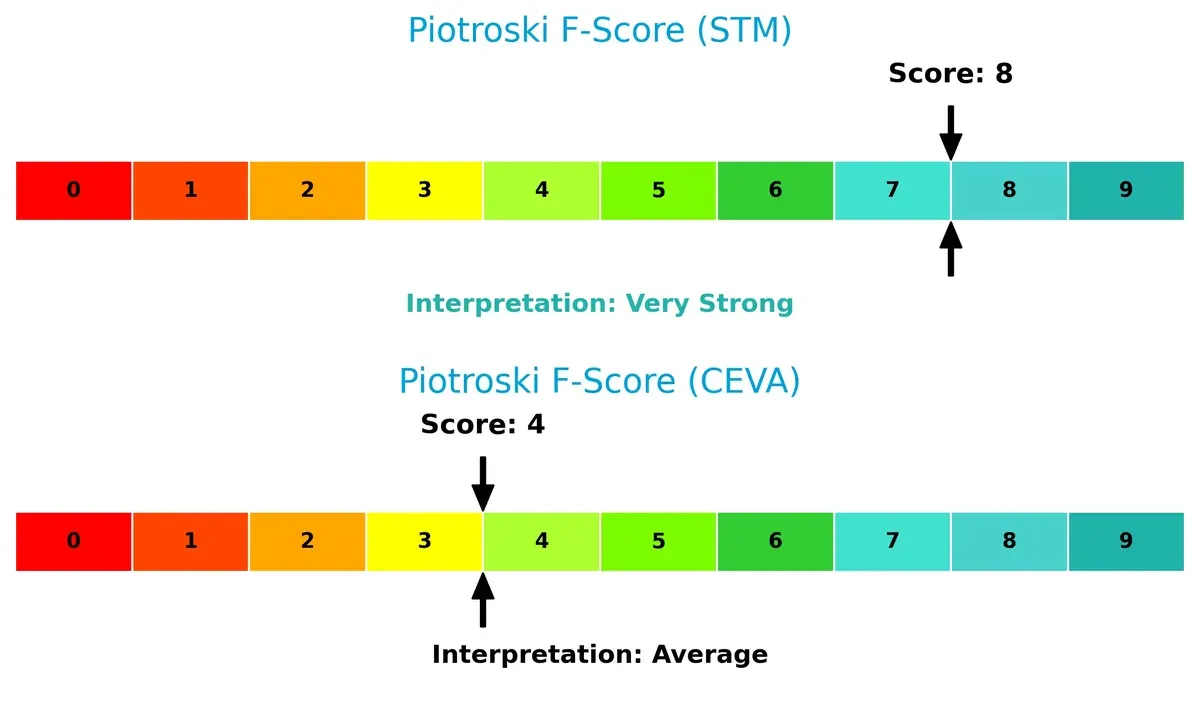
With a score of 8, STMicroelectronics demonstrates very strong fundamentals, indicating efficient profitability, liquidity, and low financial distress. CEVA’s score of 4 signals average health and potential red flags in internal metrics, highlighting operational weaknesses relative to its peer.
How are the two companies positioned?
This section dissects the operational DNA of STM and CEVA by comparing their revenue distribution and internal dynamics. The final objective confronts their economic moats to identify which model offers the most resilient competitive advantage today.
Revenue Segmentation: The Strategic Mix
This visual comparison dissects how STMicroelectronics and CEVA diversify their income streams and where their primary sector bets lie:
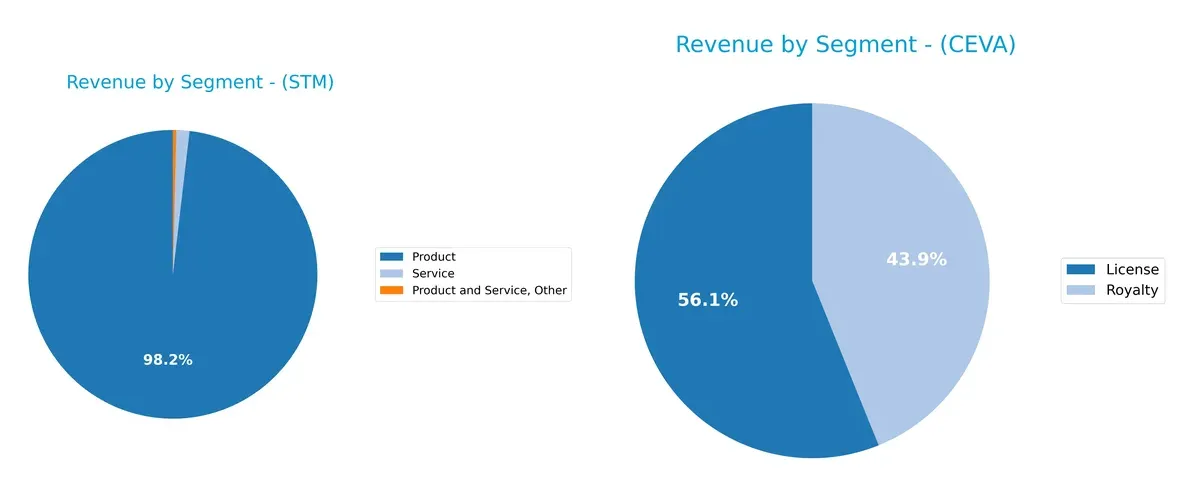
STMicroelectronics anchors its revenue heavily in Products with $13.2B in 2024, complemented by minimal Service and Other segments totaling $76M. CEVA splits income more evenly between License ($60M) and Royalty ($47M) streams. STM’s concentration in physical products risks cyclical sector downturns but leverages infrastructure dominance. CEVA’s balanced License and Royalty mix provides resilience and ecosystem lock-in, reducing single-segment dependency.
Strengths and Weaknesses Comparison
This table compares the strengths and weaknesses of STMicroelectronics N.V. (STM) and CEVA, Inc. (CEVA):
STM Strengths
- Diverse product segments with significant revenues across products and services
- Strong global presence in Asia Pacific, US, and Europe
- Favorable debt-to-equity and interest coverage ratios
- Quick ratio indicates good short-term liquidity
CEVA Strengths
- Favorable quick ratio and low debt-to-equity ratio suggest strong liquidity and low leverage
- High fixed asset turnover indicates efficient use of fixed assets
- Presence in Asia Pacific, China, and US markets
- Favorable price-to-earnings ratio
STM Weaknesses
- Low profitability ratios including net margin, ROE, and ROIC
- Unfavorable current ratio and asset turnover suggest operational inefficiencies
- No dividend yield, limiting income investors
- Neutral WACC but overall mixed financial health
CEVA Weaknesses
- Negative profitability metrics with net margin, ROE, and ROIC all unfavorable
- Unfavorable WACC and interest coverage ratio raise financial risk concerns
- Unfavorable current ratio despite high quick ratio
- No dividend yield and unfavorable global ratio opinion
STM’s strengths lie in its broad diversification and solid global footprint supported by sound liquidity and low leverage. CEVA benefits from efficient asset usage and liquidity but struggles with sustained profitability and cost of capital. Both companies face challenges in generating returns, impacting their strategic financial positioning.
The Moat Duel: Analyzing Competitive Defensibility
A structural moat is the only true shield protecting long-term profits from relentless competitive pressure and market erosion:
STMicroelectronics N.V.: Diversified Industrial Moat
STM’s competitive advantage stems from diversified product portfolios across automotive and industrial segments. I see margin stability but shrinking ROIC signals value erosion. New markets in power GaN tech could deepen the moat if execution improves.
CEVA, Inc.: Intellectual Property Licensing Moat
CEVA leverages proprietary DSP and AI IP licensing, contrasting STM’s integrated manufacturing. Its high gross margin shows pricing power, yet negative net margins reveal scaling challenges. AI and 5G expansions offer growth but also risk disruption.
Integrated Manufacturing vs. IP Licensing: The Moat Face-Off
Both firms show declining ROIC, signaling weakening moats, but STM’s broader industrial base offers a slightly wider moat. However, CEVA’s niche IP could defend market share if it scales profitably.
Which stock offers better returns?
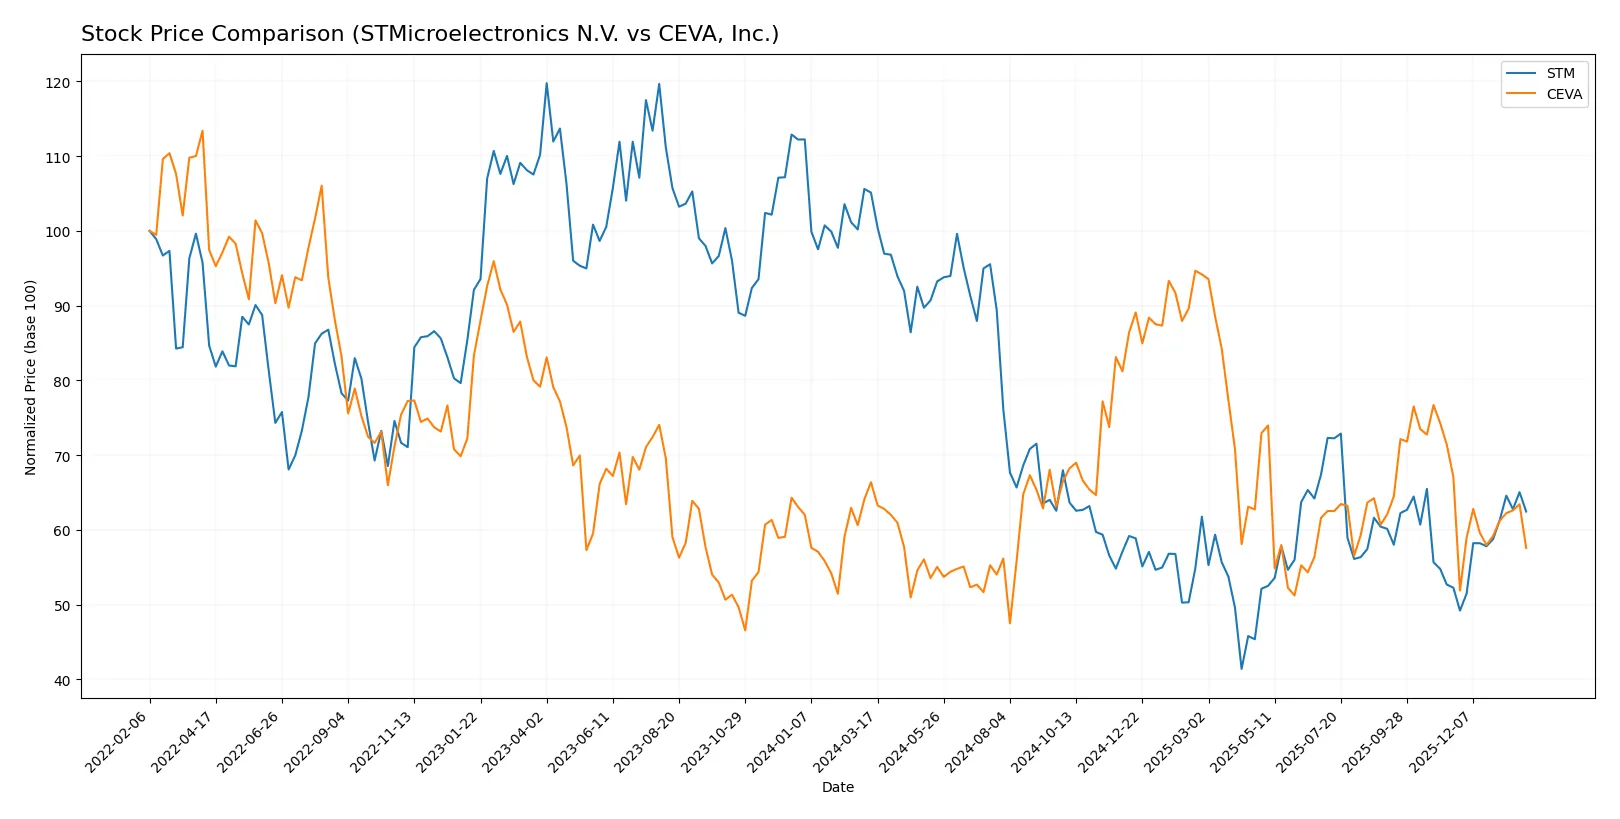
Over the past 12 months, both stocks experienced bearish trends with accelerating declines, though STMicroelectronics saw a sharper drop and recent recovery unlike CEVA’s continued downturn.
Trend Comparison
STMicroelectronics N.V. (STM) declined 40.6% over the past year with accelerating bearish momentum, hitting lows near 18.5 before a recent 19.5% rebound since November 2025. Volatility remains high with a 6.77 std deviation.
CEVA, Inc. (CEVA) posted a 13.25% decline over the same period, also accelerating downward. Recent months showed a further 14.2% drop with diminished volatility at 1.33 std deviation, signaling persistent weakness.
STM’s performance shows greater volatility but a stronger recent recovery compared to CEVA’s steady decline. STM delivered the sharper market move and highest price rebound in this timeframe.
Target Prices
Analysts present a bullish consensus for both STMicroelectronics N.V. and CEVA, Inc., signaling potential upside from current levels.
| Company | Target Low | Target High | Consensus |
|---|---|---|---|
| STMicroelectronics N.V. | 28 | 45 | 37.67 |
| CEVA, Inc. | 28 | 28 | 28 |
STMicroelectronics’ consensus target of $37.67 exceeds its current $27.89 price, suggesting room for appreciation. CEVA’s single target at $28 also implies upside from its $21.09 share price.

Don’t Let Luck Decide Your Entry Point
Optimize your entry points with our advanced ProRealTime indicators. You’ll get efficient buy signals with precise price targets for maximum performance. Start outperforming now!
How do institutions grade them?
Here is a summary of recent institutional grades for STMicroelectronics N.V. and CEVA, Inc.:
STMicroelectronics N.V. Grades
The table below shows recent grades and actions from notable grading companies for STMicroelectronics:
| Grading Company | Action | New Grade | Date |
|---|---|---|---|
| TD Cowen | Maintain | Buy | 2025-10-24 |
| Susquehanna | Maintain | Positive | 2025-10-22 |
| Susquehanna | Maintain | Positive | 2025-07-25 |
| Baird | Upgrade | Outperform | 2025-07-22 |
| Susquehanna | Maintain | Positive | 2025-07-22 |
| Jefferies | Upgrade | Buy | 2025-02-19 |
| Bernstein | Downgrade | Market Perform | 2025-02-05 |
| Susquehanna | Maintain | Positive | 2025-01-31 |
| Barclays | Downgrade | Underweight | 2025-01-22 |
| JP Morgan | Downgrade | Neutral | 2024-12-09 |
CEVA, Inc. Grades
Below are recent grades and actions from major grading firms for CEVA, Inc.:
| Grading Company | Action | New Grade | Date |
|---|---|---|---|
| Barclays | Maintain | Overweight | 2025-11-12 |
| Rosenblatt | Maintain | Buy | 2025-11-11 |
| Rosenblatt | Maintain | Buy | 2025-08-14 |
| Oppenheimer | Maintain | Outperform | 2025-05-09 |
| Rosenblatt | Maintain | Buy | 2025-05-08 |
| Barclays | Maintain | Overweight | 2025-05-08 |
| Rosenblatt | Maintain | Buy | 2025-04-23 |
| Barclays | Maintain | Overweight | 2025-02-14 |
| Rosenblatt | Maintain | Buy | 2025-02-14 |
| Rosenblatt | Maintain | Buy | 2025-02-11 |
Which company has the best grades?
CEVA consistently receives positive ratings, mainly “Buy” and “Overweight,” maintained across multiple firms. STMicroelectronics shows mixed grades with recent downgrades, suggesting more cautious sentiment. This difference could influence investor perception of stability and growth potential.
Risks specific to each company
In the 2026 market environment, the following categories identify critical pressure points and systemic threats facing both STMicroelectronics N.V. and CEVA, Inc.:
1. Market & Competition
STMicroelectronics N.V.
- Faces intense competition in semiconductors with cyclical demand and pressure on net margins.
CEVA, Inc.
- Operates in niche IP licensing but suffers from negative profitability and margin pressure.
2. Capital Structure & Debt
STMicroelectronics N.V.
- Maintains low debt (D/E 0.12) with strong interest coverage, indicating financial stability.
CEVA, Inc.
- Extremely low debt (D/E 0.02) but zero interest coverage signals potential liquidity risk.
3. Stock Volatility
STMicroelectronics N.V.
- Beta of 1.29 suggests moderate volatility relative to the market.
CEVA, Inc.
- Higher beta at 1.44 indicates greater stock price swings and risk.
4. Regulatory & Legal
STMicroelectronics N.V.
- Global footprint exposes it to varied regulatory regimes, especially in automotive.
CEVA, Inc.
- Licensing business model faces IP protection and compliance risks across jurisdictions.
5. Supply Chain & Operations
STMicroelectronics N.V.
- Complex manufacturing supply chain exposed to semiconductor shortages and geopolitical tensions.
CEVA, Inc.
- Relies on partners for manufacturing; operational disruption risk is lower but dependent on licensees.
6. ESG & Climate Transition
STMicroelectronics N.V.
- Large industrial footprint must address energy and emissions targets in Europe and globally.
CEVA, Inc.
- Smaller footprint but pressured to align IP licensing with sustainable tech trends.
7. Geopolitical Exposure
STMicroelectronics N.V.
- Exposure to Europe, Asia, and Americas heightens risk from trade conflicts and sanctions.
CEVA, Inc.
- US-based, but global licensing subjects it to international trade and tech export controls.
Which company shows a better risk-adjusted profile?
STMicroelectronics’ largest risk is cyclical market competition undermining weak profitability. CEVA’s top risk lies in persistent negative returns and weak liquidity. Despite CEVA’s higher stock volatility and liquidity concerns, both firms hold a “safe zone” Altman Z-score. However, STM’s stronger Piotroski score and debt management give it a superior risk-adjusted profile. Notably, STM’s stable interest coverage contrasts with CEVA’s zero coverage, underscoring CEVA’s financial fragility.
Final Verdict: Which stock to choose?
STMicroelectronics N.V. (STM) shines with its robust asset base and strong liquidity, demonstrating resilience in turbulent cycles. Its superpower lies in solid balance sheet strength and operational cash flow management. The point of vigilance is its declining profitability trend, which could pressure returns. STM suits investors targeting steady capital preservation with selective growth exposure.
CEVA, Inc. offers a strategic moat through high gross margins and an intense R&D focus, aiming to carve niche innovation leadership. It carries higher operational risk with ongoing losses but benefits from a lean capital structure and superior liquidity compared to STM. CEVA fits well with investors seeking turnaround potential and growth at a reasonable price.
If you prioritize financial stability and a safer asset foundation, STM is the compelling choice due to its strong liquidity and capital structure despite profitability headwinds. However, if you seek speculative growth fueled by innovation and can tolerate volatility, CEVA offers better upside potential but demands a higher risk appetite. Both present analytical scenarios for distinct investor profiles.
Disclaimer: Investment carries a risk of loss of initial capital. The past performance is not a reliable indicator of future results. Be sure to understand risks before making an investment decision.
Go Further
I encourage you to read the complete analyses of STMicroelectronics N.V. and CEVA, Inc. to enhance your investment decisions: