Home > Comparison > Healthcare > SYK vs STE
The strategic rivalry between Stryker Corporation and STERIS plc defines the current trajectory of the medical devices sector. Stryker operates as a diversified medical technology leader with strong orthopaedics and neurotechnology segments. In contrast, STERIS focuses on infection prevention and procedural products with a service-heavy model. This analysis examines their contrasting operational approaches to identify which offers superior risk-adjusted returns for a diversified healthcare portfolio.
Table of contents
Companies Overview
Stryker Corporation and STERIS plc stand as key players in the global medical devices market, shaping healthcare delivery.
Stryker Corporation: Premier Orthopaedics and Surgical Technology Provider
Stryker dominates the orthopaedics and surgical equipment markets through implants and advanced surgical systems. Its revenue flows from two segments: Orthopaedics and Spine, and MedSurg and Neurotechnology. In 2026, Stryker focuses strategically on innovation in spinal and minimally invasive technologies, reinforcing its competitive edge in implant and navigation systems worldwide.
STERIS plc: Infection Prevention and Sterilization Specialist
STERIS leads in infection prevention products and procedural services with diversified offerings across healthcare, sterilization, life sciences, and dental segments. Its revenue base includes sterilizers, cleaning chemistries, and service contracts. The company’s 2026 strategy emphasizes expanding contract sterilization services and integrated equipment maintenance to enhance sterile processing efficiency globally.
Strategic Collision: Similarities & Divergences
Both companies operate within medical devices but pursue distinct philosophies: Stryker invests in proprietary implants and surgical innovation, while STERIS builds on service-driven sterilization and maintenance solutions. Their competitive battleground lies in hospital procedure support, where implants meet infection control. These contrasting models create unique investment profiles: one rooted in product innovation, the other in procedural service integration.
Income Statement Comparison
This data dissects the core profitability and scalability of both corporate engines to reveal who dominates the bottom line:
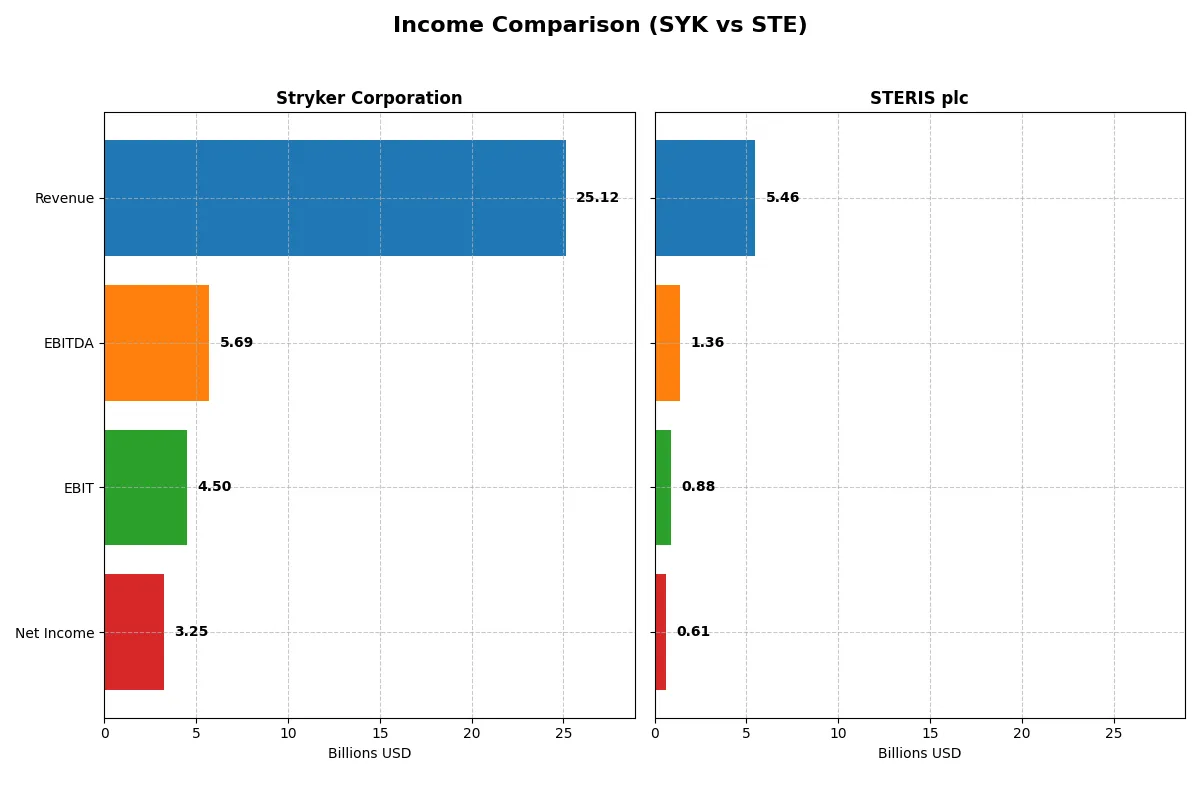
| Metric | Stryker Corporation (SYK) | STERIS plc (STE) |
|---|---|---|
| Revenue | 25.1B | 5.46B |
| Cost of Revenue | 9.68B | 3.06B |
| Operating Expenses | 9.81B | 1.54B |
| Gross Profit | 15.4B | 2.40B |
| EBITDA | 5.69B | 1.36B |
| EBIT | 4.50B | 882M |
| Interest Expense | 0 | 86M |
| Net Income | 3.25B | 615M |
| EPS | 8.49 | 6.24 |
| Fiscal Year | 2025 | 2025 |
Income Statement Analysis: The Bottom-Line Duel
The income statement comparison reveals which company runs a more efficient and profitable corporate engine in 2025.
Stryker Corporation Analysis
Stryker’s revenue climbed steadily from $17.1B in 2021 to $25.1B in 2025, with net income increasing 63% over five years to $3.25B. Its gross margin remains robust at 61.4%, while the net margin holds a healthy 12.9%. The 2025 figures show strong momentum with 11% revenue growth and a solid 15.7% EBIT advance, underscoring operational efficiency.
STERIS plc Analysis
STERIS grew revenue from $3.1B in 2021 to $5.5B in 2025, a 75.7% increase, with net income rising 55% to $615M. Gross margin stands lower at 44.0%, though net margin is respectable at 11.3%. One-year revenue growth slowed to 6.2%, and EBIT grew modestly by 4.2%. However, a sharp 53% net margin expansion in 2025 signals improving profitability.
Margin Strength vs. Growth Scale
Stryker delivers superior margins and larger absolute profits, reflecting a more efficient business model with consistent margin expansion. STERIS exhibits faster top-line growth but with thinner margins and lower net income. For investors prioritizing profitability and margin resilience, Stryker’s profile is more compelling, while STERIS appeals more to those focused on high growth potential.
Financial Ratios Comparison
These vital ratios act as a diagnostic tool to expose the underlying fiscal health, valuation premiums, and capital efficiency of the companies analyzed:
| Ratios | Stryker Corporation (SYK) | STERIS plc (STE) |
|---|---|---|
| ROE | 14.5% | 9.3% |
| ROIC | 7.4% | 7.2% |
| P/E | 41.4 | 36.3 |
| P/B | 6.0 | 3.4 |
| Current Ratio | 1.89 | 1.96 |
| Quick Ratio | 1.21 | 1.39 |
| D/E (Debt-to-Equity) | 0.66 | 0.33 |
| Debt-to-Assets | 31.1% | 21.7% |
| Interest Coverage | 0 | 10.0 |
| Asset Turnover | 0.52 | 0.54 |
| Fixed Asset Turnover | 6.48 | 2.58 |
| Payout ratio | 39.6% | 35.8% |
| Dividend yield | 0.96% | 0.98% |
| Fiscal Year | 2025 | 2025 |
Efficiency & Valuation Duel: The Vital Signs
Financial ratios serve as a company’s DNA, exposing hidden risks and operational strengths through key profitability and valuation metrics.
Stryker Corporation
Stryker posts a solid 14.48% ROE with a favorable 12.92% net margin, reflecting efficient core profitability. Yet, its P/E of 41.38 signals an expensive valuation, stretched above industry norms. The company returns value with a modest 0.96% dividend yield, indicating a cautious shareholder return strategy amid reinvestment in R&D and growth.
STERIS plc
STERIS shows a lower 9.31% ROE but maintains a healthy 11.26% net margin, suggesting operational efficiency despite weaker profitability. Its P/E multiple at 36.35 remains elevated, though less stretched than Stryker’s. STERIS balances shareholder returns with a near 1% dividend yield, while managing debt conservatively, reflecting prudent capital allocation.
Valuation Stretch vs. Operational Efficiency
Both companies exhibit slightly favorable ratio profiles, but Stryker’s higher profitability contrasts with its more stretched valuation. STERIS offers a more conservative balance of risk with moderate returns. Investors prioritizing growth may lean toward Stryker, while those favoring operational safety might prefer STERIS.
Which one offers the Superior Shareholder Reward?
I compare Stryker Corporation (SYK) and STERIS plc (STE) on dividend yield, payout ratio, and buybacks. SYK yields 0.96% with a 39.6% payout, supported by a strong free cash flow (11.2/share) covering dividends 2.5x. STE yields 0.98% with a 35.8% payout, backed by free cash flow of 7.9/share. Both deploy capital for buybacks, but SYK’s higher free cash flow per share and coverage ratio suggest a more sustainable distribution. STE’s higher leverage and lower free cash flow cushion raise risk. I see SYK offering superior total return potential in 2026 through balanced dividends and buybacks.
Comparative Score Analysis: The Strategic Profile
The radar chart reveals the fundamental DNA and trade-offs of Stryker Corporation and STERIS plc, highlighting their financial strengths and valuation nuances:
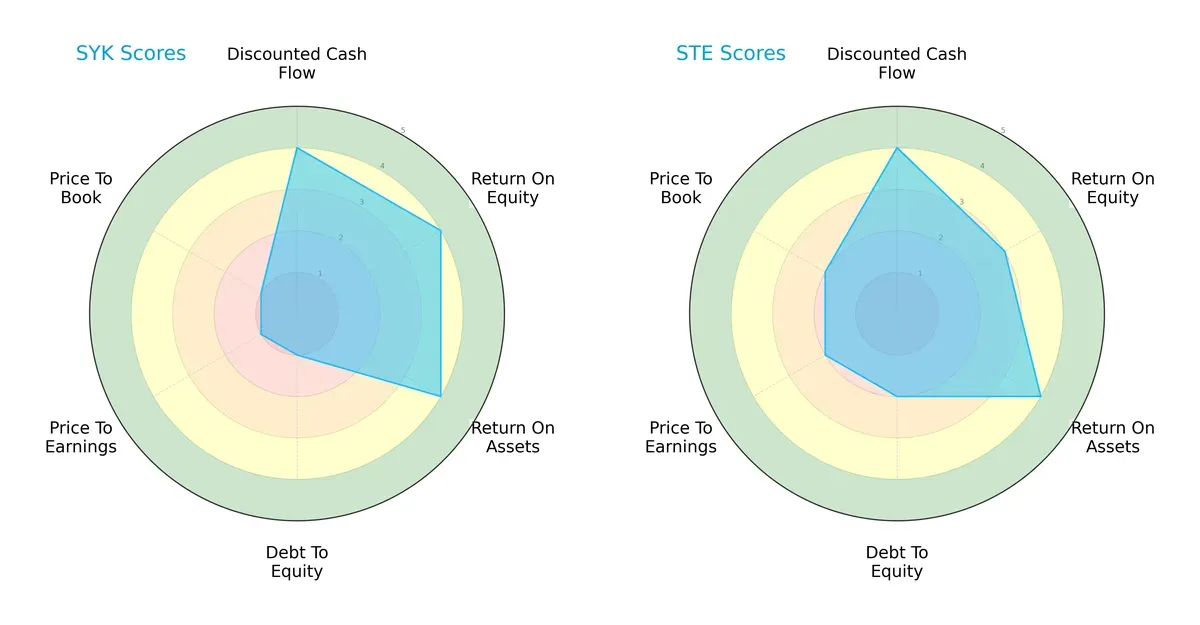
Stryker (SYK) excels in profitability metrics with top scores in ROE and ROA, but its balance sheet shows elevated risk via a very unfavorable debt-to-equity score. STERIS (STE) presents a more balanced profile, maintaining solid cash flow and asset returns while managing leverage and valuation more conservatively. SYK relies heavily on operational efficiency, whereas STE offers steadier financial stability.
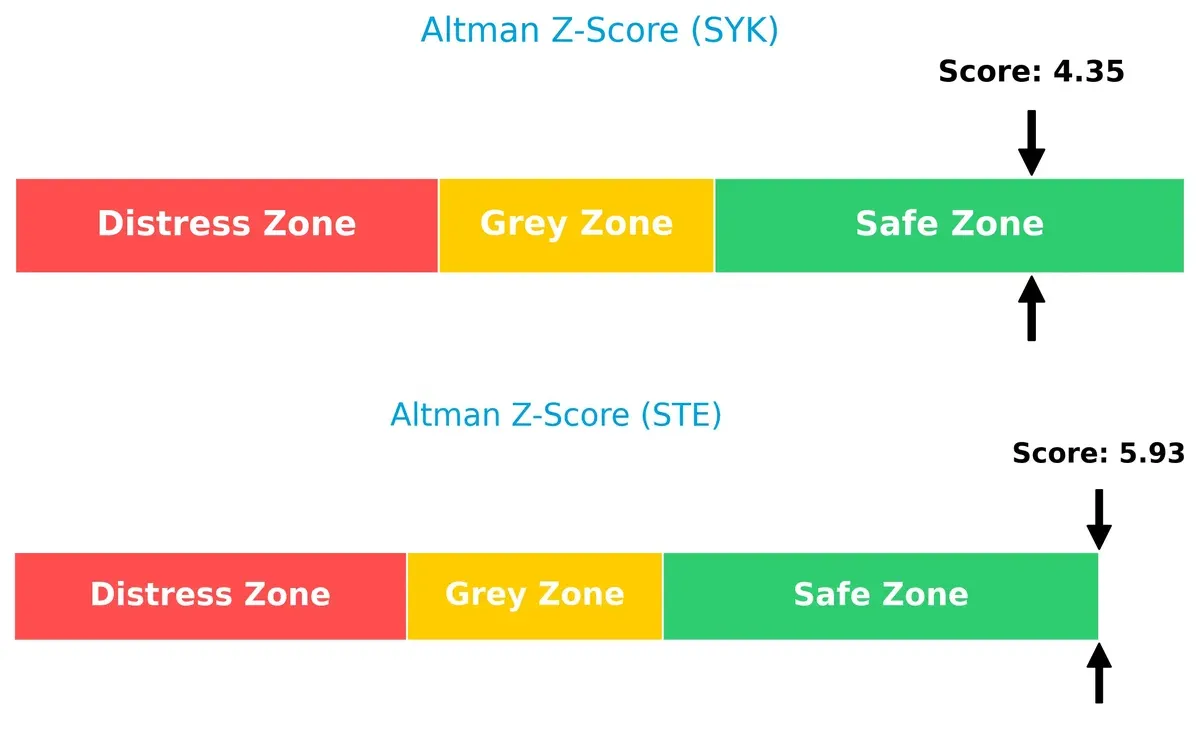
Bankruptcy Risk: Solvency Showdown
The Altman Z-Score gap places both firms safely above distress levels, yet STERIS’s higher 5.9 score signals stronger resilience than Stryker’s 4.3 in this late-cycle environment:
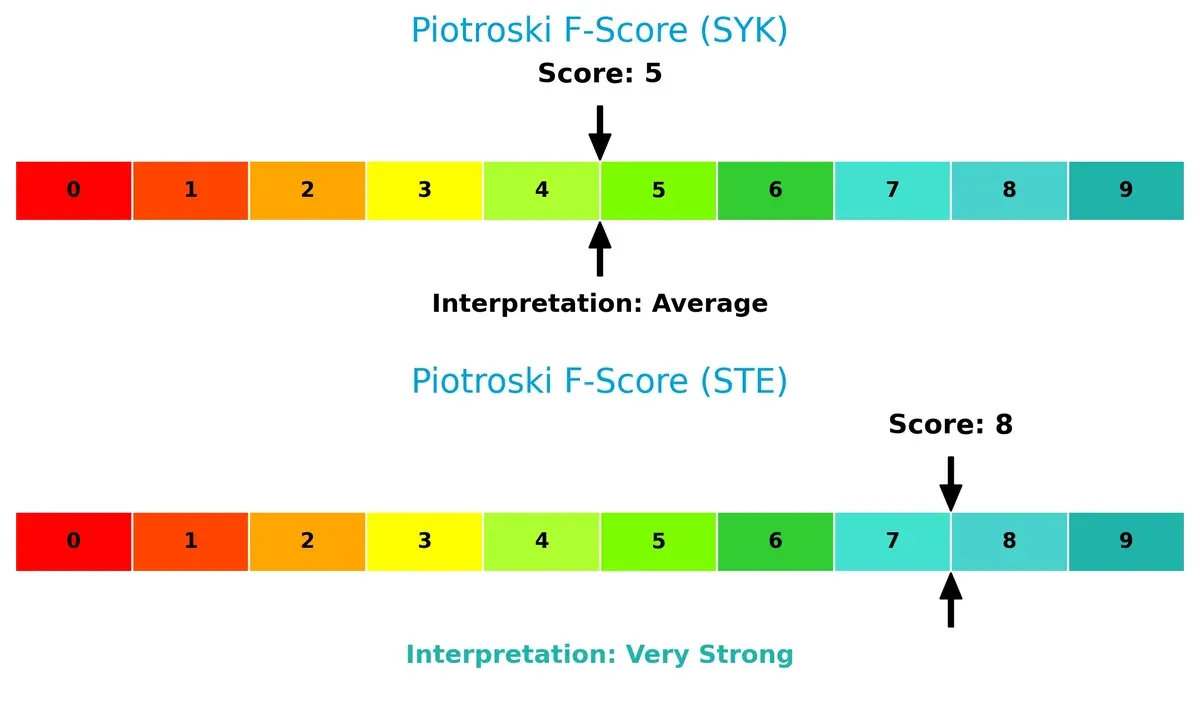
Financial Health: Quality of Operations
STERIS outperforms with a Piotroski F-Score of 8, demonstrating robust internal financial metrics. Stryker’s average score of 5 flags potential operational weaknesses relative to its peer:
How are the two companies positioned?
This section dissects SYK and STE’s operational DNA by comparing revenue distribution and internal dynamics. The objective is to confront their economic moats and identify which model delivers the most resilient, sustainable advantage today.
Revenue Segmentation: The Strategic Mix
This comparison dissects how Stryker Corporation and STERIS plc diversify their income streams and reveals where their primary sector bets lie:
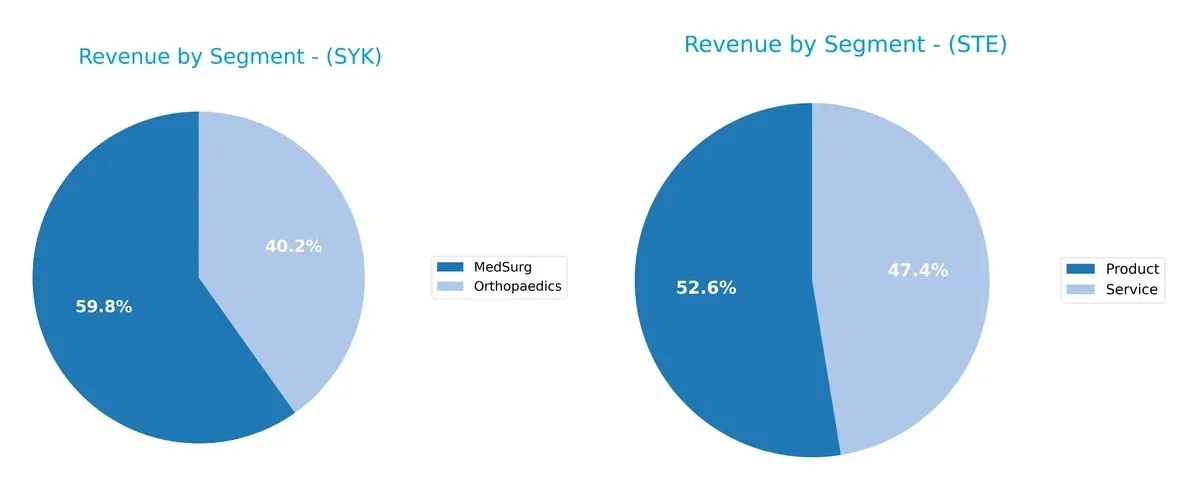
Stryker leans heavily on two large segments: MedSurg at $13.5B and Orthopaedics at $9.1B, showing moderate diversification. STERIS balances revenues more evenly between Product ($2.9B) and Service ($2.6B), reflecting a strategic pivot towards integrated solutions. Stryker’s concentration anchors on medical device innovation, risking sector cyclicality. STERIS’s dual focus fosters ecosystem lock-in, reducing vulnerability to product-only market swings.
Strengths and Weaknesses Comparison
This table compares the Strengths and Weaknesses of Stryker Corporation and STERIS plc:
Stryker Corporation Strengths
- Diversified revenue across MedSurg and Orthopaedics segments
- Strong net margin at 12.92%
- Favorable current and quick ratios indicate liquidity
- High fixed asset turnover at 6.48 signals efficient use of assets
- Global presence with substantial US, EMEA, and Asia Pacific sales
STERIS plc Strengths
- Balanced revenue between Product and Service segments
- Favorable net margin at 11.26%
- Strong liquidity with current ratio of 1.96 and quick ratio of 1.39
- Low debt to equity at 0.33 and debt to assets at 21.71%
- Good interest coverage at 10.23 supports debt service capacity
Stryker Corporation Weaknesses
- High P/E ratio at 41.38 suggests overvaluation risk
- Elevated price-to-book of 5.99
- ROE and ROIC near WACC imply limited capital return advantage
- Dividend yield below 1% may deter income investors
- Moderate debt levels with D/E at 0.66
STERIS plc Weaknesses
- Lower ROE at 9.31 reflects weaker profitability
- P/E of 36.35 still high, limiting margin of safety
- Price-to-book at 3.38 remains elevated
- Dividend yield under 1% limits income appeal
- Fixed asset turnover at 2.58 indicates less asset efficiency
Both companies show slightly favorable financial profiles with solid liquidity and net margins. Stryker’s strengths lie in asset efficiency and broader diversification, while STERIS exhibits conservative leverage and balanced product-service revenue. Their weaknesses center on valuation levels and moderate returns on equity, signaling cautious capital allocation challenges ahead.
The Moat Duel: Analyzing Competitive Defensibility
A structural moat is the only reliable shield protecting long-term profits from relentless competitive erosion. Let’s dissect the moats of two medical device leaders:
Stryker Corporation: Intangible Assets and Innovation Moat
Stryker’s competitive edge stems from high-value intangible assets like patented implants and advanced surgical systems. This moat shows in its strong gross margin of 61% and stable EBIT margins near 18%. However, its declining ROIC trend signals risk to profitability unless innovation accelerates in new neurotechnology markets by 2026.
STERIS plc: Service and Operational Efficiency Moat
STERIS leans on operational efficiency and service integration, offering sterilization and equipment maintenance. Its moat contrasts with Stryker’s by focusing on recurring service revenues and contract sterilization. Though ROIC remains below WACC, a modest upward trend and favorable net margin growth suggest strengthening profitability and potential expansion in life sciences services.
Innovation Intangibles vs. Service Efficiency: Who Defends Better?
Stryker’s intangible asset moat is wider, reflected in superior margins and scale. Yet, its declining ROIC raises red flags. STERIS’s narrower moat is deepening through operational gains and service diversification. Overall, STERIS appears better positioned to defend and grow market share amid evolving healthcare demands.
Which stock offers better returns?
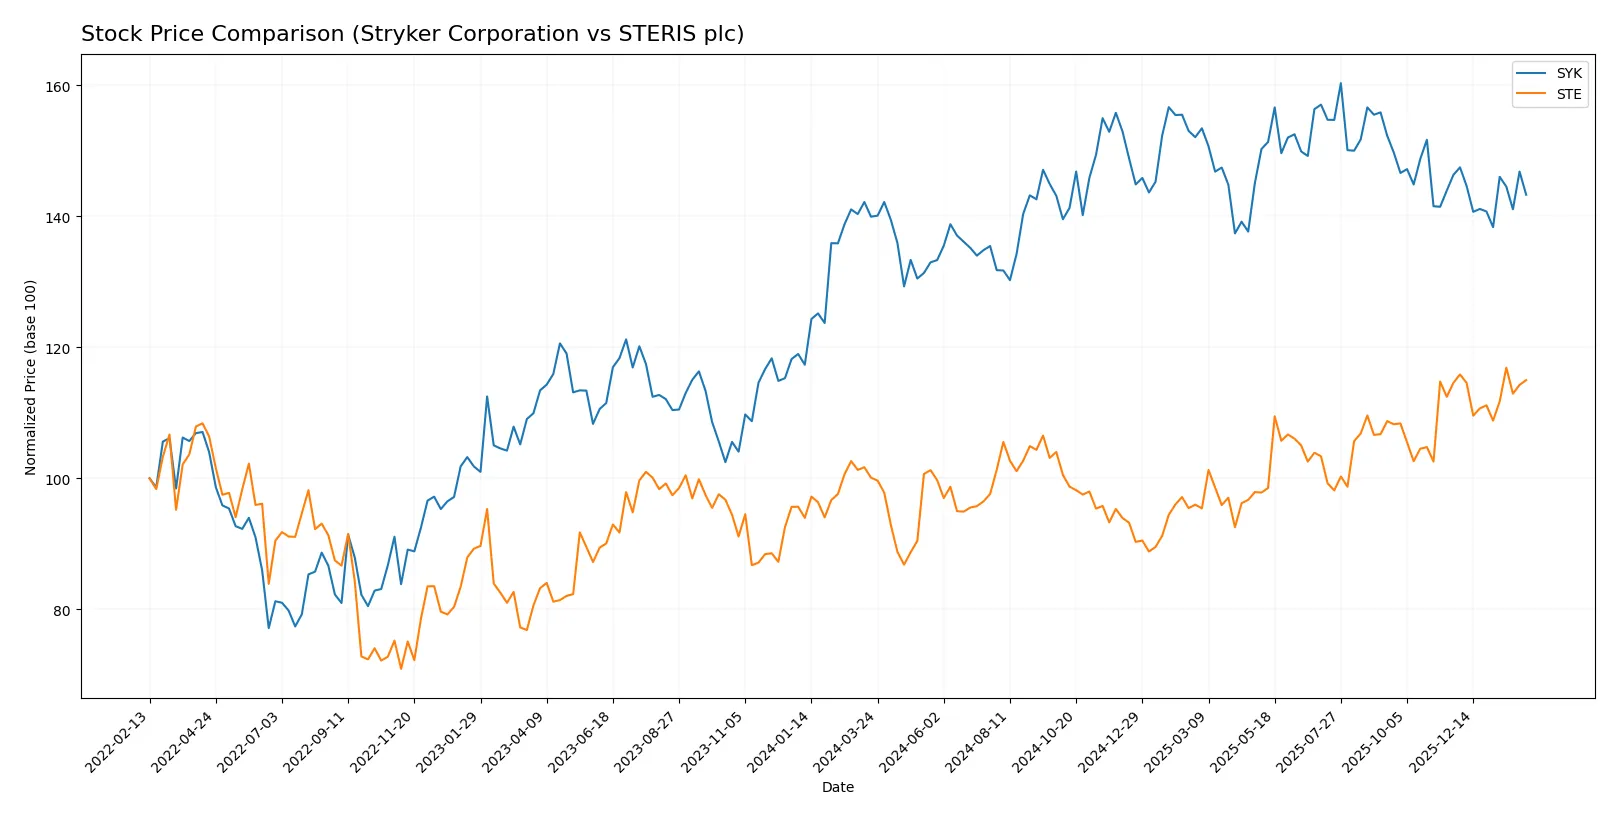
The past year shows key price shifts for both stocks, with STERIS plc exhibiting a stronger bullish advance while Stryker Corporation’s gains slow down near recent lows.
Trend Comparison
Stryker Corporation’s stock rose 2.39% over the past 12 months, signaling a bullish trend with decelerating momentum despite a recent slight pullback of -2.07%.
STERIS plc gained 14.88% over the same period, maintaining a bullish trend with deceleration but showing a mild recent uptrend of 0.37%.
Overall, STERIS plc delivered the highest market performance, outperforming Stryker by a wide margin in the last year.
Target Prices
Analysts present a bullish consensus for both Stryker Corporation and STERIS plc, indicating potential upside from current prices.
| Company | Target Low | Target High | Consensus |
|---|---|---|---|
| Stryker Corporation | 390 | 469 | 425.58 |
| STERIS plc | 245 | 265 | 256.67 |
Stryker’s target consensus at 425.58 implies a roughly 18% upside versus today’s 360.66. STERIS shows modest upside potential with consensus targets slightly above the current 264.27 price.

Don’t Let Luck Decide Your Entry Point
Optimize your entry points with our advanced ProRealTime indicators. You’ll get efficient buy signals with precise price targets for maximum performance. Start outperforming now!
How do institutions grade them?
The following tables summarize recent institutional grades for Stryker Corporation and STERIS plc:
Stryker Corporation Grades
This table details the latest grades from reputable financial analysts for Stryker Corporation.
| Grading Company | Action | New Grade | Date |
|---|---|---|---|
| BTIG | Maintain | Buy | 2026-01-30 |
| Needham | Maintain | Buy | 2026-01-30 |
| Bernstein | Maintain | Outperform | 2026-01-09 |
| Citizens | Upgrade | Market Outperform | 2025-12-19 |
| Truist Securities | Maintain | Hold | 2025-12-18 |
| Citigroup | Maintain | Buy | 2025-12-11 |
| Needham | Maintain | Buy | 2025-11-14 |
| Truist Securities | Maintain | Hold | 2025-11-14 |
| Wells Fargo | Maintain | Overweight | 2025-11-14 |
| BTIG | Maintain | Buy | 2025-11-14 |
STERIS plc Grades
This table shows recent institutional grades for STERIS plc from established grading companies.
| Grading Company | Action | New Grade | Date |
|---|---|---|---|
| Morgan Stanley | Maintain | Overweight | 2025-08-08 |
| Keybanc | Maintain | Overweight | 2025-07-22 |
| Morgan Stanley | Upgrade | Overweight | 2025-07-15 |
| Morgan Stanley | Maintain | Equal Weight | 2025-05-19 |
| JMP Securities | Maintain | Market Outperform | 2025-05-16 |
| Stephens & Co. | Maintain | Overweight | 2025-05-15 |
| Morgan Stanley | Maintain | Equal Weight | 2025-05-12 |
| JMP Securities | Maintain | Market Outperform | 2025-04-10 |
| Needham | Maintain | Hold | 2025-04-07 |
| JMP Securities | Maintain | Market Outperform | 2025-02-06 |
Which company has the best grades?
Stryker Corporation consistently receives strong buy and outperform ratings, while STERIS plc holds overweight and market outperform grades but also some equal weight and hold ratings. Stryker’s higher frequency of buy and outperform grades suggests stronger institutional confidence, potentially attracting more investor interest.
Risks specific to each company
In the 2026 market environment, these categories highlight the critical pressure points and systemic threats facing both Stryker Corporation and STERIS plc:
1. Market & Competition
Stryker Corporation
- Strong MedTech presence with broad product portfolio but faces premium valuation pressure.
STERIS plc
- Diversified infection prevention niche with moderate valuation but smaller scale challenges.
2. Capital Structure & Debt
Stryker Corporation
- Moderate leverage (D/E 0.66), but weak debt-to-equity rating signals potential financial risk.
STERIS plc
- Lower leverage (D/E 0.33) supports financial stability with favorable debt metrics.
3. Stock Volatility
Stryker Corporation
- Beta 0.87 indicates below-market volatility, offering relative price stability.
STERIS plc
- Beta 1.04 suggests volatility in line with broader market fluctuations.
4. Regulatory & Legal
Stryker Corporation
- Operates globally with exposure to complex regulatory regimes, especially in surgical implants.
STERIS plc
- Faces stringent sterilization and healthcare compliance risks across multiple segments.
5. Supply Chain & Operations
Stryker Corporation
- Large scale with diversified production reduces risk; complexity remains in high-tech implants.
STERIS plc
- Concentrated sterilization services and consumables may face supply disruptions.
6. ESG & Climate Transition
Stryker Corporation
- Increasing focus on sustainable innovation but ESG disclosure remains moderate.
STERIS plc
- Stronger emphasis on environmental controls due to sterilization chemicals and processes.
7. Geopolitical Exposure
Stryker Corporation
- US-based with global sales in 75 countries, vulnerable to trade tensions and currency swings.
STERIS plc
- Ireland-based with significant international operations; Brexit and EU regulations add complexity.
Which company shows a better risk-adjusted profile?
Stryker’s largest risk is its stretched valuation combined with moderate leverage, which could pressure returns if growth slows. STERIS faces operational concentration risks but boasts stronger financial stability and a superior Piotroski Score (8 vs. 5). STERIS’s lower debt burden and safer Altman Z-Score reinforce a better risk-adjusted profile. Notably, STERIS’s recent increase in stock volatility (beta over 1) warrants caution despite its improved financial metrics.
Final Verdict: Which stock to choose?
Stryker Corporation’s superpower lies in its robust operational efficiency and consistent top-line growth. Its ability to generate strong cash flow amid industry pressures stands out. A point of vigilance is its declining return on invested capital, signaling potential value erosion over time. SYK fits best in portfolios seeking aggressive growth with a tolerance for cyclical risks.
STERIS plc offers a strategic moat through its steady cash flow and prudent capital structure. Its improving profitability trend and solid balance sheet provide a safety cushion relative to Stryker. STE suits investors aiming for growth at a reasonable price, combining moderate growth potential with better stability in volatile markets.
If you prioritize dynamic growth and can absorb cyclical swings, Stryker outshines with its operational momentum despite some value erosion. However, if you seek better financial stability and a gradually improving profitability profile, STERIS offers superior defensive qualities with a less aggressive growth path. Both present slightly favorable metrics but cater to distinctly different investor appetites.
Disclaimer: Investment carries a risk of loss of initial capital. The past performance is not a reliable indicator of future results. Be sure to understand risks before making an investment decision.
Go Further
I encourage you to read the complete analyses of Stryker Corporation and STERIS plc to enhance your investment decisions: