Home > Comparison > Financial Services > BK vs STT
The strategic rivalry between The Bank of New York Mellon Corporation and State Street Corporation defines the current trajectory of the asset management sector. BNY Mellon operates as a diversified financial services powerhouse with a broad custody and wealth management platform. In contrast, State Street emphasizes investment servicing and data-driven solutions for institutional investors. This analysis will identify which company’s operational focus offers a superior risk-adjusted return for a diversified portfolio in today’s evolving financial landscape.

Table of contents
Companies Overview
The Bank of New York Mellon and State Street Corporation hold pivotal roles in global asset management and financial services.
The Bank of New York Mellon Corporation: Custody and Investment Powerhouse
This company dominates the asset management arena through a diversified revenue model spanning Securities Services, Market and Wealth Services, and Investment and Wealth Management. Its core strength lies in custody, trust, and middle-office solutions supporting a broad client base from sovereigns to family offices. In 2026, BNY Mellon emphasizes integrated cash management and advanced data analytics to deepen client relationships and operational efficiency.
State Street Corporation: Institutional Investor Specialist
State Street focuses on delivering investment servicing and portfolio management solutions to institutional investors worldwide. Its revenue engine includes custody, risk analytics, trading services, and investment management strategies, including the SPDR ETF brand. The company’s 2026 strategy sharpens on ESG investing and fiduciary solutions, aiming to expand its footprint in socially responsible and retirement-focused investment products.
Strategic Collision: Similarities & Divergences
Both firms excel in asset servicing but diverge in strategic priorities. BNY Mellon pushes for integrated, technology-driven cash management and wealth services, while State Street leans heavily on ESG integration and alternative investments. Their primary battleground is custody and investment servicing of institutional clients. This competition creates distinct investment profiles: BNY Mellon offers broad diversification; State Street focuses on innovation in sustainable and fiduciary solutions.
Income Statement Comparison
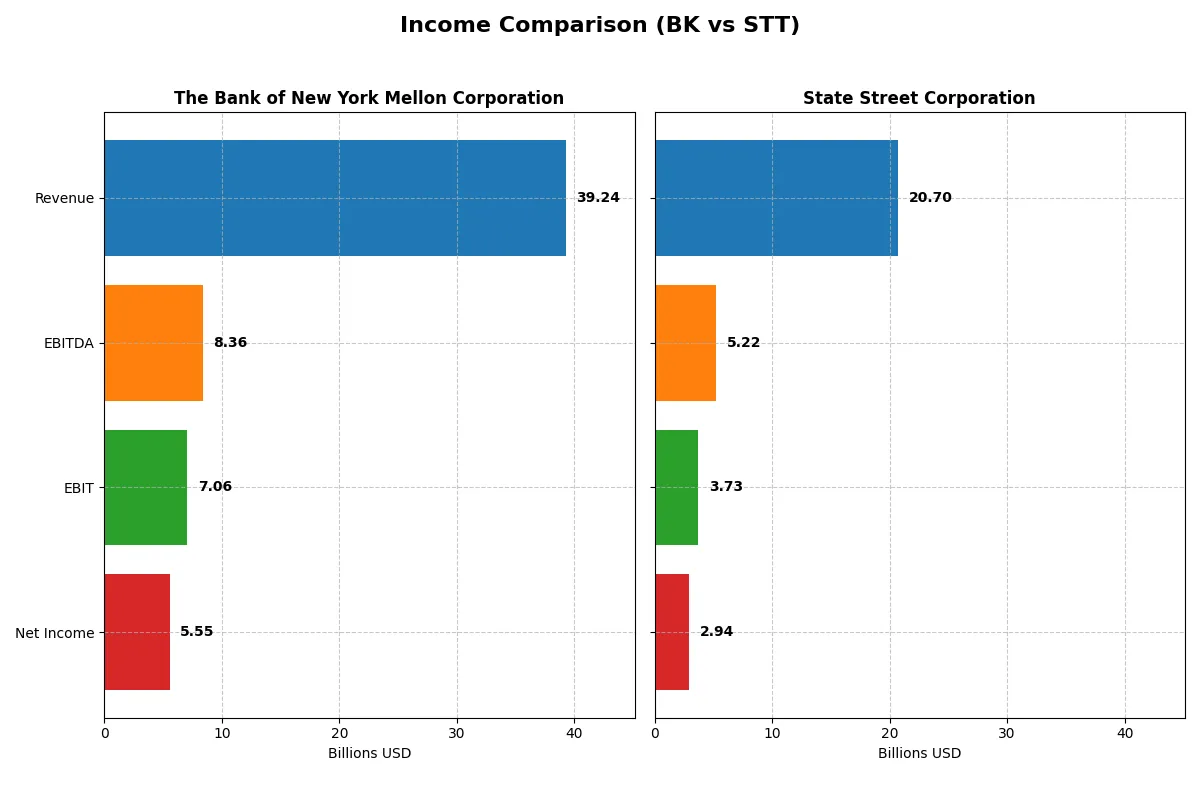
The following data dissects the core profitability and scalability of both corporate engines to reveal who dominates the bottom line:
| Metric | The Bank of New York Mellon Corporation (BK) | State Street Corporation (STT) |
|---|---|---|
| Revenue | 39.2B | 20.7B |
| Cost of Revenue | 19.4B | 6.8B |
| Operating Expenses | 12.8B | 10.2B |
| Gross Profit | 19.9B | 13.9B |
| EBITDA | 8.4B | 5.2B |
| EBIT | 7.1B | 3.7B |
| Interest Expense | 20.7B | 8.7B |
| Net Income | 5.5B | 2.9B |
| EPS | 7.46 | 9.56 |
| Fiscal Year | 2025 | 2025 |
Income Statement Analysis: The Bottom-Line Duel
This income statement comparison reveals each company’s operational efficiency and profitability across recent fiscal years.
The Bank of New York Mellon Corporation Analysis
BK’s revenue surged from $15.9B in 2021 to $39.2B in 2025, reflecting a 147% growth over five years. Net income climbed to $5.5B in 2025, up 48% overall. Gross margin stands healthy at 50.6%, while net margin improved to 14.1%. Despite a slight revenue dip in 2025, BK accelerated EBIT by 20.7%, showing strong profit momentum.
State Street Corporation Analysis
STT’s revenue rose steadily from $12.0B in 2021 to $20.7B in 2025, a 72% increase overall. Net income grew modestly to $2.9B in 2025, up 9% across five years. It boasts a robust gross margin of 67.2% and a net margin of 14.2%. Though revenue fell 5.8% last year, EBIT expanded by nearly 10%, signaling operational efficiency gains.
Margin Strength vs. Revenue Growth
BK leads with a sharper revenue and net income growth trajectory, fueled by improving operational margins. STT delivers superior gross margin but lags in top-line expansion and net income growth. Investors seeking high growth and accelerating profitability may favor BK’s profile, while STT appeals to those prioritizing margin resilience and steady earnings.
Financial Ratios Comparison
These vital ratios act as a diagnostic tool to expose underlying fiscal health, valuation premiums, and capital efficiency for the two corporations analyzed below:
| Ratios | The Bank of New York Mellon Corporation (BK) | State Street Corporation (STT) |
|---|---|---|
| ROE | 12.5% | 10.6% |
| ROIC | 6.4% | 2.7% |
| P/E | 14.7 | 12.3 |
| P/B | 1.85 | 1.30 |
| Current Ratio | 0.70 | 3.59 |
| Quick Ratio | 0.70 | 3.59 |
| D/E | 0.76 | 1.07 |
| Debt-to-Assets | 7.2% | 8.1% |
| Interest Coverage | 0.34 | 0.43 |
| Asset Turnover | 0.08 | 0.06 |
| Fixed Asset Turnover | 10.96 | 6.52 |
| Payout Ratio | 25.4% | 29.7% |
| Dividend Yield | 1.72% | 2.42% |
| Fiscal Year | 2025 | 2025 |
Efficiency & Valuation Duel: The Vital Signs
Ratios act as a company’s DNA, revealing hidden risks and operational excellence beyond surface-level metrics.
The Bank of New York Mellon Corporation
BK exhibits solid profitability with a 12.5% ROE and a favorable 14.14% net margin. Its P/E of 14.74 suggests a fairly valued stock, neither stretched nor cheap. Dividend yield stands at 1.72%, reflecting moderate shareholder returns complemented by reinvestment into operational efficiency rather than growth initiatives.
State Street Corporation
STT posts a slightly lower ROE of 10.6% but maintains a comparable net margin at 14.23%. The stock appears attractively priced with a P/E of 12.27 and a strong P/B of 1.3. Dividend yield is notably higher at 2.42%, indicating a more generous shareholder payout amid a reinvestment focus on balance sheet strength.
Balanced Profitability vs. Valuation Appeal
BK offers robust profitability with a conservative valuation, while STT delivers a more attractive price and higher dividend yield. STT’s ratio profile suits income-focused investors, whereas BK fits those prioritizing operational stability. Both carry risks, but their ratio balance targets distinct investor preferences.
Which one offers the Superior Shareholder Reward?
I observe that BK offers a consistent dividend yield around 1.7% to 3.6%, with payout ratios ranging from 25% to 54%, indicating moderate dividend distribution supported by stable earnings. BK’s buyback program is not explicitly detailed, suggesting a more conservative capital return approach. STT pays higher dividends, with yields near 2.4% to 3.9% and payout ratios between 29% and 50%, reflecting a balanced distribution strategy. However, STT’s aggressive buyback activity is less clear, but leverage ratios and financial leverage are higher, implying a riskier capital structure. BK’s lower payout ratio and steadier free cash flow coverage signal a more sustainable distribution model. I conclude BK offers a superior total shareholder return profile in 2026, blending reliable dividends with prudent capital allocation, while STT’s higher payout and leverage raise sustainability concerns.
Comparative Score Analysis: The Strategic Profile
The radar chart reveals the fundamental DNA and trade-offs of both firms, highlighting their financial strengths and valuation nuances:
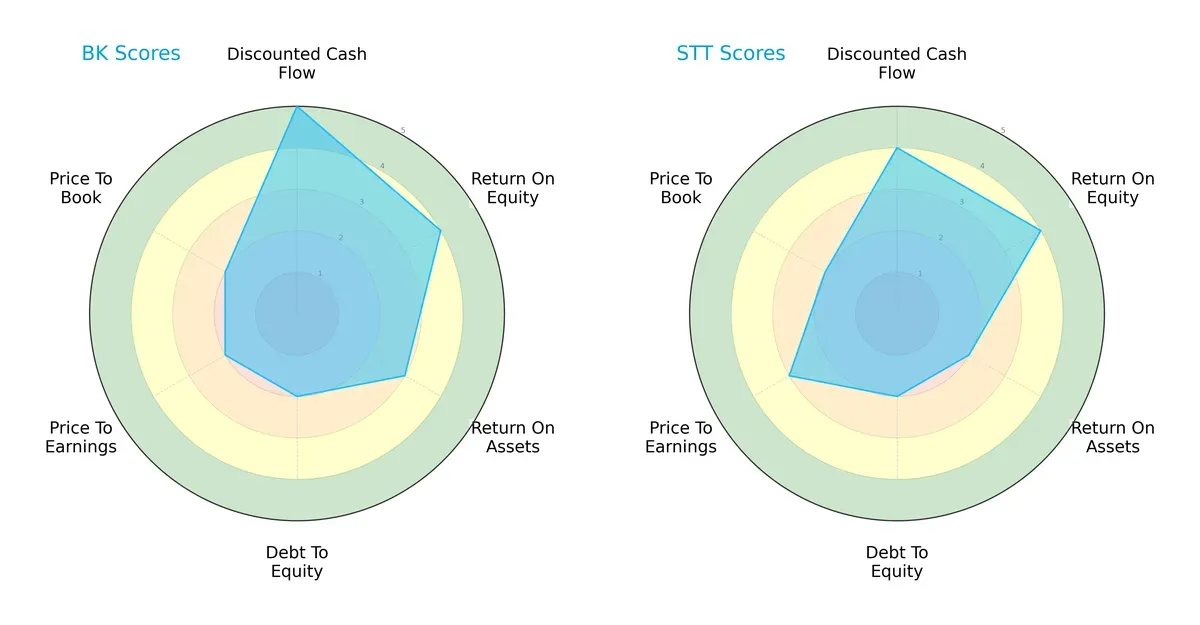
The Bank of New York Mellon (BK) excels in discounted cash flow (5) and shows solid return on equity (4) and assets (3). State Street (STT) matches BK’s ROE (4) but lags in ROA (2) and DCF (4). Both share moderate debt-to-equity (2) and price-to-book (2) scores, but STT enjoys a slightly better P/E score (3 vs. 2). BK’s profile is more balanced with a strong cash flow edge, while STT depends more on valuation appeal.
Bankruptcy Risk: Solvency Showdown
BK and STT both register dangerously low Altman Z-Scores in the distress zone, signaling significant bankruptcy risk in this cycle:
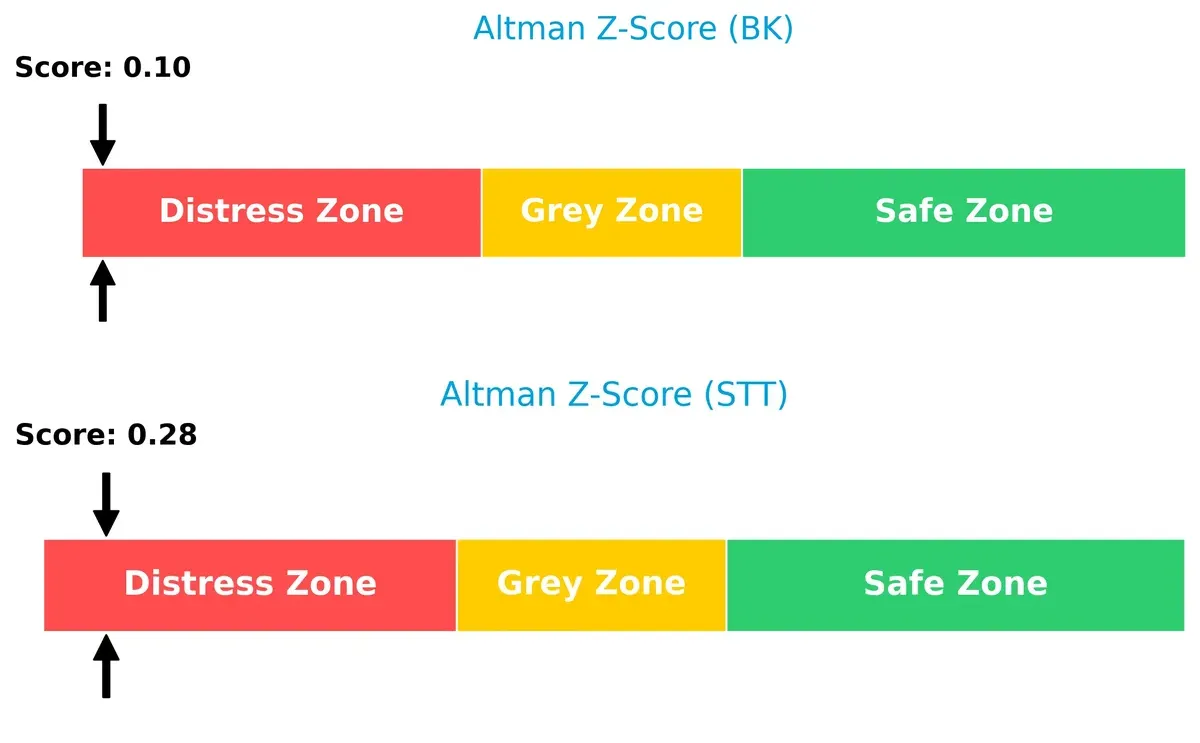
BK’s score is 0.10, slightly lower than STT’s 0.28, implying marginally higher financial distress. Historically, firms with such low scores face heightened default risks, underscoring urgent balance sheet repairs.
Financial Health: Quality of Operations
BK leads with a Piotroski F-Score of 6, reflecting average but relatively stronger internal financial health compared to STT’s 4, which flags potential internal weaknesses:
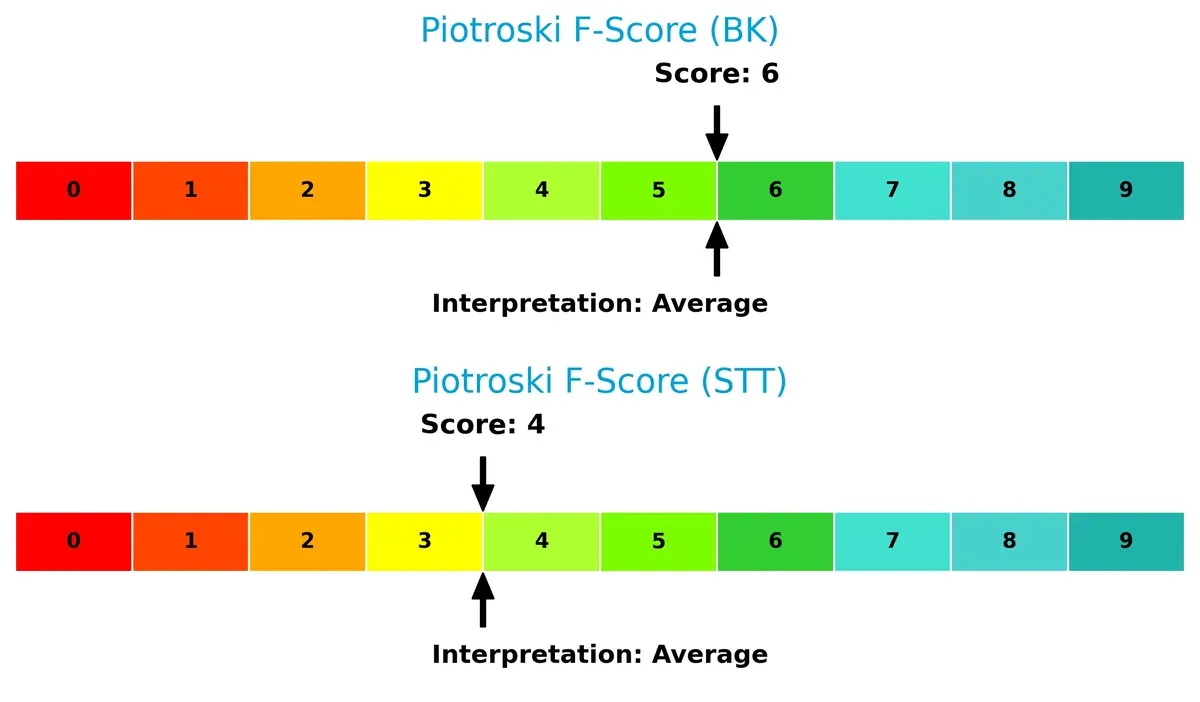
These scores suggest BK maintains more consistent profitability, liquidity, and operational efficiency, while STT’s lower score hints at red flags in financial quality needing close monitoring.
How are the two companies positioned?
This section dissects the operational DNA of BK and STT by comparing their revenue distribution by segment alongside their internal strengths and weaknesses. The final objective is to confront their economic moats and identify which business model offers the most resilient, sustainable competitive advantage in today’s market.
Revenue Segmentation: The Strategic Mix
The following comparison dissects how The Bank of New York Mellon and State Street diversify their income streams and where their primary sector bets lie:
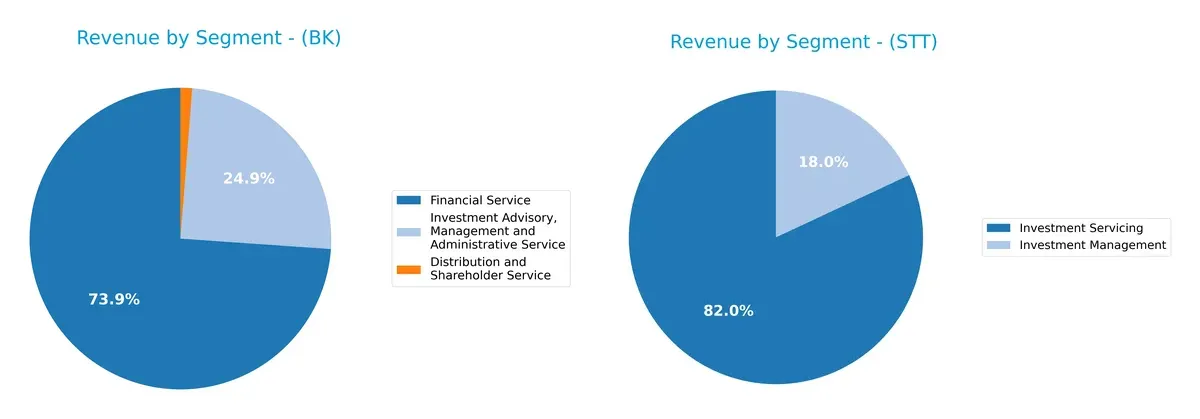
The Bank of New York Mellon anchors its revenue in Financial Service at $9.34B, supported by $3.14B in Investment Advisory. State Street pivots around Investment Servicing, generating $10.66B, with a smaller $2.34B from Investment Management. BK shows a more diversified mix with three sizable segments, while STT relies heavily on one dominant segment. BK’s spread reduces concentration risk, whereas STT’s focus signals strong infrastructure dominance but potential vulnerability to sector shifts.
Strengths and Weaknesses Comparison
This table compares the Strengths and Weaknesses of BK and STT based on diversification, profitability, financials, innovation, global presence, and market share:
BK Strengths
- Diverse revenue streams in financial and investment services
- Favorable net margin at 14.14%
- Strong fixed asset turnover of 10.96
- Favorable debt to assets ratio at 7.17%
- Large US and EMEA market presence with $12B+ domestic revenue
STT Strengths
- Favorable net margin at 14.23%
- Favorable price-to-earnings (PE) and price-to-book (PB) ratios
- Strong quick ratio at 3.59
- Favorable dividend yield at 2.42%
- Balanced US and non-US revenue distribution
BK Weaknesses
- Unfavorable weighted average cost of capital (WACC) at 19.98%
- Low current and quick ratios at 0.7
- Weak interest coverage at 0.34
- Unfavorable asset turnover at 0.08
- ROIC neutral at 6.38%
STT Weaknesses
- Unfavorable ROIC at 2.72% below WACC at 16.53%
- High debt-to-equity ratio at 1.07
- Unfavorable current ratio at 3.59
- Low interest coverage at 0.43
- Unfavorable asset turnover at 0.06
BK shows strength in asset efficiency and diversified services but faces liquidity and capital cost challenges. STT exhibits stronger market valuation metrics and liquidity but struggles with capital returns and leverage, indicating differing strategic trade-offs.
The Moat Duel: Analyzing Competitive Defensibility
A structural moat is the only true safeguard for long-term profits against relentless competitive erosion. Here’s how these two financial giants measure up:
The Bank of New York Mellon Corporation: Custody and Data Analytics Moat
I see BNY Mellon’s moat rooted in its intangible assets and switching costs, especially in custody and data services. Its stable margins and growing ROIC trend highlight operational strength. Expansion into tech-driven wealth management in 2026 could deepen this moat.
State Street Corporation: Investment Servicing and ETF Brand Moat
State Street leans on its cost advantage and brand power through SPDR ETFs and broad institutional services. However, its declining ROIC signals weakening competitiveness. Future innovation in ESG products offers growth but may not arrest margin pressure.
Custody Precision vs. ETF Brand Strength: The Moat Verdict
BNY Mellon’s growing ROIC trend and diversified service moat outpace State Street’s shrinking profitability and narrower focus. I judge BNY Mellon’s moat deeper and more resilient, better positioning it to defend market share in 2026.
Which stock offers better returns?
The past year showed strong upward momentum in both stocks, with notable price surges and sustained buyer dominance shaping their trading dynamics.
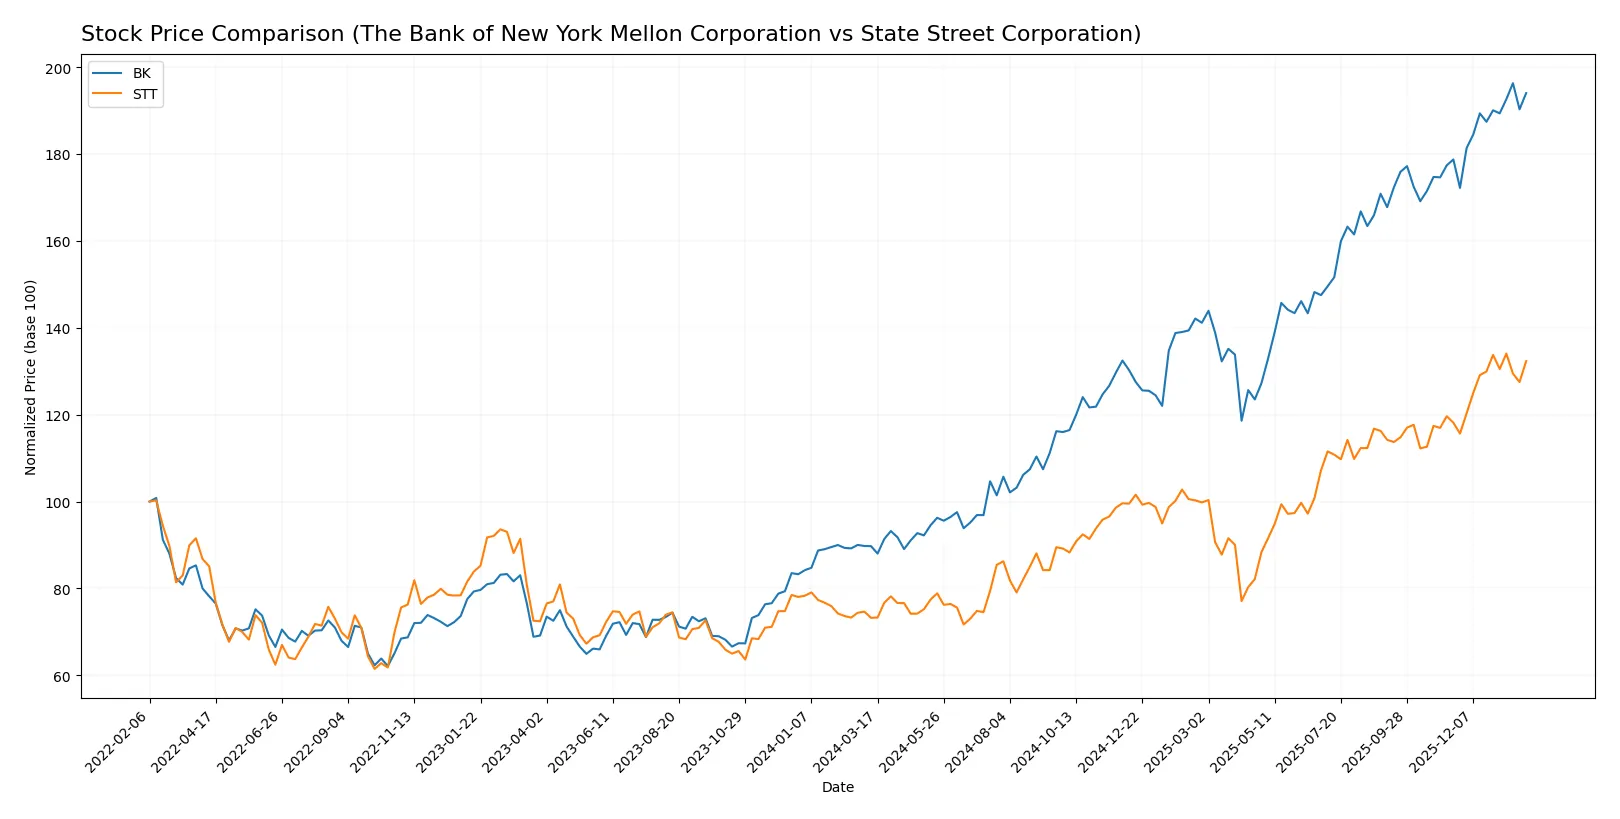
Trend Comparison
The Bank of New York Mellon Corporation (BK) posted a bullish trend with a 116.19% price increase over 12 months, showing acceleration and hitting a high of 121.33. State Street Corporation (STT) also displayed a bullish trend with an 80.67% gain, accelerating to a peak of 132.57 during the same period. BK outperformed STT in total price growth, delivering the highest market performance with a stronger overall gain and acceleration.
Target Prices
Analysts present a confident consensus for both The Bank of New York Mellon Corporation and State Street Corporation.
| Company | Target Low | Target High | Consensus |
|---|---|---|---|
| The Bank of New York Mellon Corporation | 110 | 143 | 130.25 |
| State Street Corporation | 128 | 164 | 142.17 |
The consensus target prices for BK and STT exceed current prices by roughly 9% and 9%, respectively. This suggests moderate upside potential aligned with sector growth expectations.

Don’t Let Luck Decide Your Entry Point
Optimize your entry points with our advanced ProRealTime indicators. You’ll get efficient buy signals with precise price targets for maximum performance. Start outperforming now!
How do institutions grade them?
The Bank of New York Mellon Corporation Grades
Here are the latest institutional grades for The Bank of New York Mellon Corporation:
| Grading Company | Action | New Grade | Date |
|---|---|---|---|
| Citigroup | Maintain | Neutral | 2026-01-14 |
| Morgan Stanley | Maintain | Overweight | 2026-01-14 |
| RBC Capital | Maintain | Sector Perform | 2026-01-14 |
| Wells Fargo | Maintain | Equal Weight | 2026-01-14 |
| Keefe, Bruyette & Woods | Maintain | Outperform | 2026-01-14 |
| Truist Securities | Upgrade | Buy | 2026-01-07 |
| TD Cowen | Maintain | Buy | 2026-01-07 |
| Barclays | Maintain | Overweight | 2026-01-05 |
State Street Corporation Grades
Here are the latest institutional grades for State Street Corporation:
| Grading Company | Action | New Grade | Date |
|---|---|---|---|
| Morgan Stanley | Maintain | Overweight | 2026-01-20 |
| Truist Securities | Downgrade | Hold | 2026-01-07 |
| TD Cowen | Maintain | Buy | 2026-01-07 |
| Barclays | Downgrade | Equal Weight | 2026-01-05 |
| Citigroup | Maintain | Buy | 2025-12-30 |
| Wells Fargo | Maintain | Overweight | 2025-10-20 |
| Keefe, Bruyette & Woods | Maintain | Outperform | 2025-10-20 |
Which company has the best grades?
The Bank of New York Mellon Corporation holds generally stronger and more consistent buy and overweight ratings. State Street faces recent downgrades to hold and equal weight. Investors may see greater confidence and momentum in Bank of New York Mellon’s outlook.
Risks specific to each company
The following categories identify the critical pressure points and systemic threats facing both firms in the 2026 market environment:
1. Market & Competition
The Bank of New York Mellon Corporation
- Faces intense competition in custody and wealth services; moderate market share pressure.
State Street Corporation
- Competes aggressively in ETF and index services; higher beta indicates greater market sensitivity.
2. Capital Structure & Debt
The Bank of New York Mellon Corporation
- Debt-to-assets at 7.17% is favorable; interest coverage at 0.34 signals weak debt servicing ability.
State Street Corporation
- Slightly higher debt-to-assets at 8.14%; interest coverage also low at 0.43, indicating leverage risk.
3. Stock Volatility
The Bank of New York Mellon Corporation
- Beta of 1.11 shows moderate volatility relative to market.
State Street Corporation
- Beta of 1.45 suggests higher stock price swings and greater investor risk.
4. Regulatory & Legal
The Bank of New York Mellon Corporation
- Operates under stringent financial regulations; potential for compliance costs.
State Street Corporation
- Similar regulatory environment; exposure to evolving ESG and fiduciary rules may increase costs.
5. Supply Chain & Operations
The Bank of New York Mellon Corporation
- Operational complexity due to diversified services may cause efficiency risks.
State Street Corporation
- Heavily reliant on technology and data management; operational disruptions could impact service delivery.
6. ESG & Climate Transition
The Bank of New York Mellon Corporation
- Engages in renewable energy investments but faces transition risks.
State Street Corporation
- Provides ESG investing products; must manage evolving investor expectations and regulatory demands.
7. Geopolitical Exposure
The Bank of New York Mellon Corporation
- Global operations expose it to currency and political risks.
State Street Corporation
- Also globally diversified; geopolitical tensions could impact cross-border asset flows.
Which company shows a better risk-adjusted profile?
The Bank of New York Mellon faces significant debt servicing challenges, while State Street carries higher volatility and operational risks. Both score poorly on Altman Z, signaling distress, but State Street’s superior ratio favorability and dividend yield suggest a slightly better risk-adjusted profile. However, both require cautious monitoring.
Final Verdict: Which stock to choose?
The Bank of New York Mellon (BK) excels as a cash-generating powerhouse with impressive earnings growth and improving profitability trends. Its ability to sustain operating leverage underpins its strength. However, a low liquidity ratio remains a point of vigilance, signaling potential short-term stress. BK suits aggressive growth portfolios willing to embrace some balance sheet risk.
State Street Corporation (STT) offers a strategic moat through its recurring revenue model and robust asset management franchise. It presents a safer profile with stronger liquidity and dividend yield, appealing to investors seeking stability. STT fits well in GARP (Growth at a Reasonable Price) portfolios focused on steady income and moderate growth.
If you prioritize dynamic earnings growth and operational efficiency, BK is the compelling choice due to its accelerating profitability despite liquidity concerns. However, if you seek better financial stability with a reliable income stream, STT offers superior safety and consistent cash flow. Both face challenges with value creation relative to capital costs, warranting close monitoring.
Disclaimer: Investment carries a risk of loss of initial capital. The past performance is not a reliable indicator of future results. Be sure to understand risks before making an investment decision.
Go Further
I encourage you to read the complete analyses of The Bank of New York Mellon Corporation and State Street Corporation to enhance your investment decisions: