Home > Comparison > Financial Services > STT vs TROW
The strategic rivalry between State Street Corporation and T. Rowe Price Group defines the current trajectory of the asset management sector. State Street operates a capital-intensive, service-heavy platform focusing on institutional investment servicing and custody. T. Rowe Price emphasizes active equity and fixed income management with a client-centric, research-driven model. This analysis will clarify which firm offers superior risk-adjusted returns, guiding portfolio decisions amid evolving financial market dynamics.
Table of contents
Companies Overview
State Street Corporation and T. Rowe Price Group, Inc. stand as influential pillars in the asset management landscape.
State Street Corporation: Institutional Financial Services Leader
State Street Corporation dominates as a global provider of investment servicing and management solutions. Its core revenue stems from custody, trading, portfolio management, and financial data services for institutional clients. In 2026, it strategically emphasizes integrated compliance, risk analytics, and ESG investing to enhance client outcomes and expand its fiduciary solutions.
T. Rowe Price Group, Inc.: Active Investment Manager
T. Rowe Price Group focuses on equity and fixed income mutual fund management with a bottom-up investment approach. It generates revenue mainly through managing diversified portfolios for individuals and institutions. The firm’s 2026 strategy highlights socially responsible investing and late-stage venture capital, leveraging in-house and external research to drive active portfolio performance.
Strategic Collision: Similarities & Divergences
Both firms operate within asset management but differ markedly in approach: State Street leans on a broad institutional service platform while T. Rowe Price emphasizes active, research-driven fund management. Their primary battleground is market share in institutional versus retail-focused investment products. This divergence creates distinct investment profiles—State Street as a diversified service provider and T. Rowe Price as a focused asset manager with active strategies.
Income Statement Comparison
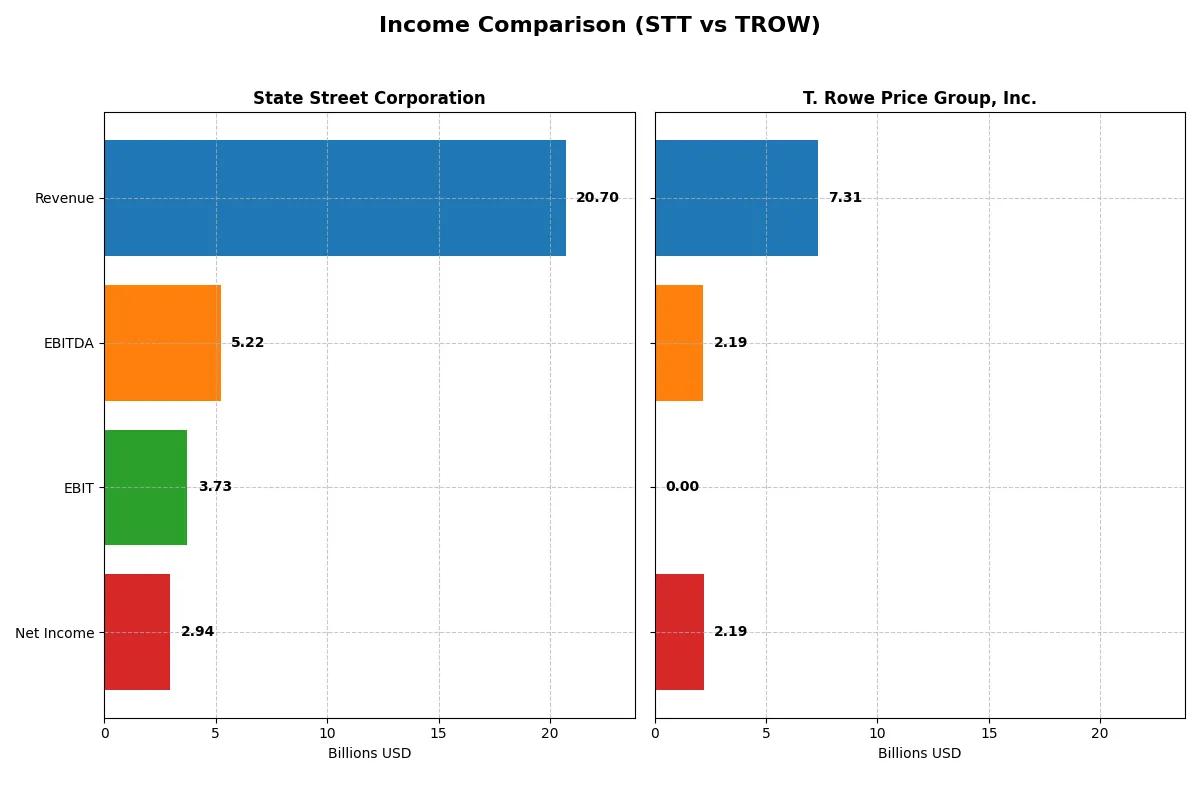
This data dissects the core profitability and scalability of both corporate engines to reveal who dominates the bottom line:
| Metric | State Street Corporation (STT) | T. Rowe Price Group, Inc. (TROW) |
|---|---|---|
| Revenue | 20.7B | 7.3B |
| Cost of Revenue | 6.8B | 0 |
| Operating Expenses | 10.2B | 5.1B |
| Gross Profit | 13.9B | 0 |
| EBITDA | 5.2B | 2.2B |
| EBIT | 3.7B | 0 |
| Interest Expense | 8.7B | 0 |
| Net Income | 2.9B | 2.2B |
| EPS | 9.56 | 9.26 |
| Fiscal Year | 2025 | 2025 |
Income Statement Analysis: The Bottom-Line Duel
This income statement comparison reveals the true efficiency and profitability trends driving each company’s financial engine through recent years.
State Street Corporation Analysis
State Street’s revenue grew 72% from 2021 to 2025, peaking at $20.7B in 2025 despite a 5.8% dip versus 2024. Gross margin remains strong at 67.2%, fueling a solid 14.2% net margin. Net income rose steadily to $2.95B in 2025, supported by improving EBIT margin and EPS growth, signaling robust operational momentum.
T. Rowe Price Group, Inc. Analysis
T. Rowe Price’s revenue declined 4.6% over five years, reaching $7.3B in 2025 with slight 3.1% growth year-over-year. Gross profit figures vanished in 2025, reflecting structural shifts or accounting changes. Despite a hefty $3.98B in other expenses, net margin holds at 30%, with net income around $2.19B, but overall earnings show a weakening trend.
Margin Strength vs. Revenue Momentum
State Street dominates with superior revenue growth and high gross and EBIT margins, reflecting operational efficiency. T. Rowe Price boasts a higher net margin but shows revenue and net income contraction. Investors seeking growth and margin resilience may favor State Street’s profile, while T. Rowe Price’s margin strength faces risks from declining top-line momentum.
Financial Ratios Comparison
These vital ratios act as a diagnostic tool to expose the underlying fiscal health, valuation premiums, and capital efficiency of the companies compared below:
| Ratios | State Street Corporation (STT) | T. Rowe Price Group, Inc. (TROW) |
|---|---|---|
| ROE | 10.58% | 20.30% |
| ROIC | 2.72% | 13.56% |
| P/E | 12.27 | 10.28 |
| P/B | 1.30 | N/A |
| Current Ratio | 3.59 | 0.00 |
| Quick Ratio | 3.59 | 0.00 |
| D/E | 1.07 | 0.00 |
| Debt-to-Assets | 8.14% | 0.00 |
| Interest Coverage | 0.43 | 0.00 |
| Asset Turnover | 0.06 | 0.00 |
| Fixed Asset Turnover | 6.52 | 0.00 |
| Payout ratio | 29.66% | 50.99% |
| Dividend yield | 2.42% | 4.96% |
| Fiscal Year | 2025 | 2025 |
Efficiency & Valuation Duel: The Vital Signs
Ratios act as a company’s DNA, uncovering hidden risks and operational excellence that drive investment decisions with clarity and precision.
State Street Corporation
State Street shows a solid 10.6% ROE, indicating moderate profitability, while its net margin of 14.2% is favorable. The stock trades at a reasonable P/E of 12.3 and a P/B of 1.3, suggesting fair valuation. Shareholders benefit from a 2.4% dividend yield, reflecting steady income amid reinvestment constraints highlighted by a weak ROIC.
T. Rowe Price Group, Inc.
T. Rowe Price displays a robust net margin of 30.0%, showcasing operational efficiency, while its P/E of 10.3 indicates a moderately attractive valuation. Despite an unfavorable ROE metric, the company delivers a generous 5.0% dividend yield. However, limited data on capital returns and asset turnover warrants caution on operational leverage.
Valuation Grounded in Profitability and Risk
State Street balances modest profitability with a reasonable valuation and steady dividends, offering operational stability. T. Rowe Price impresses with higher margins and dividend yield but lacks clarity on key profitability ratios. Investors favoring income and margin strength may lean toward T. Rowe Price’s profile, while those seeking stability might prefer State Street.
Which one offers the Superior Shareholder Reward?
I see State Street Corporation (STT) delivers a moderate 2.4% dividend yield with a conservative 30% payout ratio, balancing income and reinvestment. Its buybacks are steady but less aggressive. T. Rowe Price Group (TROW) yields almost 5%, with a 51% payout ratio and robust buybacks fueled by strong free cash flow. Historically, TROW’s model drives higher total returns through a blend of income and capital return. I find TROW’s distribution strategy more sustainable and rewarding in 2026, given its superior free cash flow coverage and consistent buyback intensity.
Comparative Score Analysis: The Strategic Profile
The radar chart exposes the fundamental DNA and trade-offs of State Street Corporation and T. Rowe Price Group, Inc., highlighting their distinctive financial strengths and weaknesses:
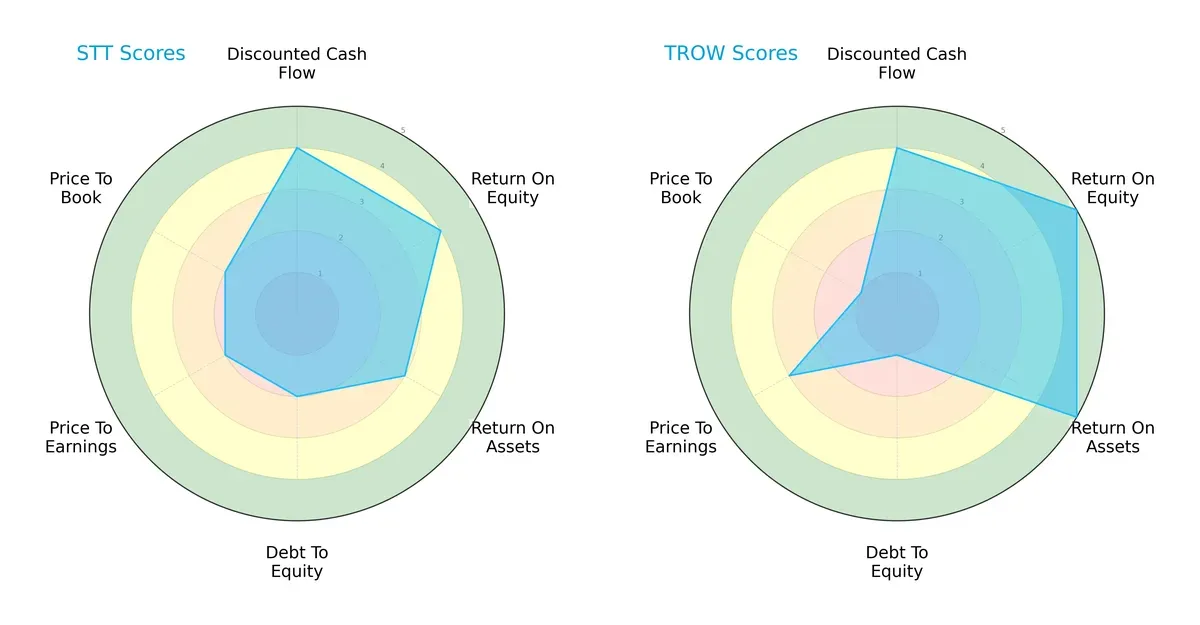
T. Rowe Price leads with superior ROE (5 vs. 4) and ROA (5 vs. 3) scores, reflecting more efficient profit generation and asset utilization. State Street holds a better debt-to-equity position (2 vs. 1), signaling a more conservative leverage profile. Both share equal DCF scores (4), but T. Rowe’s valuation scores (P/E 3, P/B 1) reveal a riskier pricing compared to State Street’s moderate valuations (P/E 2, P/B 2). Overall, State Street presents a more balanced profile, while T. Rowe relies on operational efficiency at the expense of financial leverage and valuation discipline.
Bankruptcy Risk: Solvency Showdown
The Altman Z-Score gap decisively favors T. Rowe Price, indicating a stark contrast in bankruptcy risk between these firms:
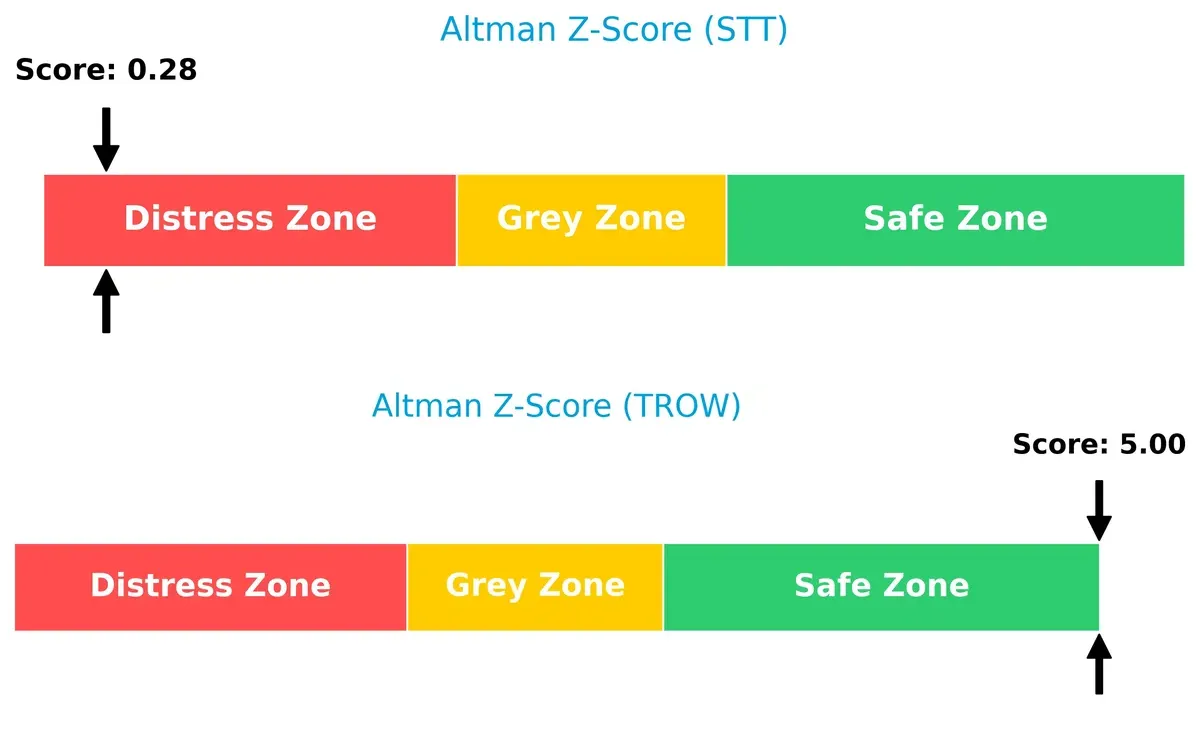
T. Rowe’s score of 5.0 places it firmly in the safe zone, reflecting robust financial stability and low default risk. State Street’s distress zone score of 0.3 signals severe solvency concerns and heightened bankruptcy risk, demanding cautious scrutiny in this economic cycle.
Financial Health: Quality of Operations
Both companies score identically on the Piotroski F-Score, suggesting comparable operational quality but with notable limitations:
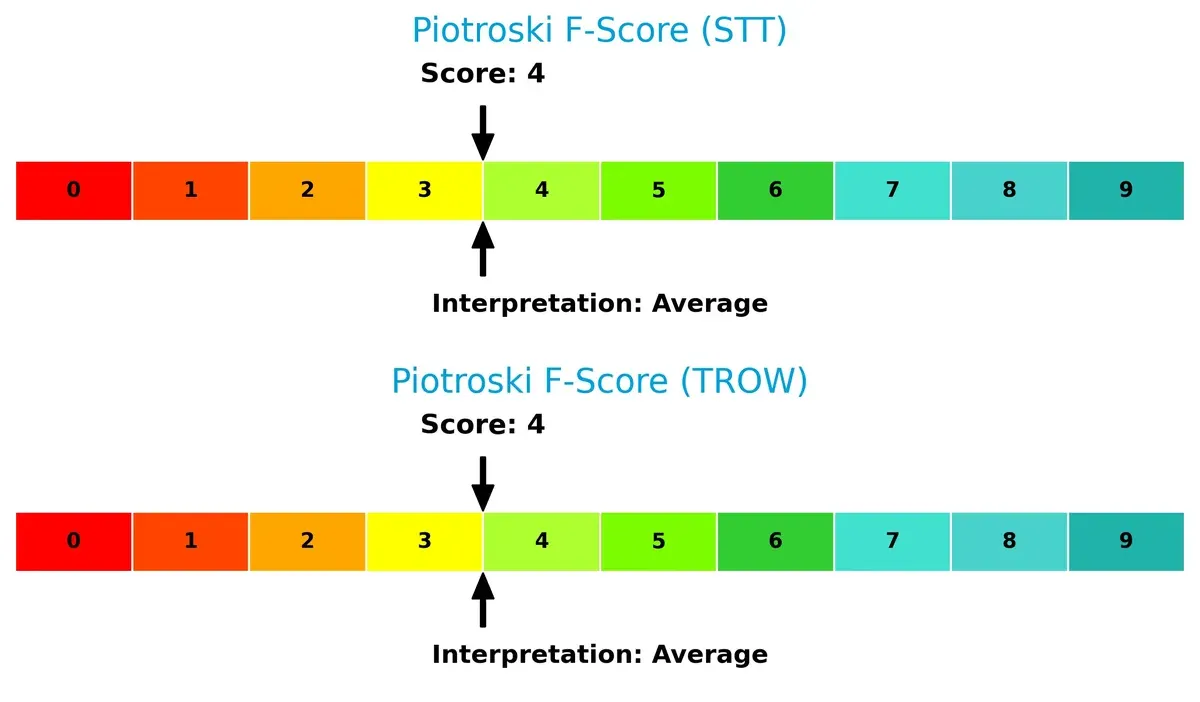
A score of 4 out of 9 indicates average financial health. Neither firm demonstrates peak strength, and both show red flags in profitability, leverage, or efficiency metrics. Investors should watch for potential internal weaknesses that could impair resilience during downturns.
How are the two companies positioned?
This section dissects the operational DNA of State Street and T. Rowe Price by comparing their revenue distribution and internal strengths and weaknesses. The goal is to confront their economic moats to determine which model offers the most resilient competitive advantage today.
Revenue Segmentation: The Strategic Mix
The following visual comparison dissects how State Street Corporation and T. Rowe Price Group diversify their income streams and where their primary sector bets lie:
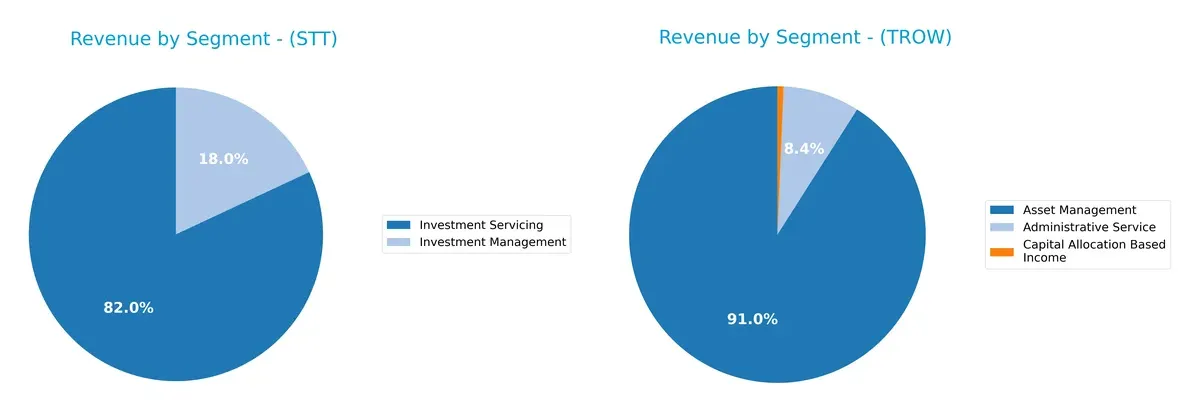
State Street leans heavily on Investment Servicing, generating $10.7B in 2024 versus $2.3B from Investment Management. This signals infrastructure dominance but concentration risk. Conversely, T. Rowe Price anchors revenue in Asset Management at $6.4B, supplemented by Administrative Service and smaller Capital Allocation income. T. Rowe Price shows a more diversified model, reducing dependency on a single segment and allowing better resilience amid market cycles.
Strengths and Weaknesses Comparison
This table compares the Strengths and Weaknesses of State Street Corporation and T. Rowe Price Group, Inc.:
State Street Corporation Strengths
- Diversified revenue from Investment Servicing and Management
- Favorable net margin of 14.23%
- Strong fixed asset turnover at 6.52
- Balanced US and Non-US revenue streams
- Favorable P/E at 12.27 and P/B at 1.3
- Dividend yield of 2.42%
T. Rowe Price Group Strengths
- High net margin of 30.01% reflects strong profitability
- Favorable P/E of 10.28 and P/B (data incomplete but favorable)
- Higher dividend yield at 4.96%
- Revenue mainly from Asset Management with Administrative Services
- Low debt-to-equity and debt-to-assets ratios indicate conservative leverage
State Street Corporation Weaknesses
- Unfavorable ROIC (2.72%) below WACC (16.51%) indicates capital inefficiency
- High debt-to-equity ratio at 1.07
- Low interest coverage of 0.43 raises risk concerns
- Unfavorable asset turnover at 0.06 limits operational efficiency
- Overly high current ratio (3.59) may imply inefficient asset use
T. Rowe Price Group Weaknesses
- Zero or unavailable data for ROE, ROIC, WACC hinders full financial assessment
- Unfavorable current and quick ratios at zero suggest liquidity concerns
- Unfavorable interest coverage and asset turnover
- Heavy reliance on Asset Management with limited diversification
- Higher proportion of unfavorable ratios (50%) signals potential financial weaknesses
State Street shows balanced diversification and global presence with moderate profitability but struggles with capital efficiency and leverage. T. Rowe Price excels in profitability and conservative leverage but lacks diversification and has liquidity transparency issues. Both companies face operational efficiency challenges that could influence their strategic priorities.
The Moat Duel: Analyzing Competitive Defensibility
A structural moat is the only thing protecting long-term profits from the erosion of competition. Let’s dissect how two asset managers defend their turf:
State Street Corporation: Intangible Assets and Scale
State Street leverages its massive global custody network and data analytics platform. This moat shows in stable margins and 14% net profit despite revenue dips. New ESG products could deepen its edge in 2026.
T. Rowe Price Group, Inc.: Active Management Brand Loyalty
T. Rowe Price’s moat stems from trusted active management and client relationships, contrasting State Street’s scale. Yet, declining earnings and negative long-term growth challenge its competitive stance. Expansion into sustainable funds offers growth potential.
Custody Network vs. Brand Loyalty: Which Moat Holds Stronger?
State Street’s vast custody infrastructure creates a wider moat than T. Rowe Price’s brand-driven loyalty. Despite recent setbacks, State Street is better positioned to defend market share with scalable services and innovation.
Which stock offers better returns?
Over the past year, State Street Corporation’s stock surged sharply by 82.11%, showing strong acceleration. In contrast, T. Rowe Price Group, Inc. faced a significant decline of 15.53%, reflecting bearish trading dynamics.
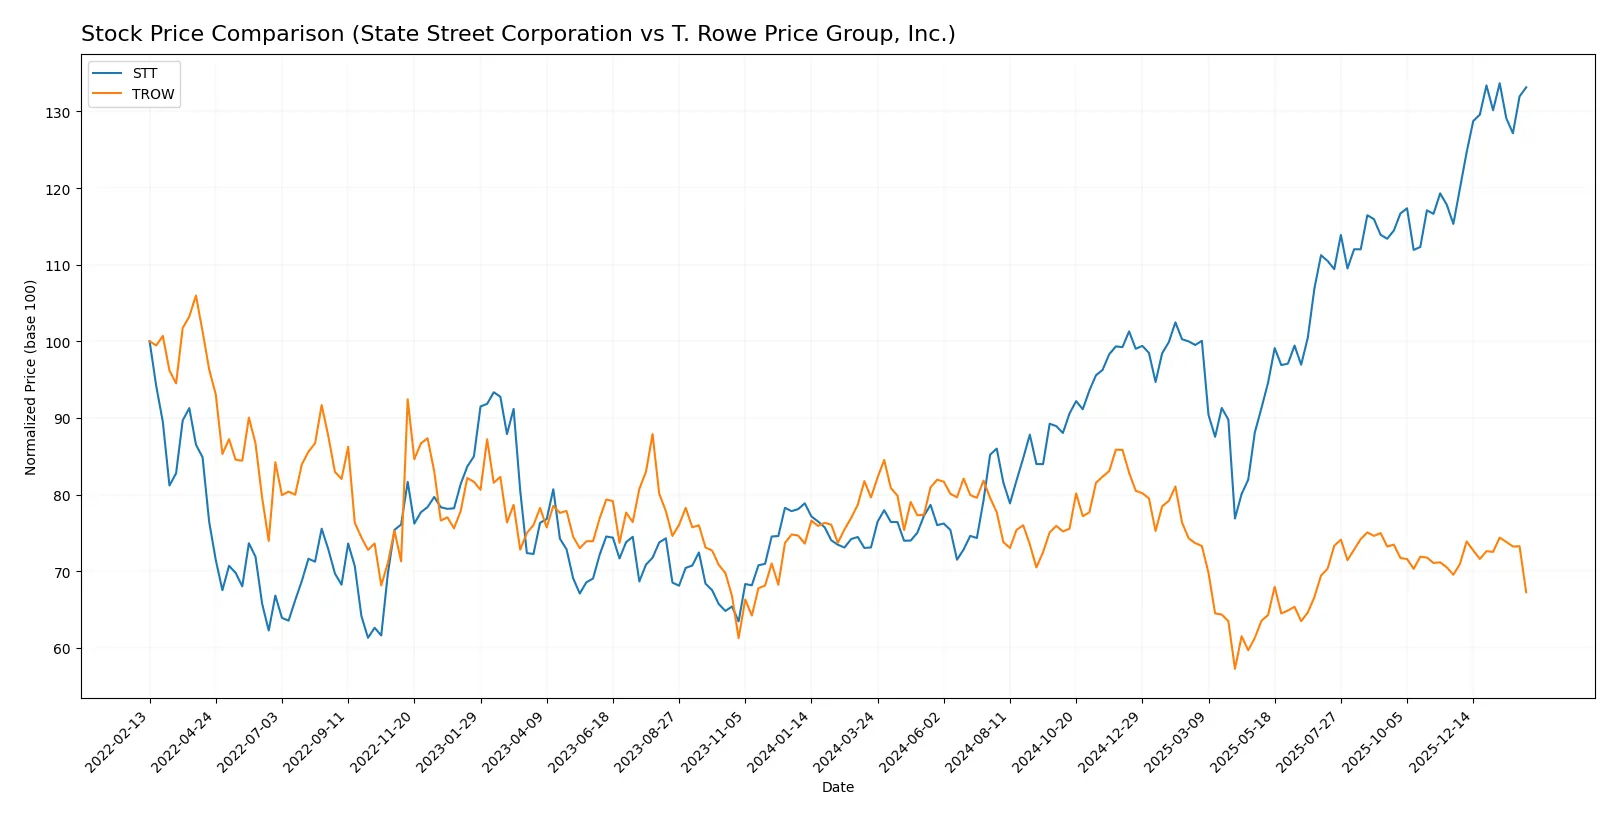
Trend Comparison
State Street Corporation’s stock climbed 82.11% over the past 12 months, marking a bullish trend with accelerating gains and a high volatility level of 17.07%.
T. Rowe Price Group, Inc. dropped 15.53% during the same period, demonstrating an accelerating bearish trend accompanied by moderate volatility measured at 8.83%.
Comparing these trends, State Street Corporation delivered substantially stronger market performance than T. Rowe Price Group, Inc. over the past year.
Target Prices
Analysts present a moderately optimistic consensus for these asset managers.
| Company | Target Low | Target High | Consensus |
|---|---|---|---|
| State Street Corporation | 128 | 164 | 142.17 |
| T. Rowe Price Group, Inc. | 102 | 123 | 113.33 |
State Street’s target consensus at 142.17 exceeds its current 132.03 price, signaling upside potential. T. Rowe Price’s consensus of 113.33 also suggests room to recover from the current 97.02 price level.

Don’t Let Luck Decide Your Entry Point
Optimize your entry points with our advanced ProRealTime indicators. You’ll get efficient buy signals with precise price targets for maximum performance. Start outperforming now!
How do institutions grade them?
State Street Corporation Grades
Here are the recent grades from key financial institutions for State Street Corporation:
| Grading Company | Action | New Grade | Date |
|---|---|---|---|
| Morgan Stanley | maintain | Overweight | 2026-01-20 |
| Truist Securities | downgrade | Hold | 2026-01-07 |
| TD Cowen | maintain | Buy | 2026-01-07 |
| Barclays | downgrade | Equal Weight | 2026-01-05 |
| Citigroup | maintain | Buy | 2025-12-30 |
| Citigroup | maintain | Buy | 2025-10-24 |
| Keefe, Bruyette & Woods | maintain | Outperform | 2025-10-20 |
| Truist Securities | maintain | Buy | 2025-10-20 |
| Morgan Stanley | maintain | Overweight | 2025-10-20 |
| Wells Fargo | maintain | Overweight | 2025-10-20 |
T. Rowe Price Group, Inc. Grades
The following table summarizes the latest grades for T. Rowe Price Group, Inc.:
| Grading Company | Action | New Grade | Date |
|---|---|---|---|
| Morgan Stanley | maintain | Equal Weight | 2026-02-03 |
| JP Morgan | maintain | Underweight | 2026-01-20 |
| Barclays | maintain | Underweight | 2026-01-15 |
| TD Cowen | maintain | Hold | 2026-01-14 |
| Keefe, Bruyette & Woods | maintain | Market Perform | 2025-12-17 |
| Morgan Stanley | maintain | Equal Weight | 2025-12-17 |
| Barclays | maintain | Underweight | 2025-12-12 |
| Evercore ISI Group | maintain | In Line | 2025-12-05 |
| JP Morgan | maintain | Underweight | 2025-11-03 |
| Keefe, Bruyette & Woods | maintain | Market Perform | 2025-11-03 |
Which company has the best grades?
State Street Corporation consistently earns higher grades like Buy and Overweight from top firms. T. Rowe Price mostly receives Hold or Underweight ratings. This suggests stronger institutional confidence in State Street, potentially affecting investor sentiment and stock performance.
Risks specific to each company
The following categories identify the critical pressure points and systemic threats facing both firms in the 2026 market environment:
1. Market & Competition
State Street Corporation
- Larger market cap offers scale advantages but invites intense rivalry in custody and ETF services.
T. Rowe Price Group, Inc.
- Smaller scale but strong in active and ESG-focused funds, facing fierce competition from passive and quant managers.
2. Capital Structure & Debt
State Street Corporation
- Debt-to-equity ratio above 1 with weak interest coverage signals leverage risk.
T. Rowe Price Group, Inc.
- Virtually no reported debt, indicating a conservative balance sheet and lower financial risk.
3. Stock Volatility
State Street Corporation
- Beta at 1.44 implies higher sensitivity to market swings than the average financial stock.
T. Rowe Price Group, Inc.
- Beta at 1.54 reflects even greater stock price volatility, increasing investment risk.
4. Regulatory & Legal
State Street Corporation
- Global custody and trading services expose it to complex regulatory regimes and compliance costs.
T. Rowe Price Group, Inc.
- Investment advisory and ESG mandates face evolving fiduciary regulations and scrutiny on sustainability claims.
5. Supply Chain & Operations
State Street Corporation
- Relies on sophisticated data infrastructure; operational disruptions could impact service delivery.
T. Rowe Price Group, Inc.
- Primarily human capital driven; talent retention and technology integration are critical operational risks.
6. ESG & Climate Transition
State Street Corporation
- Strong ESG product offerings but faces transition risks in maintaining leadership amid rising standards.
T. Rowe Price Group, Inc.
- Focuses on socially responsible investing, yet dependency on ESG fund inflows adds revenue variability.
7. Geopolitical Exposure
State Street Corporation
- Extensive global footprint subjects it to geopolitical tensions affecting cross-border asset flows.
T. Rowe Price Group, Inc.
- Global offices increase exposure but smaller scale may limit impact compared to larger peers.
Which company shows a better risk-adjusted profile?
State Street’s leverage and operational scale pose notable risks, but its diversified services provide cushioning. T. Rowe Price benefits from minimal debt and robust profitability but faces greater stock volatility and concentrated ESG dependence. The Altman Z-Score starkly favors T. Rowe Price’s financial stability. Recent data reveal State Street’s interest coverage below 1, a red flag for solvency risk. T. Rowe Price’s superior Altman Z-Score and stronger ROE metrics signal a better risk-adjusted profile despite market volatility concerns.
Final Verdict: Which stock to choose?
State Street Corporation’s superpower lies in its robust cash generation and operational efficiency, which supports steady dividend payouts. A point of vigilance is its declining return on invested capital, signaling potential value erosion. It fits portfolios seeking stable income with moderate growth exposure.
T. Rowe Price Group, Inc. commands a strong strategic moat through its asset management expertise and recurring revenue streams. It offers better financial safety than State Street, supported by a healthier Altman Z-score. This stock suits investors favoring growth at a reasonable price with lower risk tolerance.
If you prioritize steady income and operational efficiency, State Street Corporation is the compelling choice due to its cash flow strength and dividend yield. However, if you seek superior stability and a durable competitive moat, T. Rowe Price offers better downside protection despite recent growth challenges.
Disclaimer: Investment carries a risk of loss of initial capital. The past performance is not a reliable indicator of future results. Be sure to understand risks before making an investment decision.
Go Further
I encourage you to read the complete analyses of State Street Corporation and T. Rowe Price Group, Inc. to enhance your investment decisions: