Home > Comparison > Consumer Cyclical > SBUX vs YUM
The strategic rivalry between Starbucks Corporation and Yum! Brands defines the current trajectory of the global consumer cyclical sector. Starbucks operates as a capital-intensive specialty coffee roaster and retailer with a vast global footprint. Yum! Brands, in contrast, focuses on franchised quick-service restaurants across multiple fast-food categories. This analysis will assess which business model delivers a superior risk-adjusted return for diversified portfolios amid evolving consumer trends.

Table of contents
Companies Overview
Starbucks and Yum! Brands dominate the global restaurant sector with distinct strategies and brand portfolios.
Starbucks Corporation: Specialty Coffee Pioneer
Starbucks leads as a specialty coffee roaster and retailer with a robust global footprint. It generates revenue mainly through company-operated and licensed stores selling coffee, tea, and food across three segments: North America, International, and Channel Development. In 2026, Starbucks sharpens its focus on premium product innovation and expanding its international store base to sustain growth.
Yum! Brands, Inc.: Quick-Service Restaurant Giant
Yum! Brands commands a vast network of quick-service restaurants under KFC, Pizza Hut, Taco Bell, and Habit Burger Grill. Its core revenue driver lies in franchising and operating these brands worldwide, emphasizing menu innovation and digital ordering. The 2026 strategy centers on accelerating digital transformation and expanding footprint in emerging markets to capture fast-food demand.
Strategic Collision: Similarities & Divergences
Starbucks and Yum! Brands both thrive in consumer cyclical dining but diverge sharply in business models: Starbucks controls retail operations, while Yum! relies on franchising. They compete primarily on global expansion and brand loyalty in fast casual versus quick service. Their distinct profiles offer investors exposure to premium coffee culture versus scalable fast-food chains with varied risk and growth trajectories.
Income Statement Comparison
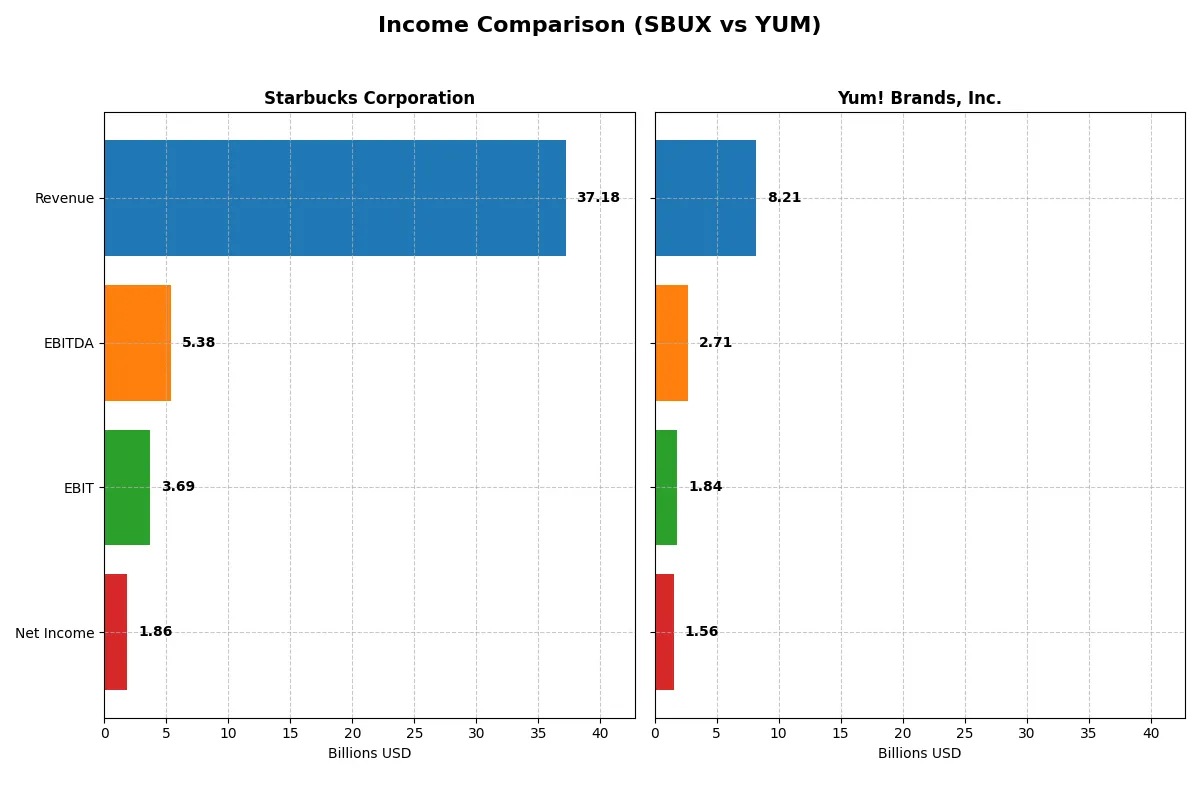
This data dissects the core profitability and scalability of both corporate engines to reveal who dominates the bottom line:
| Metric | Starbucks Corporation (SBUX) | Yum! Brands, Inc. (YUM) |
|---|---|---|
| Revenue | 37.2B | 8.2B |
| Cost of Revenue | 28.2B | 3.0B |
| Operating Expenses | 5.4B | 1.2B |
| Gross Profit | 9.0B | 2.7B |
| EBITDA | 5.4B | 2.7B |
| EBIT | 3.7B | 1.8B |
| Interest Expense | 543M | 500M |
| Net Income | 1.9B | 1.0B |
| EPS | 1.63 | 5.59 |
| Fiscal Year | 2025 | 2025 |
Income Statement Analysis: The Bottom-Line Duel
This income statement comparison will expose each company’s operational efficiency and profitability momentum over recent years.
Starbucks Corporation Analysis
Starbucks’ revenue climbed steadily from $29B in 2021 to $37B in 2025, showing 28% growth overall. However, its net income plunged 56% over the same period, halving to $1.86B in 2025. Gross margin fell to 24.15%, while net margin slipped to 4.99%, indicating margin compression. The sharp decline in net income and EPS in 2025 signals weakening profitability despite growing sales.
Yum! Brands, Inc. Analysis
Yum! Brands grew revenue from $6.58B in 2021 to $8.21B in 2025, a 25% increase. Net income remained more stable, slightly down 1% to $1.56B in 2025, supported by a strong net margin near 19%. Gross margin is robust at 32.55%, and EBIT margin at 22.35%, demonstrating efficient cost control. Earnings per share rose 6.5% over five years, reflecting solid operational discipline.
Margin Strength vs. Revenue Expansion
Yum! Brands exhibits superior margin health and profit stability, while Starbucks shows stronger revenue growth but deteriorating profitability. Starbucks’ steep net income decline undermines its scale advantage. Yum!’s balanced earnings profile with expanding EPS marks it as the financially sturdier choice. Investors favoring consistent profitability over rapid top-line growth will find Yum! more attractive.
Financial Ratios Comparison
These vital ratios act as a diagnostic tool to expose the underlying fiscal health, valuation premiums, and capital efficiency of the companies compared below:
| Ratios | Starbucks Corporation (SBUX) | Yum! Brands, Inc. (YUM) |
|---|---|---|
| ROE | -22.9% | 0% |
| ROIC | 8.5% | 0% |
| P/E | 52.6 | 27.0 |
| P/B | -12.1 | 0 |
| Current Ratio | 0.72 | 0 |
| Quick Ratio | 0.51 | 0 |
| D/E | -3.29 | 0 |
| Debt-to-Assets | 83.1% | 0 |
| Interest Coverage | 6.6 | 5.1 |
| Asset Turnover | 1.16 | 0 |
| Fixed Asset Turnover | 2.09 | 0 |
| Payout ratio | 149.3% | 50.6% |
| Dividend yield | 2.84% | 1.88% |
| Fiscal Year | 2025 | 2025 |
Efficiency & Valuation Duel: The Vital Signs
Financial ratios act as a company’s DNA, exposing hidden risks and operational strengths that are crucial for investment decisions.
Starbucks Corporation
Starbucks struggles with a negative ROE of -23%, signaling weak profitability despite a neutral ROIC of 8.5%, just above its 7.2% WACC. The stock trades at a stretched P/E of 52.6, reflecting high valuation risk. The firm supports shareholders with a 2.8% dividend yield, balancing reinvestment as R&D spending is absent.
Yum! Brands, Inc.
Yum! Brands posts a strong net margin of 19%, but lacks reported ROE and ROIC data, limiting profitability insights. The P/E at 27 appears high but less stretched than Starbucks. Dividend yield stands modest at 1.9%, indicating some shareholder return, though absent capital efficiency metrics suggest caution on operational leverage.
Premium Valuation vs. Operational Safety
Starbucks carries a high valuation with poor profitability metrics, raising risk concerns. Yum! Brands shows better margin strength but lacks clear capital return data. Investors seeking dividend income and operational safety may prefer Yum!, while those betting on reinvestment and growth face Starbucks’ stretched profile.
Which one offers the Superior Shareholder Reward?
I see Starbucks offers a higher dividend yield at 2.8% with a payout ratio above 100%, signaling aggressive returns but raising sustainability concerns. Yum! Brands yields less at 1.9%, with a prudent 50% payout ratio supported by strong free cash flow. Starbucks’ buyback pace is moderate, while Yum!, fueled by robust operating cash flow of 7.2/share, executes more intense buybacks, enhancing shareholder value. I find Yum!’s balanced dividend and strong buyback strategy more sustainable. In 2026, Yum! Brands delivers a superior total shareholder return profile due to disciplined capital allocation and sustainable distributions.
Comparative Score Analysis: The Strategic Profile
The radar chart reveals the fundamental DNA and trade-offs of Starbucks Corporation and Yum! Brands, Inc., highlighting their financial strengths and vulnerabilities side by side:
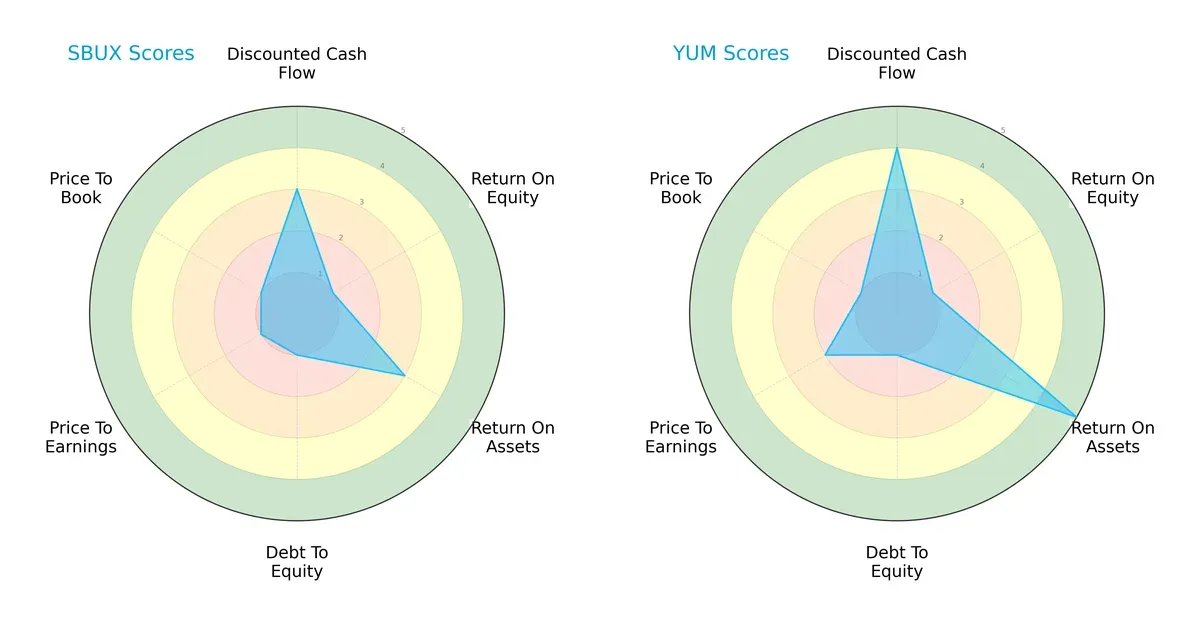
Yum! Brands leads in Discounted Cash Flow (4 vs. 3) and Return on Assets (5 vs. 3), signaling superior cash generation and asset efficiency. Both firms share weak Return on Equity (1) and Debt/Equity (1) scores, reflecting financial leverage concerns. Starbucks lags in valuation metrics (PE/PB at 1), while Yum! holds a slight edge with a moderate P/E score (2). Yum! presents a more balanced profile, leveraging operational efficiency over Starbucks’ reliance on limited valuation appeal.
Bankruptcy Risk: Solvency Showdown
Both Starbucks (2.74) and Yum! Brands (2.63) sit in the Altman Z-Score grey zone, indicating moderate bankruptcy risk amid current economic cycles:
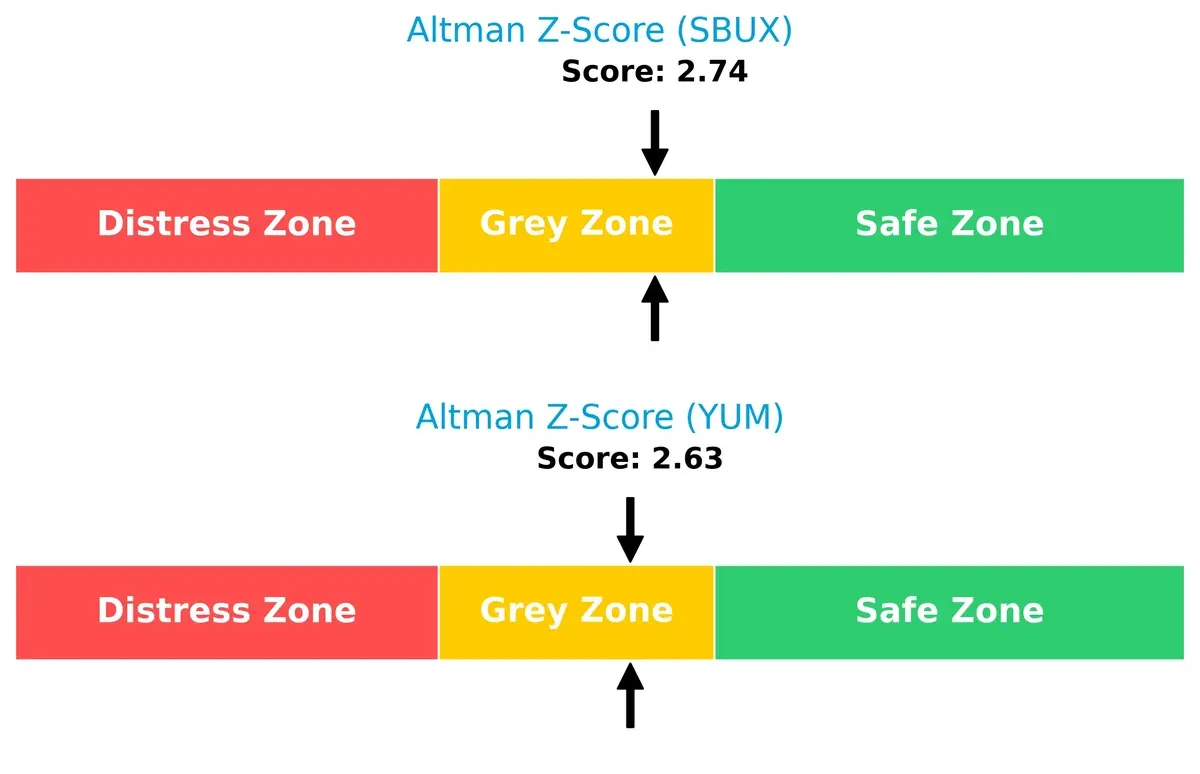
Their scores suggest neither firm is in immediate distress but warrant caution. Historically, companies in this range require vigilant capital management to navigate volatility without tipping into financial trouble.
Financial Health: Quality of Operations
Starbucks and Yum! Brands both earn a Piotroski F-Score of 5, indicating average financial health with room for improvement in operational quality and internal metrics:
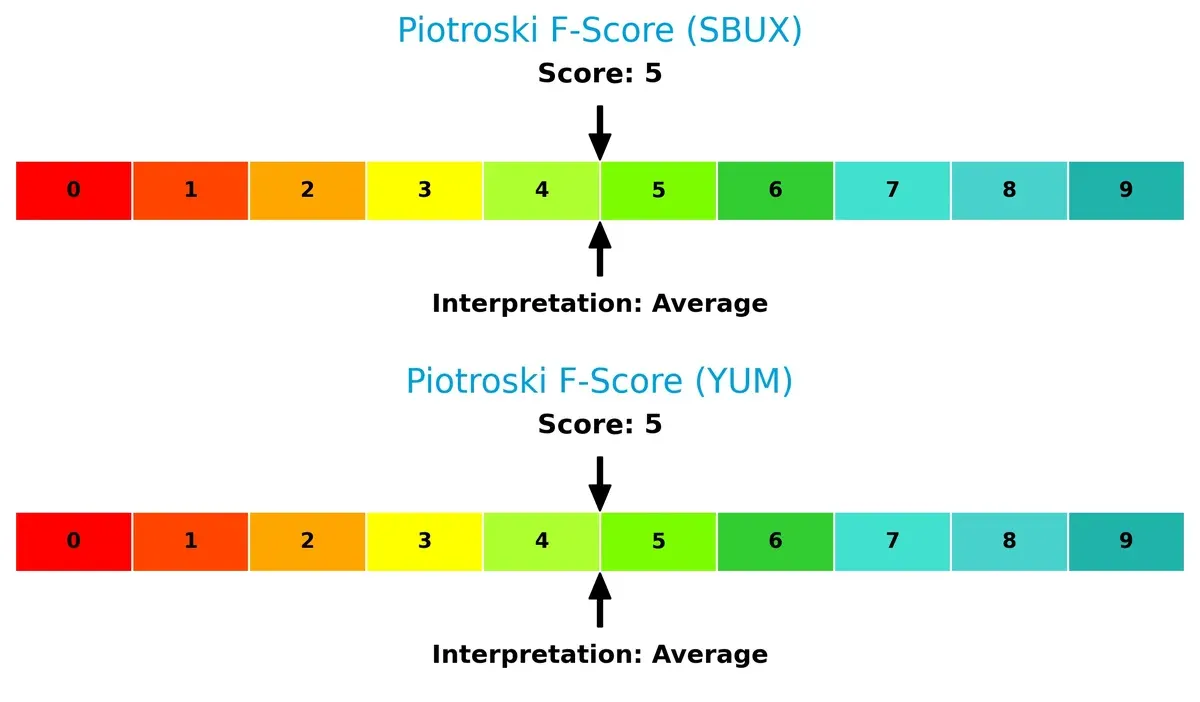
This parity signals neither company exhibits red flags in profitability, leverage, or liquidity. However, investors should monitor these middling scores closely, as stronger Piotroski results typically correlate with more resilient earnings and balance sheets.
How are the two companies positioned?
This section dissects Starbucks and Yum! Brands’ operational DNA by comparing their revenue distribution by segment and internal strengths and weaknesses. The goal is to confront their economic moats to determine which model offers the most resilient, sustainable competitive advantage today.
Revenue Segmentation: The Strategic Mix
The following visual comparison dissects how Starbucks Corporation and Yum! Brands, Inc. diversify their income streams and where their primary sector bets lie:
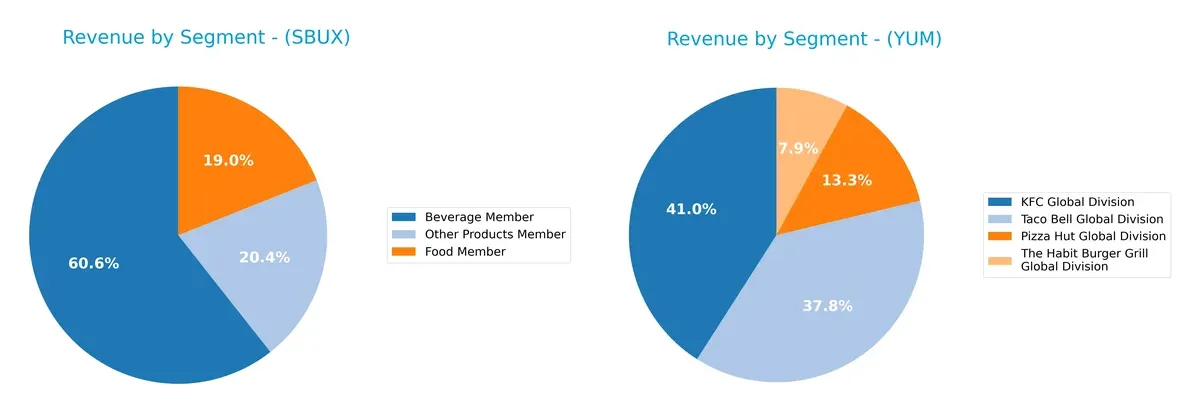
Starbucks anchors revenue heavily in its Beverage Member segment at $22.5B, with Food and Other Products contributing $7B and $7.6B, respectively, reflecting a moderately diversified portfolio. Yum! Brands, by contrast, pivots on KFC ($3.1B) and Taco Bell ($2.9B), with Pizza Hut and Habit Burger adding smaller but notable streams. Starbucks’ mix supports ecosystem lock-in in beverages, while Yum! faces concentration risk from reliance on few global divisions.
Strengths and Weaknesses Comparison
This table compares the strengths and weaknesses of Starbucks Corporation and Yum! Brands, Inc.:
Starbucks Corporation Strengths
- Diverse product segments including beverages, food, and other products
- Strong U.S. market presence with $27B revenue
- Favorable WACC of 7.2% supporting efficient capital cost
- Solid asset turnover at 1.16 indicating good asset use
- Favorable interest coverage at 6.81 times
- Dividend yield of 2.84% rewarding shareholders
Yum! Brands, Inc. Strengths
- Strong net margin at 18.98% indicating high profitability
- Diverse global brands like KFC, Pizza Hut, Taco Bell, and Habit Burger
- Favorable debt-to-assets ratio showing lower leverage risk
- Favorable debt-to-equity ratio supporting financial stability
- Positive PB ratio reflecting market valuation confidence
- Neutral interest coverage at 3.67 times maintaining debt service ability
Starbucks Corporation Weaknesses
- Negative ROE at -22.93% signaling shareholder value erosion
- High debt-to-assets at 83.11% increasing financial risk
- Low current and quick ratios below 1 indicating liquidity concerns
- Unfavorable net margin at 4.99% limiting profitability
- Elevated P/E of 52.58 suggesting overvaluation
- Negative debt-to-equity ratio reflecting possible data anomaly
Yum! Brands, Inc. Weaknesses
- Zero ROE and ROIC indicating poor returns on equity and invested capital
- Unavailable WACC limiting cost of capital assessment
- Unfavorable asset and fixed asset turnover ratios imply inefficient asset use
- Current and quick ratios at zero indicating liquidity issues or missing data
- Unfavorable P/E at 26.98 reflecting valuation concerns
- Dividend yield lower at 1.88% with neutral status
Overall, Starbucks shows strengths in diversified revenue streams and asset efficiency but struggles with profitability and liquidity. Yum! Brands delivers robust profitability and brand diversification but faces challenges in asset utilization and return metrics. Each company’s weaknesses highlight strategic areas requiring focused improvement.
The Moat Duel: Analyzing Competitive Defensibility
A structural moat is the only barrier protecting long-term profits from relentless competition and market disruption. Here’s how Starbucks and Yum! Brands compare:
Starbucks Corporation: Brand Power and Premium Experience
Starbucks leverages a strong brand moat fueled by high customer loyalty and premium pricing. Its slightly unfavorable declining ROIC signals margin pressure, but global expansion and new product innovation could fortify its moat in 2026.
Yum! Brands, Inc.: Franchise Scale and Global Reach
Yum! commands a vast franchise network, creating cost advantages and operational scale unmatched by Starbucks. Although ROIC data is unavailable, its favorable margin and revenue growth trends suggest a resilient moat with room for market expansion and menu innovation.
Moat Battle: Brand Loyalty vs. Franchise Scale
Starbucks’ brand loyalty offers a deep emotional connection but faces margin headwinds. Yum! benefits from a wider moat via scale and operational efficiency. I see Yum! better positioned to defend and grow market share in a competitive landscape.
Which stock offers better returns?
Over the past 12 months, Starbucks and Yum! Brands both show bullish trends with accelerating price growth, highlighted by notable highs and recent strong buyer dominance in trading volumes.
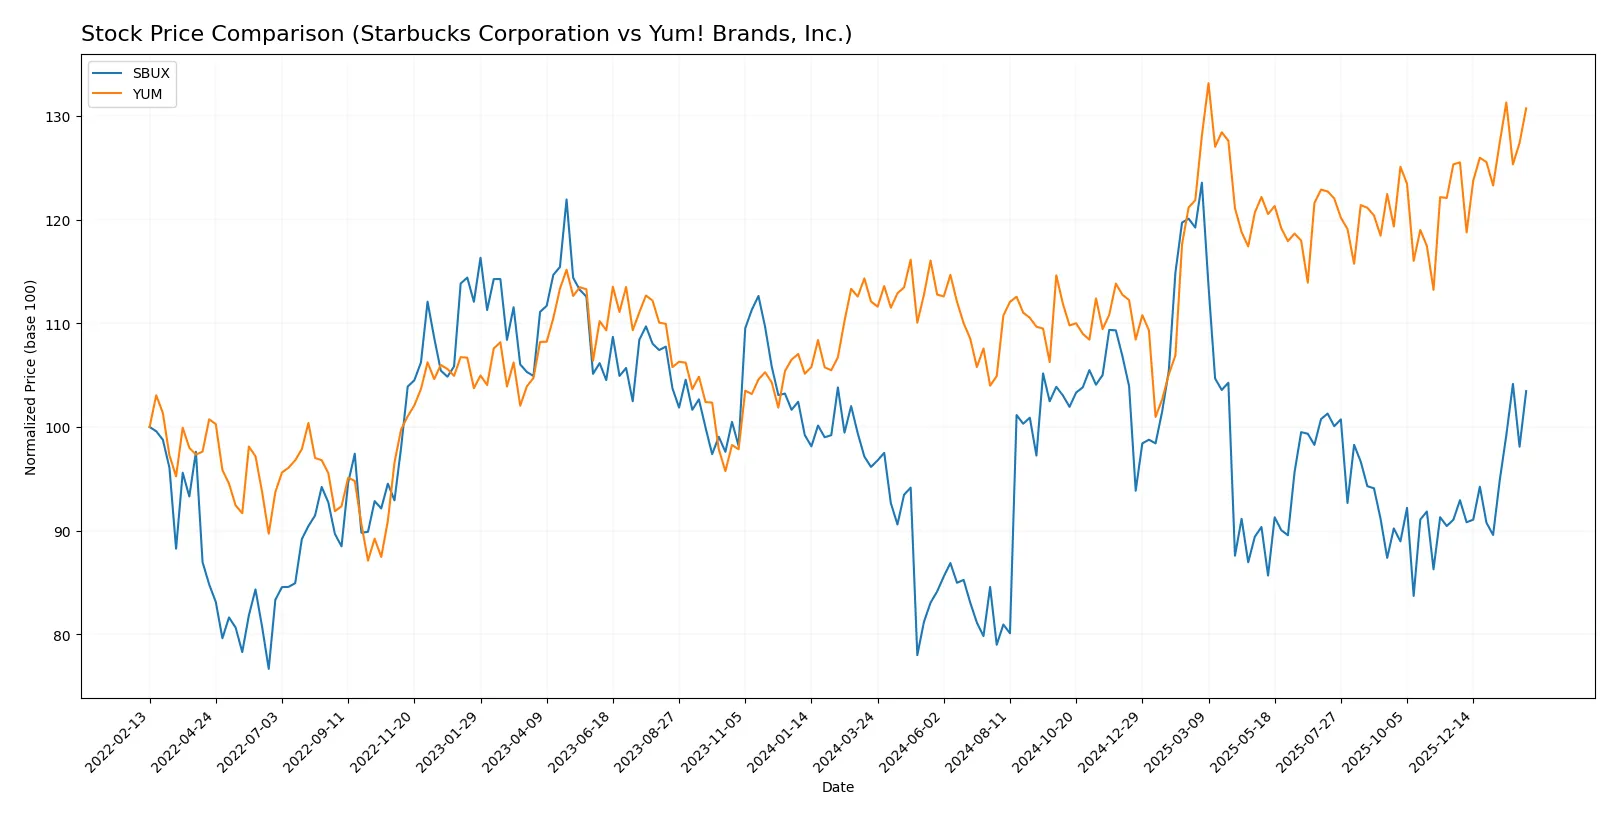
Trend Comparison
Starbucks’ stock rose 7.6% over the last year, showing acceleration and a peak at 115.81. Recent gains accelerated to 13.61% with buyer dominance rising sharply.
Yum! Brands’ stock increased 16.61% over the same period, also accelerating with a high of 162.53. Its recent 4.31% gain reflects continued but slower upward momentum.
Yum! Brands outperformed Starbucks overall, delivering the highest market return with a stronger yearly price increase despite Starbucks’ more rapid recent acceleration.
Target Prices
Analysts present mixed but constructive targets for Starbucks and Yum! Brands, reflecting cautious optimism.
| Company | Target Low | Target High | Consensus |
|---|---|---|---|
| Starbucks Corporation | 90 | 165 | 107.47 |
| Yum! Brands, Inc. | 158 | 180 | 171.45 |
Starbucks’ consensus target sits modestly above its current price of 97, suggesting limited upside. Yum! Brands shows a strong target premium over its 160 price, signaling robust analyst confidence.

Don’t Let Luck Decide Your Entry Point
Optimize your entry points with our advanced ProRealTime indicators. You’ll get efficient buy signals with precise price targets for maximum performance. Start outperforming now!
How do institutions grade them?
Starbucks Corporation Grades
Here are the recent grades assigned to Starbucks by major institutional firms:
| Grading Company | Action | New Grade | Date |
|---|---|---|---|
| Citigroup | Maintain | Neutral | 2026-02-02 |
| Barclays | Maintain | Overweight | 2026-01-30 |
| BTIG | Maintain | Buy | 2026-01-30 |
| Piper Sandler | Maintain | Overweight | 2026-01-30 |
| TD Cowen | Maintain | Hold | 2026-01-30 |
| BTIG | Maintain | Buy | 2026-01-29 |
| Wells Fargo | Maintain | Overweight | 2026-01-29 |
| RBC Capital | Maintain | Outperform | 2026-01-29 |
| Wells Fargo | Maintain | Overweight | 2026-01-27 |
| Mizuho | Maintain | Neutral | 2026-01-26 |
Yum! Brands, Inc. Grades
The table below shows Yum! Brands’ latest grades from respected grading companies:
| Grading Company | Action | New Grade | Date |
|---|---|---|---|
| Citigroup | Maintain | Neutral | 2026-01-22 |
| Morgan Stanley | Maintain | Equal Weight | 2026-01-20 |
| Gordon Haskett | Upgrade | Buy | 2026-01-08 |
| Barclays | Maintain | Overweight | 2026-01-07 |
| Oppenheimer | Downgrade | Perform | 2026-01-07 |
| TD Cowen | Upgrade | Buy | 2025-11-17 |
| Barclays | Maintain | Overweight | 2025-11-05 |
| Evercore ISI Group | Upgrade | Outperform | 2025-11-05 |
| Bernstein | Maintain | Market Perform | 2025-11-05 |
| TD Cowen | Maintain | Hold | 2025-11-05 |
Which company has the best grades?
Starbucks consistently earns high marks like Buy, Overweight, and Outperform. Yum! Brands shows more mixed signals with upgrades to Buy and Outperform but also downgrades to Perform. Starbucks’ steadier, stronger consensus may suggest greater institutional confidence. Investors should weigh these patterns when assessing market sentiment.
Risks specific to each company
The following categories identify critical pressure points and systemic threats facing Starbucks Corporation and Yum! Brands, Inc. in the 2026 market environment:
1. Market & Competition
Starbucks Corporation
- Faces intense premium coffee market competition; brand loyalty and store expansion remain key challenges.
Yum! Brands, Inc.
- Operates diverse quick-service brands; faces fierce global competition but benefits from franchise model scalability.
2. Capital Structure & Debt
Starbucks Corporation
- High debt-to-assets ratio at 83%; negative debt/equity signals complex leverage structure and financial risk.
Yum! Brands, Inc.
- Debt levels appear low or unreported; favorable debt-to-equity metrics suggest conservative leverage position.
3. Stock Volatility
Starbucks Corporation
- Beta of 0.94 indicates moderate market sensitivity; stock price range wide but stable volume supports liquidity.
Yum! Brands, Inc.
- Lower beta at 0.66 reflects less volatility; steady trading volume indicates stable investor interest.
4. Regulatory & Legal
Starbucks Corporation
- Subject to food safety, labor laws, and international trade regulations, with risks in diverse global markets.
Yum! Brands, Inc.
- Similar regulatory risks across multiple countries; franchise operations mitigate direct legal exposure somewhat.
5. Supply Chain & Operations
Starbucks Corporation
- Relies on specialty coffee sourcing; supply chain disruptions can affect product quality and availability.
Yum! Brands, Inc.
- Broad product lines require complex supply chains; operational efficiency critical across multiple brands.
6. ESG & Climate Transition
Starbucks Corporation
- Increasing pressure to improve sustainability in coffee sourcing and reduce carbon footprint.
Yum! Brands, Inc.
- ESG demands rising; franchise model may complicate consistent environmental and social governance practices.
7. Geopolitical Exposure
Starbucks Corporation
- Large international footprint exposes it to currency risks and geopolitical instability in key markets.
Yum! Brands, Inc.
- Extensive global presence with exposure to emerging markets; geopolitical tensions could impact growth.
Which company shows a better risk-adjusted profile?
Yum! Brands faces less financial leverage risk but struggles with operational complexity. Starbucks carries significant debt and margin pressures but shows stronger brand resilience. Both fall in Altman Z grey zones with average Piotroski scores. Starbucks’ high debt and weak profitability present a more concerning risk. Yum!’s diversified brand portfolio and conservative debt offer a comparatively better risk-adjusted profile.
Final Verdict: Which stock to choose?
Starbucks demonstrates a cash-generating engine with a strong operating return on assets, reflecting its operational muscle. However, its declining profitability and weak liquidity are points of vigilance. This name suits investors seeking aggressive growth exposure with tolerance for cyclical swings in profitability.
Yum! Brands boasts a strategic moat through its recurring revenue stream and efficient capital use, evident in its solid returns on assets and capital employed. It presents a comparatively safer profile with steadier margins, fitting well in a GARP portfolio aiming for balanced growth and reasonable valuation.
If you prioritize operational efficiency and cash flow resilience under competitive pressure, Starbucks is the compelling choice due to its unmatched scale and cash conversion. However, if you seek steadier income with a durable business model and margin stability, Yum! Brands offers better stability and a strategic moat, albeit with a more moderate growth trajectory.
Disclaimer: Investment carries a risk of loss of initial capital. The past performance is not a reliable indicator of future results. Be sure to understand risks before making an investment decision.
Go Further
I encourage you to read the complete analyses of Starbucks Corporation and Yum! Brands, Inc. to enhance your investment decisions: