Unilever PLC and Spectrum Brands Holdings, Inc. are two prominent players in the Household & Personal Products industry, each with a distinct portfolio and innovation approach. Unilever, a global giant, offers a broad range of consumer goods spanning beauty, food, and home care, while Spectrum Brands focuses on home and personal care, pet products, and garden solutions. This article will help you decide which company presents the most compelling investment opportunity in 2026.
Table of contents
Companies Overview
I will begin the comparison between Unilever PLC and Spectrum Brands Holdings, Inc. by providing an overview of these two companies and their main differences.
Unilever PLC Overview
Unilever PLC is a global fast-moving consumer goods company headquartered in London, UK. It operates through three main segments: Beauty & Personal Care, Foods & Refreshment, and Home Care. Unilever offers a wide range of well-known brands such as Dove, Ben & Jerry’s, and Knorr, positioning itself as a leader in household and personal products with a market cap of approximately 141B USD.
Spectrum Brands Holdings, Inc. Overview
Spectrum Brands Holdings, based in Middleton, Wisconsin, is a branded consumer products company operating globally. It focuses on three segments: Home and Personal Care, Global Pet Care, and Home and Garden. The company manages diverse brands including Black & Decker, 8IN1, and Cutter, with a market cap near 1.53B USD, serving various consumer needs across home appliances, pet care, and pest control.
Key similarities and differences
Both companies operate in the consumer defensive sector, focusing on household and personal products. Unilever has a broader global footprint and a significantly larger market capitalization, with diversified segments including foods and refreshments. In contrast, Spectrum Brands has a narrower focus on home care, pet care, and garden products, with a smaller workforce and market cap, reflecting different scales and market penetration strategies.
Income Statement Comparison
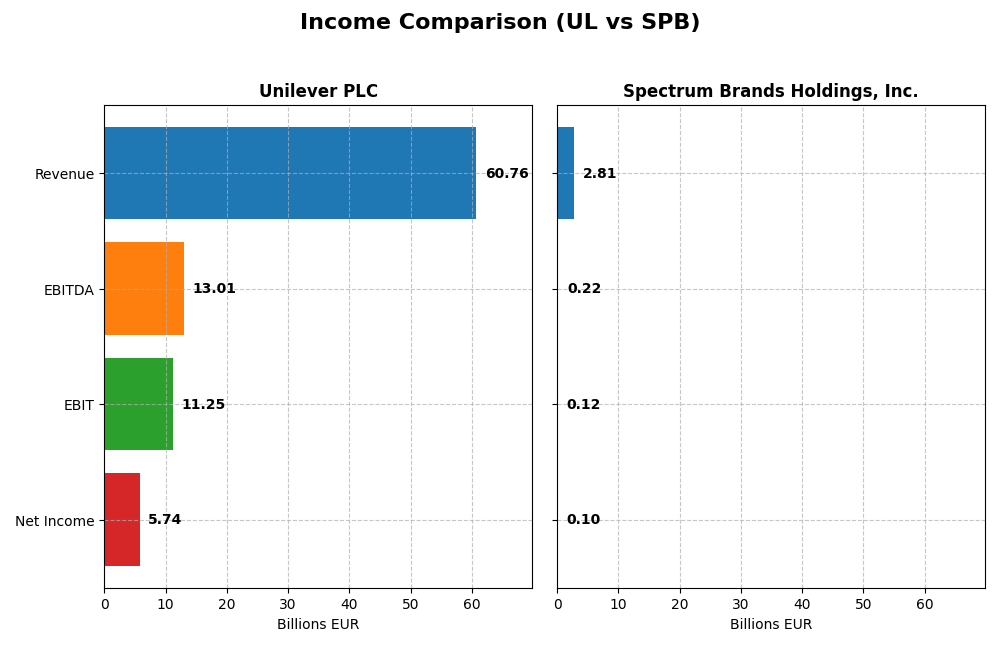
This table presents a side-by-side comparison of key income statement metrics for Unilever PLC and Spectrum Brands Holdings, Inc. using their most recent fiscal year data.
| Metric | Unilever PLC (2024) | Spectrum Brands Holdings, Inc. (2025) |
|---|---|---|
| Market Cap | 140.6B EUR | 1.53B USD |
| Revenue | 60.8B EUR | 2.81B USD |
| EBITDA | 13.0B EUR | 215.2M USD |
| EBIT | 11.3B EUR | 117.2M USD |
| Net Income | 5.74B EUR | 99.9M USD |
| EPS | 2.30 EUR | 3.88 USD |
| Fiscal Year | 2024 | 2025 |
Income Statement Interpretations
Unilever PLC
Unilever’s revenue shows a favorable overall growth of 19.79% from 2020 to 2024, with a 1.94% increase in 2024. Net income growth over the period is modest at 2.92%, yet net margin declined by 14.08%. The 2024 net income fell by 13.14%, with EPS down 10.55%, despite improvements in gross profit and EBIT margins, indicating some margin pressure and slower bottom-line growth.
Spectrum Brands Holdings, Inc.
Spectrum Brands experienced an overall revenue decline of 6.31% from 2021 to 2025, with a 5.23% drop in 2025. Net income fell sharply by 47.31%, with net margin and EPS also decreasing significantly. The 2025 results showed lower gross profit and EBIT, with net margin at 3.56%, reflecting an unfavorable trend in profitability and operational efficiency over the recent year and the overall period.
Which one has the stronger fundamentals?
Unilever presents stronger fundamentals with favorable gross and EBIT margins, positive revenue growth, and a generally favorable income statement evaluation. Spectrum Brands faces multiple unfavorable indicators, including declining revenues, margins, and net income. Despite Unilever’s recent margin pressures, its overall positive growth and profitability metrics contrast with Spectrum’s unfavorable income trends, highlighting a clearer fundamental strength in Unilever’s financials.
Financial Ratios Comparison
The table below presents the most recent financial ratios for Unilever PLC and Spectrum Brands Holdings, Inc., offering a snapshot of their profitability, liquidity, leverage, and valuation as of fiscal year-end 2024 and latest available data.
| Ratios | Unilever PLC (UL) | Spectrum Brands Holdings, Inc. (SPB) |
|---|---|---|
| ROE | 28.7% | 5.2% |
| ROIC | 11.1% | 4.9% |
| P/E | 23.9 | 13.5 |
| P/B | 6.87 | 0.71 |
| Current Ratio | 0.76 | 2.26 |
| Quick Ratio | 0.56 | 1.41 |
| D/E (Debt-to-Equity) | 1.53 | 0.34 |
| Debt-to-Assets | 38.4% | 19.4% |
| Interest Coverage | 8.41 | 4.16 |
| Asset Turnover | 0.76 | 0.83 |
| Fixed Asset Turnover | 5.21 | 8.55 |
| Payout Ratio | 75.2% | 48.2% |
| Dividend Yield | 3.14% | 3.57% |
Interpretation of the Ratios
Unilever PLC
Unilever’s ratios present a mixed picture with strengths in return on equity (28.73%) and return on invested capital (11.12%), both favorable, while liquidity ratios like current ratio (0.76) and quick ratio (0.56) are unfavorable. The company maintains a dividend yield of 3.14%, supported by positive free cash flow coverage, suggesting consistent shareholder returns without immediate payout risks.
Spectrum Brands Holdings, Inc.
Spectrum Brands shows mostly favorable liquidity and valuation ratios, including a strong current ratio (2.26) and price-to-book of 0.71, but weaker profitability with a low net margin of 3.56% and return on equity of 5.23%. Its dividend yield stands at 3.57%, with stable payout supported by free cash flow, indicating reasonable shareholder returns amid modest earnings performance.
Which one has the best ratios?
Spectrum Brands demonstrates a higher proportion of favorable ratios (64.29%) compared to Unilever’s 42.86%, reflecting stronger liquidity and valuation metrics. However, Unilever’s profitability and return metrics are notably better. The choice depends on weighing Spectrum’s financial stability against Unilever’s superior returns and dividend history.
Strategic Positioning
This section compares the strategic positioning of Unilever PLC and Spectrum Brands Holdings, Inc. regarding Market position, Key segments, and exposure to disruption:
Unilever PLC
- Large market cap of 140B USD with low beta 0.22, indicating stable competitive pressure.
- Operates diversified segments: Beauty & Personal Care, Foods & Refreshment, and Home Care.
- No explicit data on technological disruption exposure provided.
Spectrum Brands Holdings, Inc.
- Smaller market cap around 1.53B USD with higher beta 0.68, suggesting more volatility.
- Focuses on three segments: Home & Personal Care, Global Pet Care, and Home & Garden.
- No explicit data on technological disruption exposure provided.
Unilever PLC vs Spectrum Brands Holdings, Inc. Positioning
Unilever’s diversified business across multiple consumer product categories contrasts with Spectrum’s more concentrated focus on pet care and home-related products. Unilever benefits from scale and broad market presence, while Spectrum shows specialization but with smaller scale.
Which has the best competitive advantage?
Unilever shows a slightly favorable moat with value creation despite declining profitability, whereas Spectrum is slightly unfavorable, shedding value but improving profitability, indicating Unilever currently holds a stronger competitive advantage.
Stock Comparison
The stock price movements over the past 12 months reveal contrasting trends for Unilever PLC and Spectrum Brands Holdings, Inc., with notable shifts in momentum and trading volumes impacting their market dynamics.
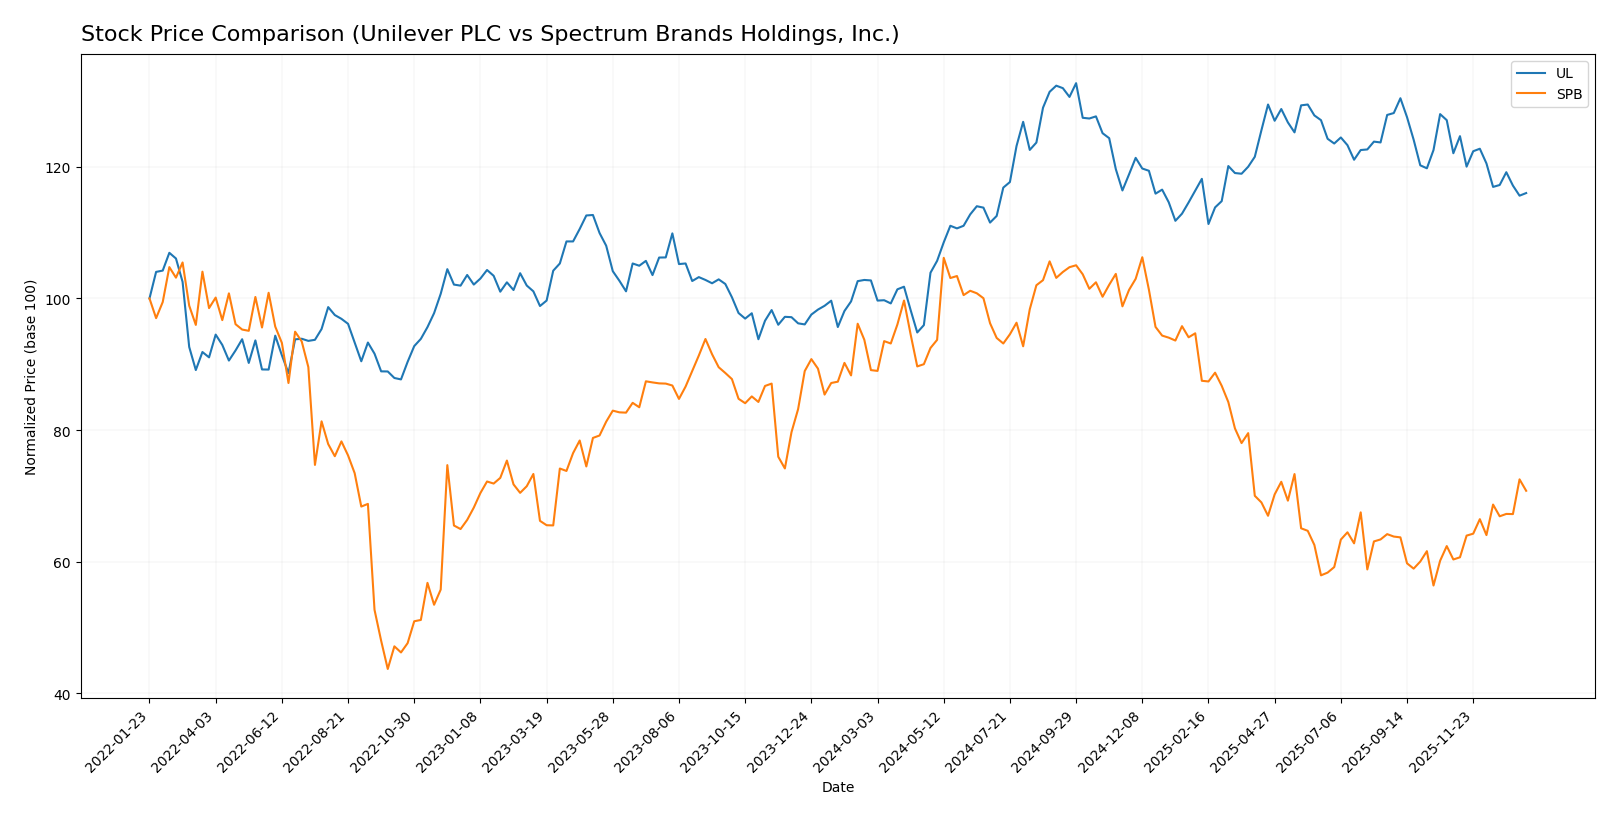
Trend Analysis
Unilever PLC’s stock showed a bullish trend over the past year with a 12.92% increase, despite deceleration and moderate volatility. The price ranged from 52.66 to 73.69, with a recent slight downward trend of -4.96%.
Spectrum Brands Holdings, Inc. experienced a bearish trend over the same period, declining by 20.57% with accelerating losses and high volatility. However, recent data shows a strong rebound with a 17.3% gain and growing buyer dominance.
Comparing both, Unilever delivered the highest overall market performance in the last 12 months despite recent weakness, while Spectrum Brands showed recent recovery after a significant annual decline.
Target Prices
The consensus target prices for Unilever PLC and Spectrum Brands Holdings, Inc. reflect moderate upside potential based on current valuations.
| Company | Target High | Target Low | Consensus |
|---|---|---|---|
| Unilever PLC | 71 | 60.1 | 65.55 |
| Spectrum Brands Holdings, Inc. | 75 | 75 | 75 |
Analysts expect Unilever’s price to hover slightly above the current 64.42 USD, indicating modest growth potential. Spectrum Brands shows a stable consensus target well above its current 63.2 USD price, suggesting room for appreciation.
Analyst Opinions Comparison
This section compares analysts’ ratings and grades for Unilever PLC and Spectrum Brands Holdings, Inc.:
Rating Comparison
UL Rating
- Rating: B+ indicating a very favorable overall assessment.
- Discounted Cash Flow Score: 5, showing very favorable future cash flow projections.
- ROE Score: 5, indicating very favorable efficiency in generating profit from shareholders’ equity.
- ROA Score: 4, favorable asset utilization to generate earnings.
- Debt To Equity Score: 1, very unfavorable due to higher financial risk from debt levels.
- Overall Score: 3, moderate overall financial standing.
SPB Rating
- Rating: B reflecting a very favorable overall assessment.
- Discounted Cash Flow Score: 1, indicating very unfavorable future cash flow projections.
- ROE Score: 2, showing moderate efficiency in generating profit from shareholders’ equity.
- ROA Score: 3, moderate asset utilization to generate earnings.
- Debt To Equity Score: 3, moderate financial risk with balanced debt to equity.
- Overall Score: 3, moderate overall financial standing.
Which one is the best rated?
Based on the provided ratings and scores, Unilever PLC holds stronger scores in discounted cash flow and return on equity, while Spectrum Brands shows a better debt-to-equity score. Overall, both have the same moderate overall score of 3.
Scores Comparison
The scores comparison between Unilever PLC and Spectrum Brands Holdings, Inc. is as follows:
UL Scores
- Altman Z-Score: 4.85, indicating a safe financial zone with low bankruptcy risk.
- Piotroski Score: 6, reflecting average financial strength.
SPB Scores
- Altman Z-Score: 1.77, placing the company in the distress zone with high bankruptcy risk.
- Piotroski Score: 6, reflecting average financial strength.
Which company has the best scores?
Based on the data, Unilever PLC has a significantly higher Altman Z-Score indicating stronger financial stability. Both companies share the same average Piotroski Score. Overall, Unilever shows better scores in terms of bankruptcy risk.
Grades Comparison
Here is a detailed comparison of the grades assigned to Unilever PLC and Spectrum Brands Holdings, Inc.:
Unilever PLC Grades
The following table presents recent grades from reputable grading companies for Unilever PLC:
| Grading Company | Action | New Grade | Date |
|---|---|---|---|
| Erste Group | Downgrade | Hold | 2024-11-19 |
| B of A Securities | Upgrade | Buy | 2024-08-22 |
| JP Morgan | Upgrade | Overweight | 2024-05-23 |
| Argus Research | Maintain | Buy | 2024-05-08 |
| Morgan Stanley | Downgrade | Underweight | 2024-02-27 |
| Bernstein | Upgrade | Market Perform | 2022-03-14 |
| Bernstein | Upgrade | Market Perform | 2022-03-13 |
| Bernstein | Upgrade | Market Perform | 2021-11-01 |
| Bernstein | Upgrade | Market Perform | 2021-10-31 |
| Deutsche Bank | Downgrade | Hold | 2021-09-16 |
Unilever’s grades show a mixed trend with several upgrades from underperforming to market perform or buy levels, but also some recent downgrades to hold and underweight ratings.
Spectrum Brands Holdings, Inc. Grades
The following table presents recent grades from reputable grading companies for Spectrum Brands Holdings, Inc.:
| Grading Company | Action | New Grade | Date |
|---|---|---|---|
| Canaccord Genuity | Maintain | Buy | 2025-11-17 |
| Wells Fargo | Maintain | Equal Weight | 2025-11-14 |
| Wells Fargo | Maintain | Equal Weight | 2025-09-25 |
| Canaccord Genuity | Maintain | Buy | 2025-08-08 |
| Wells Fargo | Maintain | Equal Weight | 2025-07-09 |
| Canaccord Genuity | Maintain | Buy | 2025-06-25 |
| UBS | Maintain | Buy | 2025-05-09 |
| UBS | Maintain | Buy | 2025-04-17 |
| Wells Fargo | Maintain | Equal Weight | 2025-04-16 |
| Wells Fargo | Maintain | Equal Weight | 2025-04-02 |
Spectrum Brands shows stable and consistent grades, primarily maintaining a buy or equal weight consensus without recent downgrades or upgrades.
Which company has the best grades?
Spectrum Brands Holdings, Inc. has received more consistent buy and equal weight grades, while Unilever PLC’s grades are more mixed with recent downgrades and upgrades. This difference may influence investors’ perception of relative risk and potential return.
Strengths and Weaknesses
Below is a comparison of key strengths and weaknesses for Unilever PLC (UL) and Spectrum Brands Holdings, Inc. (SPB) based on their recent financial and strategic data.
| Criterion | Unilever PLC (UL) | Spectrum Brands Holdings, Inc. (SPB) |
|---|---|---|
| Diversification | Broad global portfolio in consumer goods, steady revenue streams | Diversified in pet supplies, home & personal care, and garden segments; moderate concentration in pet supplies |
| Profitability | ROIC 11.12%, ROE 28.73%, net margin 9.45% — generally favorable | ROIC 4.95%, ROE 5.23%, net margin 3.56% — relatively low profitability |
| Innovation | Established R&D, strong brand equity but declining ROIC trend | Improving ROIC trend, indicating growing operational efficiency and innovation potential |
| Global presence | Strong global footprint with well-known brands worldwide | Primarily US-focused with some global reach, especially in pet supplies |
| Market Share | Large and stable market share in multiple consumer categories | Growing market share in pet supplies, smaller in other segments |
Key takeaways: Unilever offers strong profitability and global diversification but faces challenges with a declining ROIC trend. Spectrum Brands shows improving profitability and efficiency but currently has lower margins and a narrower global presence. Investors should weigh stability versus growth potential and consider risk tolerance accordingly.
Risk Analysis
Below is a comparative table summarizing key risks for Unilever PLC and Spectrum Brands Holdings, Inc. based on the most recent financial data and market context.
| Metric | Unilever PLC (UL) | Spectrum Brands Holdings (SPB) |
|---|---|---|
| Market Risk | Low beta (0.223) indicates low volatility | Moderate beta (0.681) shows moderate volatility |
| Debt level | High debt-to-equity (1.53, unfavorable) | Low debt-to-equity (0.34, favorable) |
| Regulatory Risk | Moderate; global operations subject to diverse regulations | Moderate; US-centric but with product safety concerns |
| Operational Risk | Large workforce (116K) and global supply chains increase complexity | Smaller scale (3.1K employees), less complex operations |
| Environmental Risk | High focus on sustainability but exposed to consumer scrutiny | Moderate; some exposure via product chemicals and packaging |
| Geopolitical Risk | High due to global footprint, currency, and trade tensions | Moderate, mainly US market exposure |
In synthesis, Unilever’s most significant risks stem from its high leverage and extensive geopolitical exposure, despite strong operational scale and sustainability initiatives. Spectrum Brands faces lower financial risk but contends with moderate market volatility and operational challenges. Investors should weigh Unilever’s debt burden against its stable cash flows, while Spectrum’s distress-level bankruptcy risk signals caution despite favorable liquidity ratios.
Which Stock to Choose?
Unilever PLC (UL) shows a favorable income statement with solid profitability, including a 9.45% net margin and strong returns on equity (28.73%) and invested capital (11.12%). Despite a slightly declining ROIC trend, the company creates value with a very favorable B+ rating but faces some liquidity and leverage challenges.
Spectrum Brands Holdings, Inc. (SPB) presents an unfavorable income evolution marked by declining revenues and net income, with lower profitability ratios such as a 3.56% net margin and modest return on equity (5.23%). The company has a favorable overall rating of B, supported by strong liquidity ratios and moderate debt, but it is currently shedding value.
For investors with a preference for stable value creation and strong profitability, Unilever may appear more favorable given its value-creating moat and higher financial scores. Conversely, risk-tolerant investors seeking potential turnaround opportunities might see Spectrum Brands’ improving ROIC trend and liquidity as encouraging signals, despite current challenges.
Disclaimer: Investment carries a risk of loss of initial capital. The past performance is not a reliable indicator of future results. Be sure to understand risks before making an investment decision.
Go Further
I encourage you to read the complete analyses of Unilever PLC and Spectrum Brands Holdings, Inc. to enhance your investment decisions: