Home > Comparison > Consumer Defensive > PG vs SPB
The strategic rivalry between The Procter & Gamble Company and Spectrum Brands Holdings defines the current trajectory of the Consumer Defensive sector. P&G operates as a capital-intensive household & personal products powerhouse with a broad global footprint. Spectrum Brands, a smaller branded consumer products company, focuses on niche segments like pet care and home appliances. This analysis aims to identify which business model delivers superior risk-adjusted returns for diversified portfolios amid evolving market dynamics.
Table of contents
Companies Overview
The Procter & Gamble Company and Spectrum Brands Holdings, Inc. shape the global consumer products landscape with distinct scale and reach.
The Procter & Gamble Company: Global Consumer Goods Powerhouse
The Procter & Gamble Company commands a leading position in household and personal products worldwide. It generates revenue through five diverse segments, including Beauty and Health Care, leveraging iconic brands like Gillette and Tide. In 2026, the company prioritizes innovation and expanding e-commerce channels to solidify its global footprint and sustain steady cash flow.
Spectrum Brands Holdings, Inc.: Specialty Consumer Products Player
Spectrum Brands Holdings focuses on branded consumer products across Home and Personal Care, Global Pet Care, and Home and Garden segments. It monetizes a broad portfolio including Black & Decker appliances and Tetra aquatics equipment. The company’s 2026 strategy centers on niche market growth and strengthening retail partnerships to enhance its competitive edge despite a smaller market cap.
Strategic Collision: Similarities & Divergences
Both firms operate in the consumer defensive sector, but P&G pursues a mass-market, diversified portfolio approach, while Spectrum targets specialty niches with focused brands. Their primary battleground is retail shelf space and e-commerce penetration. Investors face contrasting profiles: P&G offers scale-driven stability; Spectrum reflects agility with concentrated market bets.
Income Statement Comparison
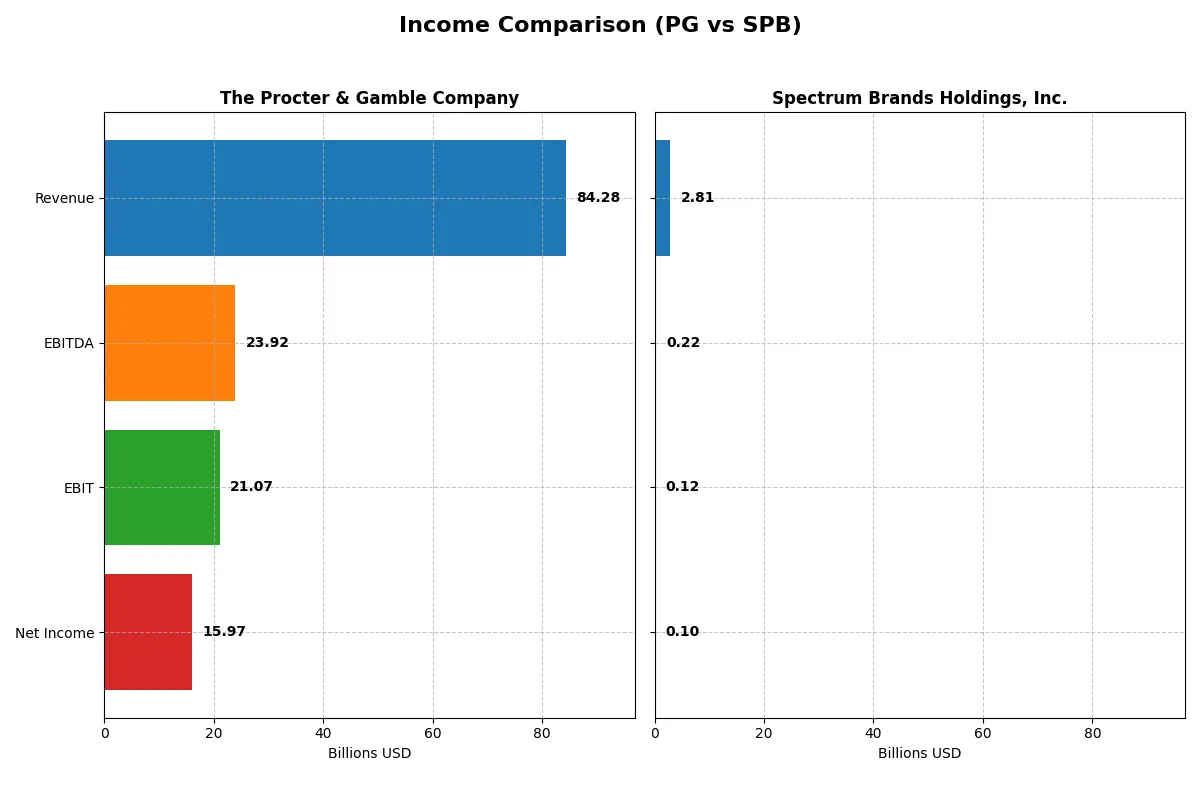
This data dissects the core profitability and scalability of both corporate engines to reveal who dominates the bottom line:
| Metric | The Procter & Gamble Company (PG) | Spectrum Brands Holdings, Inc. (SPB) |
|---|---|---|
| Revenue | 84.3B | 2.81B |
| Cost of Revenue | 41.2B | 1.78B |
| Operating Expenses | 22.7B | 907M |
| Gross Profit | 43.1B | 1.03B |
| EBITDA | 23.9B | 215M |
| EBIT | 21.1B | 117M |
| Interest Expense | 907M | 30M |
| Net Income | 15.97B | 100M |
| EPS | 6.67 | 3.88 |
| Fiscal Year | 2025 | 2025 |
Income Statement Analysis: The Bottom-Line Duel
The income statement comparison reveals which company runs a more efficient and profitable corporate engine, spotlighting fundamental strengths and weaknesses.
The Procter & Gamble Company Analysis
P&G’s revenue grew modestly to 84.3B in 2025, up 0.3% from 2024, while net income rose 7.4% to 16B, showing solid profit momentum. Its gross margin sustains a strong 51.2%, with a net margin near 19%, reflecting robust cost control and operational efficiency. The company’s EBIT margin expanded to 25%, indicating improved core profitability.
Spectrum Brands Holdings, Inc. Analysis
Spectrum’s revenue declined 5.2% to 2.81B in 2025, dragging gross profit down nearly 7% to 1.03B. Net income contracted sharply by 20% to just under 100M, with a thin net margin of 3.6%. EBIT margin remained weak at 4.2%, highlighting ongoing challenges in scaling profitability and controlling expenses.
Margin Power vs. Revenue Scale
P&G clearly outperforms with its superior margins and steady income growth, while Spectrum struggles with shrinking revenue and deteriorating profitability. P&G’s profile suits investors seeking reliable earnings expansion and operational resilience. Spectrum’s profile signals caution due to weak margins and declining returns.
Financial Ratios Comparison
These vital ratios act as a diagnostic tool to expose the underlying fiscal health, valuation premiums, and capital efficiency across these firms:
| Ratios | The Procter & Gamble Company (PG) | Spectrum Brands Holdings, Inc. (SPB) |
|---|---|---|
| ROE | 30.7% | 5.2% |
| ROIC | 16.5% | 4.3% |
| P/E | 24.5x | 13.5x |
| P/B | 7.52x | 0.71x |
| Current Ratio | 0.70 | 2.26 |
| Quick Ratio | 0.49 | 1.41 |
| D/E (Debt to Equity) | 0.68 | 0.34 |
| Debt-to-Assets | 28.3% | 19.4% |
| Interest Coverage | 22.5x | 4.16x |
| Asset Turnover | 0.67 | 0.83 |
| Fixed Asset Turnover | 3.53 | 8.55 |
| Payout Ratio | 61.8% | 48.2% |
| Dividend Yield | 2.52% | 3.57% |
| Fiscal Year | 2025 | 2025 |
Efficiency & Valuation Duel: The Vital Signs
Financial ratios serve as a company’s DNA, exposing hidden risks and unveiling operational excellence beneath surface metrics.
The Procter & Gamble Company
P&G delivers strong profitability with a 30.7% ROE and a healthy 18.95% net margin. Its P/E ratio of 24.5 suggests a fairly valued stock, though a high P/B ratio of 7.5 signals some valuation stretch. The firm returns value via a 2.52% dividend yield, reflecting steady shareholder income.
Spectrum Brands Holdings, Inc.
Spectrum Brands shows weaker profitability with a 5.2% ROE and a slim 3.6% net margin. Its valuation appears attractive, with a P/E of 13.5 and a low P/B of 0.71. The company supports shareholders through a 3.57% dividend yield, despite operational challenges and modest returns on capital.
Robust Profitability Meets Valuation Discipline
P&G excels in profitability and shareholder returns but carries valuation premium risks. Spectrum Brands offers a cheaper entry with higher dividend yield but weaker operational metrics. Investors favoring stability may lean toward P&G, while those seeking value with income might consider Spectrum Brands.
Which one offers the Superior Shareholder Reward?
I compare Procter & Gamble (PG) and Spectrum Brands (SPB) on dividends, payout ratios, and buybacks. PG yields ~2.5% with a 62% payout, well-covered by 79% FCF, reflecting steady income. SPB offers a higher 3.57% yield but a lower 48% payout, backed by less consistent cash flow. PG’s buyback intensity is moderate, supporting sustainable returns. SPB’s volatile margins and weaker buyback coverage raise concerns. I find PG’s disciplined distribution and robust free cash flow more sustainable. In 2026, PG delivers a superior total shareholder reward through balanced dividends and reliable capital allocation.
Comparative Score Analysis: The Strategic Profile
The radar chart reveals the fundamental DNA and trade-offs of The Procter & Gamble Company and Spectrum Brands Holdings, Inc.:
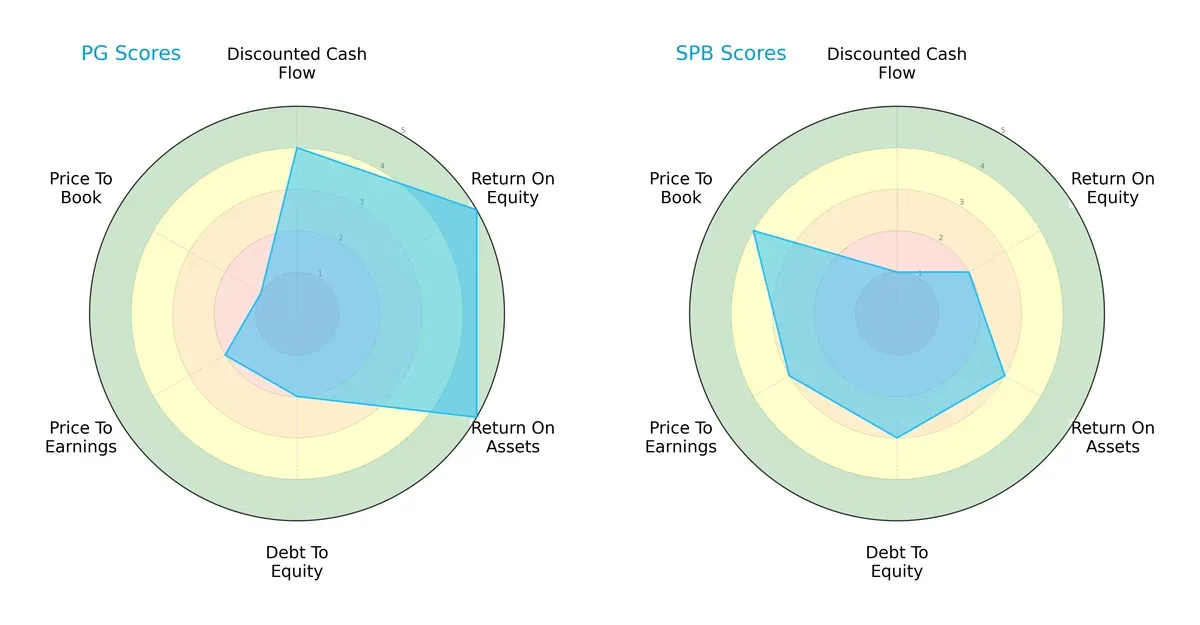
Procter & Gamble boasts superior operational efficiency with higher ROE (5) and ROA (5) scores, indicating strong profit generation and asset use. Spectrum Brands lags in DCF (1) and ROE (2), signaling weaker cash flow and equity returns. However, Spectrum shows a more balanced valuation profile, scoring better in P/E (3) and P/B (4), while Procter & Gamble’s valuation scores are notably weaker, especially P/B (1). Procter & Gamble’s edge is operational excellence; Spectrum relies more on valuation appeal.
Bankruptcy Risk: Solvency Showdown
The Procter & Gamble’s Altman Z-Score of 5.55 versus Spectrum Brands’ 1.79 signals a stark difference in financial stability:
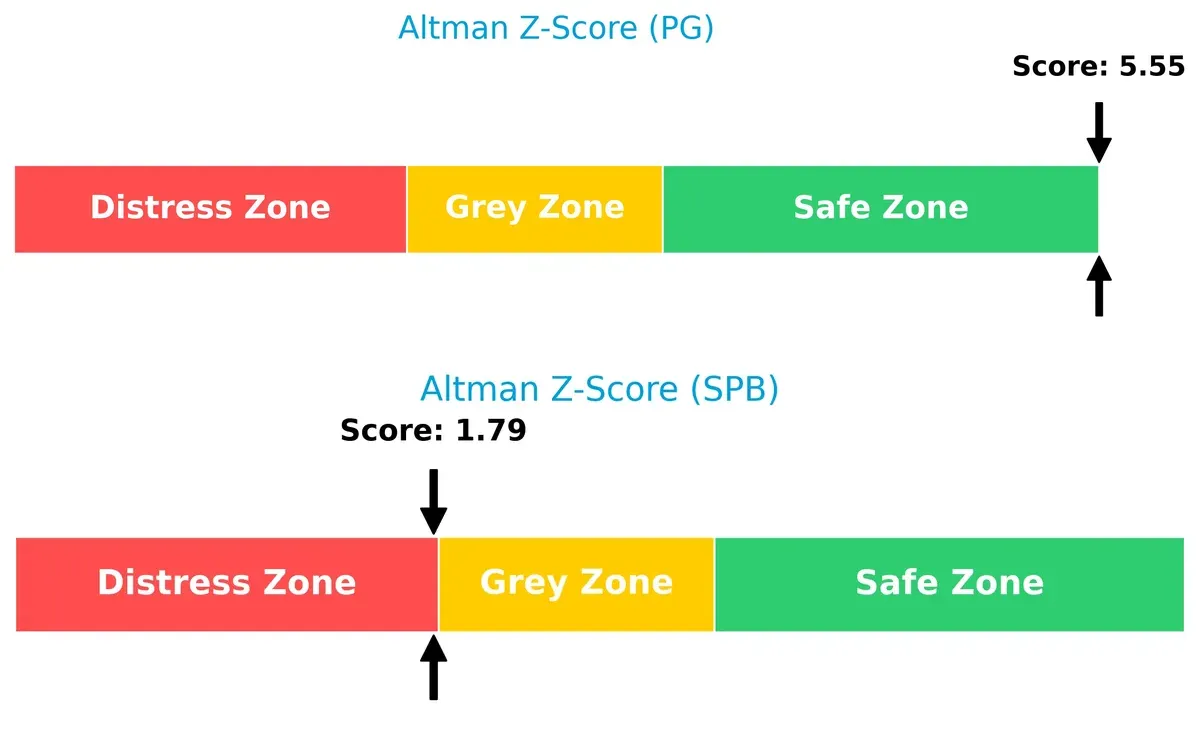
Procter & Gamble sits comfortably in the safe zone, demonstrating robust resilience against bankruptcy risks. Spectrum Brands teeters in the distress zone, highlighting elevated bankruptcy risk in the current economic cycle. This gap underscores Procter & Gamble’s stronger balance sheet and risk management.
Financial Health: Quality of Operations
Piotroski F-Scores reveal operational quality differences between the two firms:
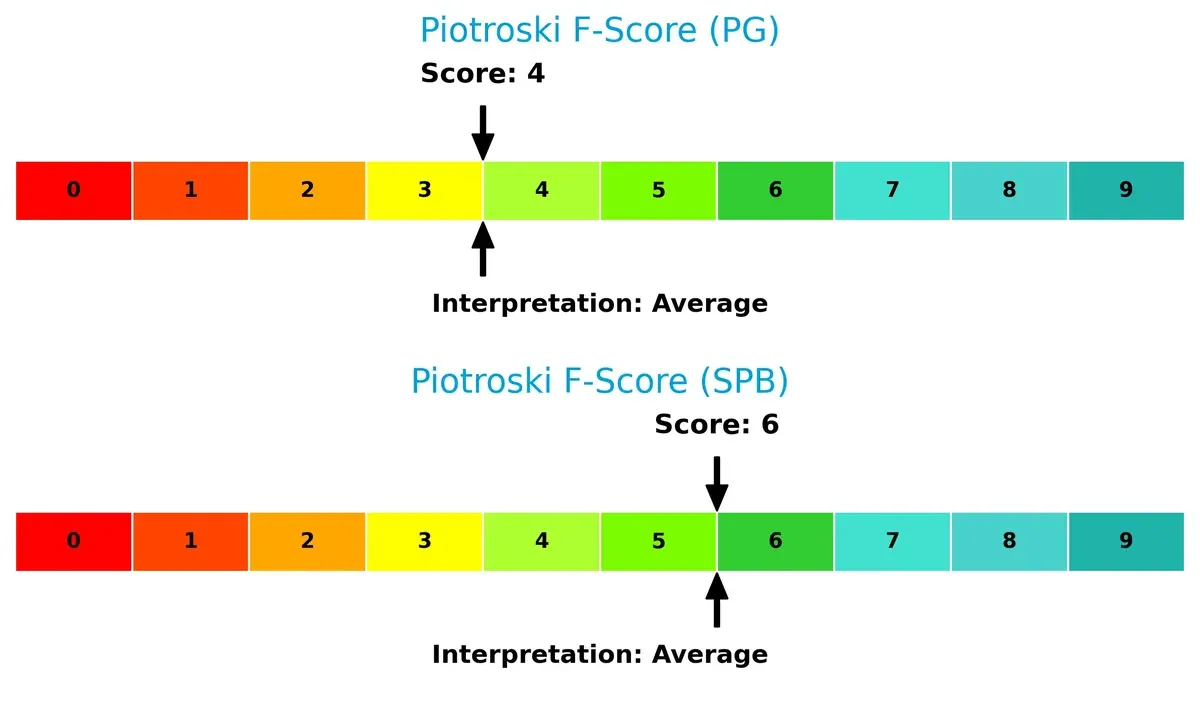
Spectrum Brands scores a 6, above Procter & Gamble’s 4, suggesting better recent improvements in profitability, leverage, and liquidity. Despite Procter & Gamble’s superior market metrics, Spectrum shows healthier internal financial signals. Procter & Gamble’s lower score warns of potential red flags in operational efficiency or financial quality relative to Spectrum.
How are the two companies positioned?
This section dissects the operational DNA of PG and SPB by comparing their revenue distribution and internal strengths and weaknesses. The final objective is to confront their economic moats to identify which business model offers the most resilient competitive advantage in today’s market.
Revenue Segmentation: The Strategic Mix
This visual comparison dissects how The Procter & Gamble Company and Spectrum Brands Holdings diversify income streams and reveals their primary sector bets:
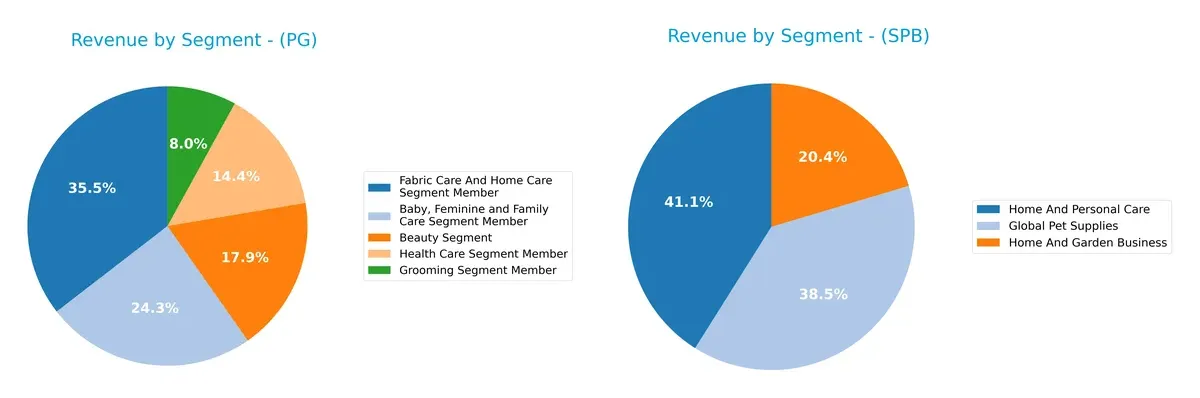
Procter & Gamble anchors revenue in Fabric Care and Home Care with $29.6B, supported by Baby, Feminine & Family Care at $20.2B and Beauty at $14.9B. This mix shows a broad product moat reducing concentration risk. Spectrum Brands pivots between Home & Personal Care ($1.15B), Global Pet Supplies ($1.08B), and Home & Garden ($573M), indicating less scale but more even spread. P&G’s dominance in essentials offers stronger ecosystem lock-in, while SPB’s diversification may dilute growth focus.
Strengths and Weaknesses Comparison
This table compares the Strengths and Weaknesses of The Procter & Gamble Company (PG) and Spectrum Brands Holdings, Inc. (SPB):
PG Strengths
- Diversified product segments across Baby, Beauty, Fabric Care, Grooming, and Health Care
- Robust profitability with 18.95% net margin and 30.71% ROE
- Strong global presence with nearly equal US and Non-US revenues
- Favorable capital efficiency shown by 16.47% ROIC vs. 5.41% WACC
- High fixed asset turnover indicates efficient asset use
- Stable dividend yield at 2.52%
SPB Strengths
- Favorable valuation with P/E at 13.51 and P/B at 0.71
- Solid liquidity ratios: current ratio 2.26, quick ratio 1.41
- Low leverage with D/E at 0.34 and 19.36% debt to assets
- Favorable dividend yield at 3.57%
- Efficient asset use with 8.55 fixed asset turnover
- Diversified geographic presence with US and international revenues
PG Weaknesses
- Low liquidity ratios: current ratio 0.7 and quick ratio 0.49 indicate potential short-term risk
- High P/B ratio at 7.52 suggests possible overvaluation
- Moderate debt level with D/E at 0.68 and some neutral leverage metrics
- Neutral asset turnover of 0.67 limits operational efficiency insights
- Neutral interest coverage ratio despite overall favorable leverage
SPB Weaknesses
- Weak profitability with 3.56% net margin and 5.23% ROE
- Low ROIC at 4.31% barely exceeds WACC, implying weak capital returns
- Interest coverage at 3.91 is only neutral, indicating tighter debt service capacity
- Lower market share reflected in smaller segment revenues
- Concentrated product segments may limit diversification benefits
Both companies show favorable overall financial profiles but differ in profitability and liquidity. PG’s strength lies in its diversified business and high returns on capital, while SPB excels in liquidity and valuation metrics but faces profitability challenges. These contrasts shape their strategic focuses and risk exposures.
The Moat Duel: Analyzing Competitive Defensibility
A structural moat is the only shield protecting long-term profits from relentless competitive erosion in consumer goods sectors:
The Procter & Gamble Company: Brand Power and Scale Moat
P&G’s moat stems from its intangible assets and brand loyalty. It delivers a robust 25% EBIT margin and a 11% ROIC premium over WACC. New product innovations and global expansion in 2026 should deepen this advantage.
Spectrum Brands Holdings, Inc.: Niche Diversification Moat
Spectrum’s moat relies on diversified product lines across pet care and home segments, contrasting with P&G’s scale. However, its slim 4.2% EBIT margin and negative ROIC spread signal weaker defensibility. Growth in pet care could offer future upside.
Wide Moat Scale vs. Niche Diversification: Who Defends Better?
P&G’s wider moat, supported by superior profitability and brand strength, outmatches Spectrum’s narrower, less profitable niche. P&G is far better positioned to defend its market share amid rising competition in 2026.
Which stock offers better returns?
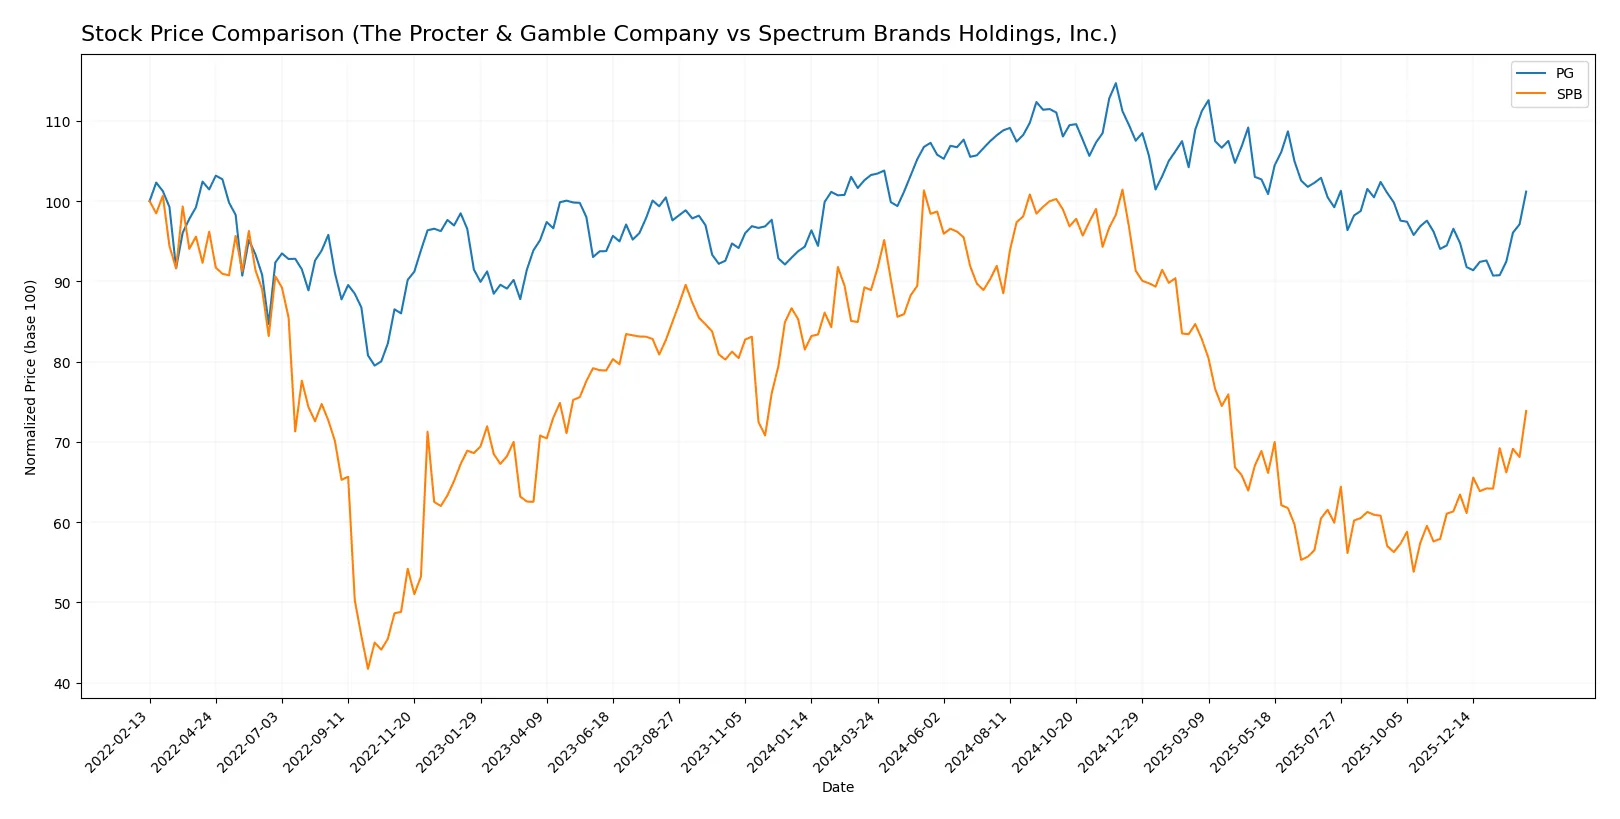
Over the past 12 months, both stocks exhibited significant price shifts, with notable acceleration in their downward trends and recent rebounds in the last quarter.
Trend Comparison
The Procter & Gamble Company’s stock declined 2.0% over the past year, showing a bearish trend with accelerating price movements and a high volatility of 8.85%. Recently, it rebounded 4.79% with moderate volatility.
Spectrum Brands Holdings, Inc. dropped 16.94% over the same period, reflecting a strong bearish trend and higher volatility at 15.04%. Its recent 20.41% price surge shows a sharper recovery and lower volatility.
Spectrum Brands experienced a steeper overall decline but a stronger recent rally, resulting in higher short-term returns compared to Procter & Gamble.
Target Prices
Analysts show a bullish consensus on both The Procter & Gamble Company and Spectrum Brands Holdings, Inc.
| Company | Target Low | Target High | Consensus |
|---|---|---|---|
| The Procter & Gamble Company | 150 | 179 | 165.67 |
| Spectrum Brands Holdings, Inc. | 75 | 75 | 75 |
The Procter & Gamble consensus target of $165.67 suggests a modest upside from the current $158.01 price. Spectrum Brands’ $75 target indicates a potential 8% gain from $69.13, reflecting moderate analyst confidence.

Don’t Let Luck Decide Your Entry Point
Optimize your entry points with our advanced ProRealTime indicators. You’ll get efficient buy signals with precise price targets for maximum performance. Start outperforming now!
How do institutions grade them?
The Procter & Gamble Company Grades
The latest institutional grades for The Procter & Gamble Company show a mix of holds, buys, and upgrades.
| Grading Company | Action | New Grade | Date |
|---|---|---|---|
| TD Cowen | Downgrade | Hold | 2026-01-27 |
| Wells Fargo | Maintain | Overweight | 2026-01-23 |
| UBS | Maintain | Buy | 2026-01-23 |
| JP Morgan | Upgrade | Overweight | 2026-01-23 |
| UBS | Maintain | Buy | 2026-01-14 |
| TD Cowen | Maintain | Buy | 2026-01-08 |
| Wells Fargo | Maintain | Overweight | 2026-01-05 |
| JP Morgan | Maintain | Neutral | 2025-12-18 |
| Jefferies | Upgrade | Buy | 2025-12-17 |
| JP Morgan | Maintain | Neutral | 2025-10-27 |
Spectrum Brands Holdings, Inc. Grades
Spectrum Brands Holdings, Inc. has consistent buy and equal weight ratings from established firms.
| Grading Company | Action | New Grade | Date |
|---|---|---|---|
| RBC Capital | Maintain | Outperform | 2026-02-03 |
| Canaccord Genuity | Maintain | Buy | 2025-11-17 |
| Wells Fargo | Maintain | Equal Weight | 2025-11-14 |
| Wells Fargo | Maintain | Equal Weight | 2025-09-25 |
| Canaccord Genuity | Maintain | Buy | 2025-08-08 |
| Wells Fargo | Maintain | Equal Weight | 2025-07-09 |
| Canaccord Genuity | Maintain | Buy | 2025-06-25 |
| UBS | Maintain | Buy | 2025-05-09 |
| UBS | Maintain | Buy | 2025-04-17 |
| Wells Fargo | Maintain | Equal Weight | 2025-04-16 |
Which company has the best grades?
The Procter & Gamble Company holds a stronger consensus with multiple buy and overweight ratings, including recent upgrades. Spectrum Brands maintains steady buy and equal weight ratings but lacks recent upgrades. Investors may interpret P&G’s higher grade momentum as a sign of stronger institutional confidence.
Risks specific to each company
The following categories identify the critical pressure points and systemic threats facing both firms in the 2026 market environment:
1. Market & Competition
The Procter & Gamble Company
- Dominates with strong brand portfolios and global reach, facing intense competition in consumer staples.
Spectrum Brands Holdings, Inc.
- Smaller scale with diverse product lines but struggles against larger incumbents and niche disruptors.
2. Capital Structure & Debt
The Procter & Gamble Company
- Maintains moderate leverage (D/E 0.68) with favorable interest coverage (23.23), indicating solid debt management.
Spectrum Brands Holdings, Inc.
- Lower leverage (D/E 0.34) but weaker interest coverage (3.91), increasing vulnerability to rising rates.
3. Stock Volatility
The Procter & Gamble Company
- Exhibits low beta (0.38), implying defensive stock behavior during market fluctuations.
Spectrum Brands Holdings, Inc.
- Higher beta (0.674) signals more volatility and sensitivity to market swings.
4. Regulatory & Legal
The Procter & Gamble Company
- Faces ongoing compliance costs and regulatory scrutiny in multiple jurisdictions due to size and product range.
Spectrum Brands Holdings, Inc.
- Regulatory risks concentrated in pet care and pesticide segments, with potential cost escalations.
5. Supply Chain & Operations
The Procter & Gamble Company
- Complex global supply chain with risks from geopolitical tensions and inflationary pressures.
Spectrum Brands Holdings, Inc.
- Smaller, more localized supply chains but less scale to absorb disruptions.
6. ESG & Climate Transition
The Procter & Gamble Company
- Increasing pressure to reduce carbon footprint and plastic waste; proactive but costly sustainability programs.
Spectrum Brands Holdings, Inc.
- ESG initiatives less mature, posing risks as consumer and investor scrutiny grows.
7. Geopolitical Exposure
The Procter & Gamble Company
- Broad international exposure to emerging markets, facing currency and political risks.
Spectrum Brands Holdings, Inc.
- Primarily US-focused, mitigating some geopolitical risk but limiting global growth opportunities.
Which company shows a better risk-adjusted profile?
The Procter & Gamble Company’s key risk is its complex global supply chain vulnerable to geopolitical and inflation shocks. Spectrum Brands Holdings, Inc.’s greatest risk is its weak profitability and financial distress signals. PG’s low beta and strong interest coverage underscore a superior risk-adjusted profile. SPB’s distress zone Altman Z-score and moderate interest coverage raise red flags, despite better liquidity ratios. PG’s robust capital structure and defensive market position justify my confidence in its risk mitigation over SPB’s more volatile and financially fragile stance.
Final Verdict: Which stock to choose?
The Procter & Gamble Company excels as a cash-generating powerhouse with a durable competitive advantage. Its moat lies in consistent value creation and superior capital efficiency. A point of vigilance is its below-par liquidity ratios, signaling potential short-term constraints. This stock suits portfolios aiming for steady, long-term growth with moderate risk tolerance.
Spectrum Brands Holdings, Inc. offers an attractive valuation with a strong liquidity profile and lower leverage. Its strategic moat is less pronounced, reflected in weaker profitability and value destruction, but improving operational returns hint at a turnaround. It fits investors who favor value opportunities with a higher tolerance for volatility and recovery plays.
If you prioritize resilient profitability and a proven economic moat, Procter & Gamble outshines due to its sustainable value creation and financial strength. However, if you seek deep value with potential upside from operational improvement, Spectrum Brands offers better stability in liquidity and a more accessible entry point, albeit with greater risk.
Disclaimer: Investment carries a risk of loss of initial capital. The past performance is not a reliable indicator of future results. Be sure to understand risks before making an investment decision.
Go Further
I encourage you to read the complete analyses of The Procter & Gamble Company and Spectrum Brands Holdings, Inc. to enhance your investment decisions: