In today’s dynamic consumer products landscape, e.l.f. Beauty, Inc. and Spectrum Brands Holdings, Inc. stand out as influential players within the household and personal products industry. While e.l.f. Beauty focuses on innovative, affordable cosmetics and skincare, Spectrum Brands offers a diverse portfolio spanning home care, pet care, and garden products. This article will analyze their market positions and strategies to help you decide which company could be the more compelling addition to your investment portfolio.
Table of contents
Companies Overview
I will begin the comparison between e.l.f. Beauty, Inc. and Spectrum Brands Holdings, Inc. by providing an overview of these two companies and their main differences.
e.l.f. Beauty, Inc. Overview
e.l.f. Beauty, Inc. operates in the Household & Personal Products industry, offering cosmetic and skin care products worldwide under brands including e.l.f. Cosmetics and Well People. Founded in 2004 and headquartered in Oakland, California, the company sells through national and international retailers as well as direct-to-consumer e-commerce platforms. Its mission centers on accessible beauty products with a focus on quality and affordability.
Spectrum Brands Holdings, Inc. Overview
Spectrum Brands Holdings, Inc., based in Middleton, Wisconsin, is a branded consumer products company active globally. It operates three segments—Home and Personal Care, Global Pet Care, and Home and Garden—offering a diverse portfolio of brands across appliances, pet care, and pest control. Established in 2009, Spectrum focuses on providing household and personal products through retailers, wholesalers, and online channels.
Key similarities and differences
Both companies belong to the Consumer Defensive sector and distribute products through multi-channel retail and e-commerce platforms. e.l.f. Beauty specializes in cosmetics and skincare, targeting personal beauty care, while Spectrum Brands manages a broader portfolio including home appliances, pet care, and garden products. e.l.f. is smaller in market cap and workforce compared to Spectrum, which operates more diversified product segments.
Income Statement Comparison
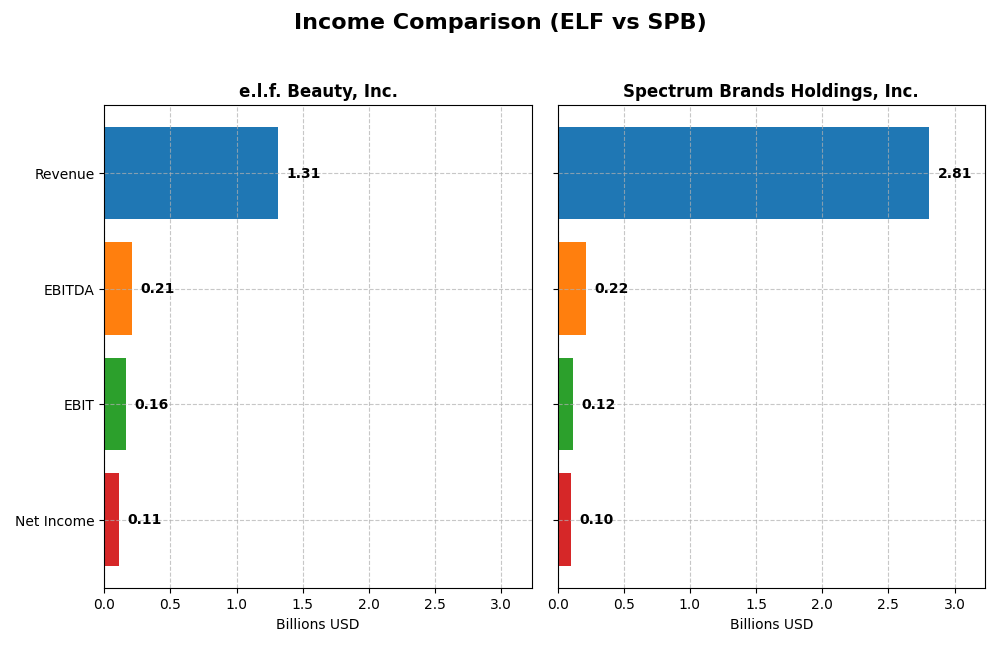
This table presents a side-by-side comparison of key income statement metrics for e.l.f. Beauty, Inc. and Spectrum Brands Holdings, Inc. for their most recent fiscal year.
| Metric | e.l.f. Beauty, Inc. (ELF) | Spectrum Brands Holdings, Inc. (SPB) |
|---|---|---|
| Market Cap | 4.92B | 1.53B |
| Revenue | 1.31B | 2.81B |
| EBITDA | 206M | 215M |
| EBIT | 162M | 117M |
| Net Income | 112M | 100M |
| EPS | 1.99 | 3.88 |
| Fiscal Year | 2025 | 2025 |
Income Statement Interpretations
e.l.f. Beauty, Inc.
e.l.f. Beauty, Inc. demonstrated strong growth from 2021 to 2025, with revenue increasing from $318M to $1.31B and net income rising from $6.2M to $112M. Margins remained robust, with a gross margin of 71.24% and a favorable EBIT margin of 12.34%. The latest fiscal year showed a 28.3% revenue increase but a 31.6% decline in net margin, reflecting some pressure on profitability.
Spectrum Brands Holdings, Inc.
Spectrum Brands saw a slight revenue decline from $3.0B in 2021 to $2.81B in 2025, alongside net income fluctuations, including a large one-time gain in 2023. Margins are moderate, with a 36.7% gross margin and a neutral EBIT margin of 4.17%. The most recent year showed a 5.2% revenue decrease and a 15.5% drop in net margin, signaling operational challenges.
Which one has the stronger fundamentals?
Based on income statement trends, e.l.f. Beauty exhibits stronger fundamentals with consistent revenue and net income growth, higher margins, and a largely favorable income statement evaluation. In contrast, Spectrum Brands has experienced declining revenue, unstable profitability, and a predominantly unfavorable income statement assessment, indicating weaker earnings performance over the period.
Financial Ratios Comparison
The table below presents a side-by-side comparison of key financial ratios for e.l.f. Beauty, Inc. and Spectrum Brands Holdings, Inc., based on their most recent fiscal year data.
| Ratios | e.l.f. Beauty, Inc. (2025 FY) | Spectrum Brands Holdings, Inc. (2025 FY) |
|---|---|---|
| ROE | 14.7% | 5.2% |
| ROIC | 11.2% | 4.9% |
| P/E | 31.5 | 13.5 |
| P/B | 4.64 | 0.71 |
| Current Ratio | 3.05 | 2.26 |
| Quick Ratio | 2.00 | 1.41 |
| D/E (Debt-to-Equity) | 0.41 | 0.34 |
| Debt-to-Assets | 25.1% | 19.4% |
| Interest Coverage | 9.20 | 4.16 |
| Asset Turnover | 1.05 | 0.83 |
| Fixed Asset Turnover | 45.6 | 8.55 |
| Payout ratio | 0% | 48.2% |
| Dividend yield | 0% | 3.57% |
Interpretation of the Ratios
e.l.f. Beauty, Inc.
e.l.f. Beauty shows a balanced ratio profile with 43% favorable and 43% unfavorable scores, reflecting a neutral overall assessment. Strong points include a quick ratio of 2.0 and low debt levels, while concerns arise from weak return on invested capital (11.21%) and high price-to-book (4.64). The company does not pay dividends, likely focusing on reinvestment and growth strategies.
Spectrum Brands Holdings, Inc.
Spectrum Brands displays a more favorable ratio set, with 64% positive and 21% negative ratings. It has solid liquidity ratios, a low price-to-book of 0.71, and a dividend yield of 3.57%, supported by a moderate payout and share buybacks. However, profitability ratios like return on equity (5.23%) remain weak, posing potential concerns for investors.
Which one has the best ratios?
Based on the evaluations, Spectrum Brands has the better ratio profile overall, with a majority of favorable ratios and a positive dividend yield. e.l.f. Beauty’s ratios are more mixed, with several unfavorable profitability and valuation metrics. Thus, Spectrum Brands demonstrates a stronger financial position in terms of ratio analysis.
Strategic Positioning
This section compares the strategic positioning of e.l.f. Beauty, Inc. and Spectrum Brands Holdings, Inc., including market position, key segments, and exposure to technological disruption:
e.l.f. Beauty, Inc.
- Mid-cap in household & personal products with higher beta, facing competitive consumer market pressure.
- Focused on cosmetics and skin care brands sold via retail and e-commerce globally.
- No explicit mention of technological disruption exposure in cosmetics sector.
Spectrum Brands Holdings, Inc.
- Smaller market cap, diversified consumer products with lower beta, competing in multiple segments.
- Operates three segments: Home & Personal Care, Global Pet Care, and Home & Garden.
- No explicit mention of technological disruption exposure across diverse product lines.
e.l.f. Beauty, Inc. vs Spectrum Brands Holdings, Inc. Positioning
e.l.f. Beauty concentrates on cosmetics and skin care, leveraging direct-to-consumer and retail channels. Spectrum Brands is diversified across pet supplies, home care, and garden products, providing broader market coverage but potentially more operational complexity.
Which has the best competitive advantage?
Both companies show slightly unfavorable MOATs, shedding value despite growing ROIC trends. Neither currently demonstrates a strong competitive advantage based on ROIC versus WACC, indicating caution in value creation sustainability.
Stock Comparison
The past year exhibited significant price declines for both e.l.f. Beauty, Inc. and Spectrum Brands Holdings, Inc., with e.l.f. Beauty showing a sharper drop and higher volatility, while recent trading dynamics suggest diverging short-term momentum.

Trend Analysis
e.l.f. Beauty, Inc. experienced a pronounced bearish trend over the past 12 months with a -53.44% price change and accelerating decline. The stock showed significant volatility, ranging from a high of 217.4 to a low of 52.65.
Spectrum Brands Holdings, Inc. also followed a bearish trend with a -20.57% decline over the same period but with lower volatility and recent acceleration. Notably, recent price movement turned positive with a 17.3% gain, indicating short-term recovery.
Comparing the two, Spectrum Brands Holdings, Inc. delivered the highest market performance over the past year, with a smaller overall loss and recent positive price momentum relative to e.l.f. Beauty, Inc.
Target Prices
Analysts present a clear target price consensus for e.l.f. Beauty, Inc. and Spectrum Brands Holdings, Inc.
| Company | Target High | Target Low | Consensus |
|---|---|---|---|
| e.l.f. Beauty, Inc. | 165 | 85 | 128.17 |
| Spectrum Brands Holdings, Inc. | 75 | 75 | 75 |
For e.l.f. Beauty, the consensus target price of 128.17 USD suggests significant upside compared to the current price of 86.58 USD. Spectrum Brands’ target consensus at 75 USD also indicates potential growth from its current price of 63.2 USD.
Analyst Opinions Comparison
This section compares analysts’ ratings and financial scores for e.l.f. Beauty, Inc. and Spectrum Brands Holdings, Inc.:
Rating Comparison
e.l.f. Beauty, Inc. Rating
- Rating: C+, considered very favorable by analysts.
- Discounted Cash Flow Score: 3, a moderate valuation score.
- ROE Score: 3, moderate efficiency in generating equity returns.
- ROA Score: 3, moderate asset utilization.
- Debt To Equity Score: 2, moderate financial risk.
- Overall Score: 2, moderate overall financial standing.
Spectrum Brands Holdings, Inc. Rating
- Rating: B, also considered very favorable by analysts.
- Discounted Cash Flow Score: 1, indicating a very unfavorable valuation.
- ROE Score: 2, moderate but lower than e.l.f. Beauty.
- ROA Score: 3, moderate asset utilization, same as e.l.f.
- Debt To Equity Score: 3, moderate financial risk but stronger than e.l.f.
- Overall Score: 3, moderate but higher overall score than e.l.f.
Which one is the best rated?
Spectrum Brands holds a higher overall rating (B) and overall score (3) compared to e.l.f. Beauty’s C+ rating and overall score of 2. However, e.l.f. Beauty scores better on discounted cash flow and return on equity, while Spectrum shows stronger debt management.
Scores Comparison
Here is a comparison of the Altman Z-Score and Piotroski Score for e.l.f. Beauty, Inc. and Spectrum Brands Holdings, Inc.:
ELF Scores
- Altman Z-Score: 3.44, in the safe zone, indicating low bankruptcy risk.
- Piotroski Score: 5, rated average financial strength.
SPB Scores
- Altman Z-Score: 1.77, in the distress zone, indicating higher bankruptcy risk.
- Piotroski Score: 6, rated average financial strength.
Which company has the best scores?
Based strictly on the provided data, e.l.f. Beauty, Inc. exhibits a stronger financial position with a safe zone Altman Z-Score compared to Spectrum Brands’ distress zone score. However, Spectrum Brands has a slightly higher Piotroski Score, though both are rated average.
Grades Comparison
The grades comparison for e.l.f. Beauty, Inc. and Spectrum Brands Holdings, Inc. is as follows:
e.l.f. Beauty, Inc. Grades
This table summarizes recent reliable grades from major financial institutions for e.l.f. Beauty, Inc.:
| Grading Company | Action | New Grade | Date |
|---|---|---|---|
| Piper Sandler | maintain | Neutral | 2025-12-22 |
| JP Morgan | maintain | Overweight | 2025-12-18 |
| Goldman Sachs | maintain | Buy | 2025-11-07 |
| Baird | maintain | Outperform | 2025-11-06 |
| Jefferies | maintain | Buy | 2025-11-06 |
| Piper Sandler | downgrade | Neutral | 2025-11-06 |
| UBS | maintain | Neutral | 2025-11-06 |
| Canaccord Genuity | maintain | Buy | 2025-11-06 |
| JP Morgan | maintain | Overweight | 2025-11-06 |
| Jefferies | maintain | Buy | 2025-10-28 |
The grades for e.l.f. Beauty show a predominance of Buy and Overweight ratings, with a few Neutral grades and one recent downgrade by Piper Sandler.
Spectrum Brands Holdings, Inc. Grades
This table presents the recent reliable grades from recognized grading firms for Spectrum Brands Holdings, Inc.:
| Grading Company | Action | New Grade | Date |
|---|---|---|---|
| Canaccord Genuity | maintain | Buy | 2025-11-17 |
| Wells Fargo | maintain | Equal Weight | 2025-11-14 |
| Wells Fargo | maintain | Equal Weight | 2025-09-25 |
| Canaccord Genuity | maintain | Buy | 2025-08-08 |
| Wells Fargo | maintain | Equal Weight | 2025-07-09 |
| Canaccord Genuity | maintain | Buy | 2025-06-25 |
| UBS | maintain | Buy | 2025-05-09 |
| UBS | maintain | Buy | 2025-04-17 |
| Wells Fargo | maintain | Equal Weight | 2025-04-16 |
| Wells Fargo | maintain | Equal Weight | 2025-04-02 |
Spectrum Brands Holdings’ grades regularly alternate between Buy and Equal Weight, with no downgrades or upgrades during the observed period.
Which company has the best grades?
Both companies maintain a consensus Buy rating, but e.l.f. Beauty, Inc. has a higher frequency of strong Buy and Outperform grades, suggesting a more bullish outlook. Spectrum Brands shows more Equal Weight ratings, indicating a more neutral market stance. Investors may interpret these differences in grades as varying confidence levels in growth potential and risk profiles.
Strengths and Weaknesses
Below is a comparison of key strengths and weaknesses of e.l.f. Beauty, Inc. (ELF) and Spectrum Brands Holdings, Inc. (SPB) based on recent financial and operational data.
| Criterion | e.l.f. Beauty, Inc. (ELF) | Spectrum Brands Holdings, Inc. (SPB) |
|---|---|---|
| Diversification | Focused on cosmetics, limited segments | Diversified across pet supplies, home care, and garden business |
| Profitability | Moderate net margin (8.53%), neutral ROE (14.73%), but ROIC below WACC | Lower net margin (3.56%) and ROE (5.23%), ROIC below WACC but improving |
| Innovation | Growing ROIC trend suggests improving efficiency | Growing ROIC trend indicates improving operations |
| Global presence | Limited info, mainly US-focused brand | Strong global presence in multiple consumer segments |
| Market Share | Niche in beauty segment, competitive market | Larger market share across diversified segments |
Key takeaways: Both companies are currently shedding value as ROIC remains below WACC, but show improving profitability trends. SPB offers greater diversification and global reach, while ELF focuses on innovation within a narrower market. Investors should weigh diversification against growth potential.
Risk Analysis
Below is a comparison of key risks for e.l.f. Beauty, Inc. (ELF) and Spectrum Brands Holdings, Inc. (SPB) based on the most recent data from 2025.
| Metric | e.l.f. Beauty, Inc. (ELF) | Spectrum Brands Holdings, Inc. (SPB) |
|---|---|---|
| Market Risk | High beta (1.72) indicates significant volatility | Lower beta (0.68) suggests lower market volatility |
| Debt level | Moderate debt-to-equity ratio (0.41), favorable | Moderate debt-to-equity ratio (0.34), favorable |
| Regulatory Risk | Moderate, cosmetics industry subject to regulations | Moderate, consumer products with compliance demands |
| Operational Risk | Supply chain and e-commerce dependency | Diverse product segments reduce operational risk |
| Environmental Risk | Moderate, rising focus on sustainability | Moderate, includes pest control and personal care |
| Geopolitical Risk | Moderate, international distribution exposure | Moderate, global operations with supply chain exposure |
The most impactful risks are ELF’s high market volatility and its unfavorable valuation metrics, while SPB faces financial distress signals from its Altman Z-score, raising bankruptcy concerns. Investors should weigh ELF’s growth potential against its market fluctuations and SPB’s lower volatility but financial fragility.
Which Stock to Choose?
e.l.f. Beauty, Inc. (ELF) shows strong income growth with a 28.28% revenue rise in the last year and favorable profitability margins, despite some recent net margin decline. Financial ratios are mixed, balancing favorable liquidity and leverage with unfavorable valuation multiples. Debt levels remain moderate, supported by solid interest coverage, and the overall rating is very favorable (C+).
Spectrum Brands Holdings, Inc. (SPB) reports an unfavorable income trend with a 5.23% revenue decrease over the past year and weaker profitability metrics. However, its financial ratios are globally favorable, highlighting attractive valuation and solid balance sheet metrics. Debt is higher relative to ELF, with a neutral interest coverage ratio, and its rating is very favorable (B).
For investors, ELF might appear more suitable for those prioritizing growth and improving profitability given its favorable income statement and dynamic ROIC trend despite some value destruction. Conversely, SPB could be interpreted as more appealing to value-oriented or risk-averse profiles due to its favorable financial ratios and valuation despite weaker income performance. Both companies show a slightly unfavorable moat status, indicating value destruction but improving profitability.
Disclaimer: Investment carries a risk of loss of initial capital. The past performance is not a reliable indicator of future results. Be sure to understand risks before making an investment decision.
Go Further
I encourage you to read the complete analyses of e.l.f. Beauty, Inc. and Spectrum Brands Holdings, Inc. to enhance your investment decisions: