Home > Comparison > Industrials > UAL vs LUV
The strategic rivalry between United Airlines Holdings, Inc. and Southwest Airlines Co. shapes the trajectory of the global airlines sector. United operates a broad international network with a capital-intensive, full-service model. Southwest focuses on a cost-efficient, domestic point-to-point system with strong ancillary revenue streams. This analysis pits network scale against operational efficiency, aiming to identify which approach offers superior risk-adjusted returns in a volatile industry.
Table of contents
Companies Overview
United Airlines Holdings and Southwest Airlines stand as pivotal players in North America’s airline industry, shaping air travel dynamics.
United Airlines Holdings, Inc.: Global Air Transportation Leader
United Airlines commands a diverse international footprint, offering passenger and cargo services across six continents. Its revenue derives primarily from ticket sales on mainline and regional fleets, complemented by ancillary services like catering and ground handling. In 2026, United sharpens its focus on expanding global connectivity and enhancing operational efficiency.
Southwest Airlines Co.: Domestic Low-Cost Carrier Powerhouse
Southwest Airlines dominates the U.S. domestic market with a cost-efficient, single-fleet model centered on Boeing 737s. It generates revenue chiefly through scheduled passenger flights and ancillary products like EarlyBird Check-In and loyalty programs. Southwest’s 2026 strategy emphasizes digital platform enhancements and customer experience innovations to retain strong domestic market share.
Strategic Collision: Similarities & Divergences
Both airlines operate in the air transportation sector but diverge in business models—United pursues broad international reach, while Southwest focuses on streamlined domestic service. Their primary battleground lies in competitive pricing and route network optimization. Investors face distinct profiles: United offers exposure to global market cycles; Southwest delivers resilience through operational simplicity and customer loyalty.
Income Statement Comparison
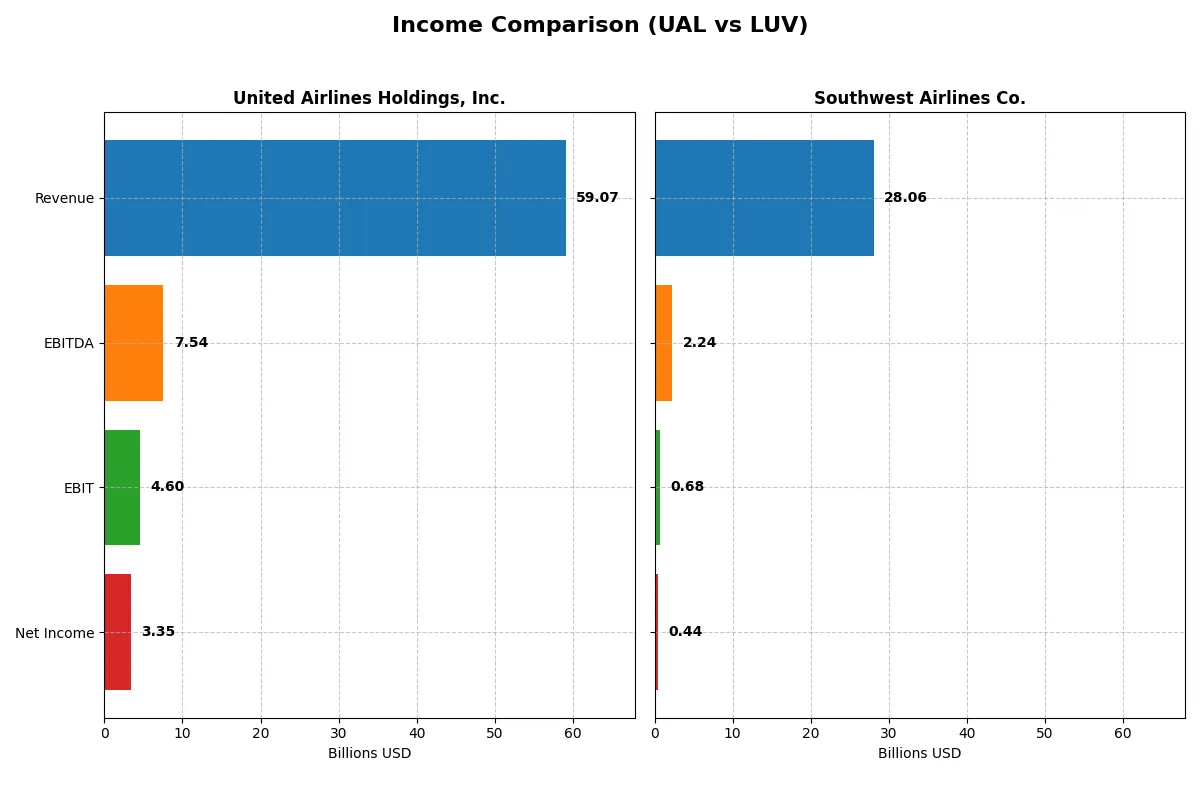
This data dissects the core profitability and scalability of both corporate engines to reveal who dominates the bottom line:
| Metric | United Airlines Holdings, Inc. (UAL) | Southwest Airlines Co. (LUV) |
|---|---|---|
| Revenue | 59B | 28B |
| Cost of Revenue | 21.2B | 23.2B |
| Operating Expenses | 33.2B | 4.5B |
| Gross Profit | 37.9B | 4.9B |
| EBITDA | 7.5B | 2.2B |
| EBIT | 4.6B | 676M |
| Interest Expense | 1.2B | 113M |
| Net Income | 3.4B | 441M |
| EPS | 10.21 | 0.82 |
| Fiscal Year | 2025 | 2025 |
Income Statement Analysis: The Bottom-Line Duel
This income statement comparison reveals which airline operates with superior efficiency and profitability under current market conditions.
United Airlines Holdings, Inc. Analysis
United Airlines shows strong revenue growth, reaching $59B in 2025, with net income rising to $3.35B. Its gross margin stands at a favorable 64.1%, reflecting excellent cost control. Despite a slight EBIT decline, net margin growth and EPS improvements demonstrate operational momentum and improving profitability.
Southwest Airlines Co. Analysis
Southwest Airlines posts $28B revenue in 2025, with net income at $441M. Its gross margin is a neutral 17.4%, indicating tighter cost pressures. EBIT and net margin both declined year-over-year, signaling challenges in scaling profits despite modest revenue growth and a slight uptick in EPS.
High Margin Strength vs. Scale and Profit Challenges
United Airlines clearly outperforms Southwest with superior margins, larger absolute profits, and overall favorable income statement trends. Southwest’s narrower margins and declining net income suggest structural profitability issues. Investors prioritizing margin quality and profit growth will find United’s profile more compelling.
Financial Ratios Comparison
These vital ratios act as a diagnostic tool to expose underlying fiscal health, valuation premiums, and capital efficiency for the companies compared below:
| Ratios | United Airlines Holdings, Inc. (UAL) | Southwest Airlines Co. (LUV) |
|---|---|---|
| ROE | 21.94% | 5.53% |
| ROIC | 6.63% | 1.79% |
| P/E | 10.91 | 50.61 |
| P/B | 2.39 | 2.80 |
| Current Ratio | 0.65 | 0.52 |
| Quick Ratio | 0.59 | 0.45 |
| D/E (Debt-to-Equity) | 2.39 | 0.75 |
| Debt-to-Assets | 47.68% | 20.58% |
| Interest Coverage | 3.86 | 3.79 |
| Asset Turnover | 0.77 | 0.97 |
| Fixed Asset Turnover | 1.14 | 1.32 |
| Payout Ratio | 0 | 90.48% |
| Dividend Yield | 0% | 1.79% |
| Fiscal Year | 2025 | 2025 |
Efficiency & Valuation Duel: The Vital Signs
Financial ratios act as a company’s DNA, exposing hidden risks and operational strengths critical to investor decisions.
United Airlines Holdings, Inc.
United Airlines posts a robust 21.94% ROE and a solid net margin of 5.68%, signaling efficient profitability. Its P/E ratio of 10.91 suggests the stock trades at a reasonable valuation relative to earnings. Despite no dividends, United prioritizes reinvestment, supporting growth through capital allocation, though liquidity ratios raise caution.
Southwest Airlines Co.
Southwest Airlines reports a modest 5.53% ROE and a low net margin of 1.57%, indicating weaker profitability. The stock appears stretched with a high P/E of 50.61, reflecting elevated expectations. Southwest pays a 1.79% dividend, balancing shareholder returns with moderate operational efficiency but struggles on liquidity metrics.
Valuation Discipline vs. Profitability Edge
United Airlines offers superior profitability and a fair valuation, balancing risk and reward better than Southwest. Investors favoring operational strength and capital efficiency may prefer United, while those seeking dividends amid stretched valuations might consider Southwest’s profile.
Which one offers the Superior Shareholder Reward?
I compare United Airlines Holdings, Inc. (UAL) and Southwest Airlines Co. (LUV) on distribution philosophies and shareholder rewards. Neither pays dividends; LUV’s 1.8% yield in 2025 contrasts UAL’s zero payout. LUV’s dividend payout ratio near 90% signals reliance on dividends despite negative free cash flow. UAL avoids dividends, focusing on modest buybacks supported by positive free cash flow per share (~7.8). Both companies maintain share repurchases, but UAL’s free cash flow coverage and capital expenditure ratio (1.4x) are healthier. LUV’s higher leverage and volatile free cash flow challenge dividend sustainability. I conclude UAL offers a more sustainable total return profile in 2026 due to stronger free cash flow and prudent capital allocation.
Comparative Score Analysis: The Strategic Profile
The radar chart reveals the fundamental DNA and trade-offs of United Airlines Holdings, Inc. and Southwest Airlines Co., highlighting their financial strengths and weaknesses:
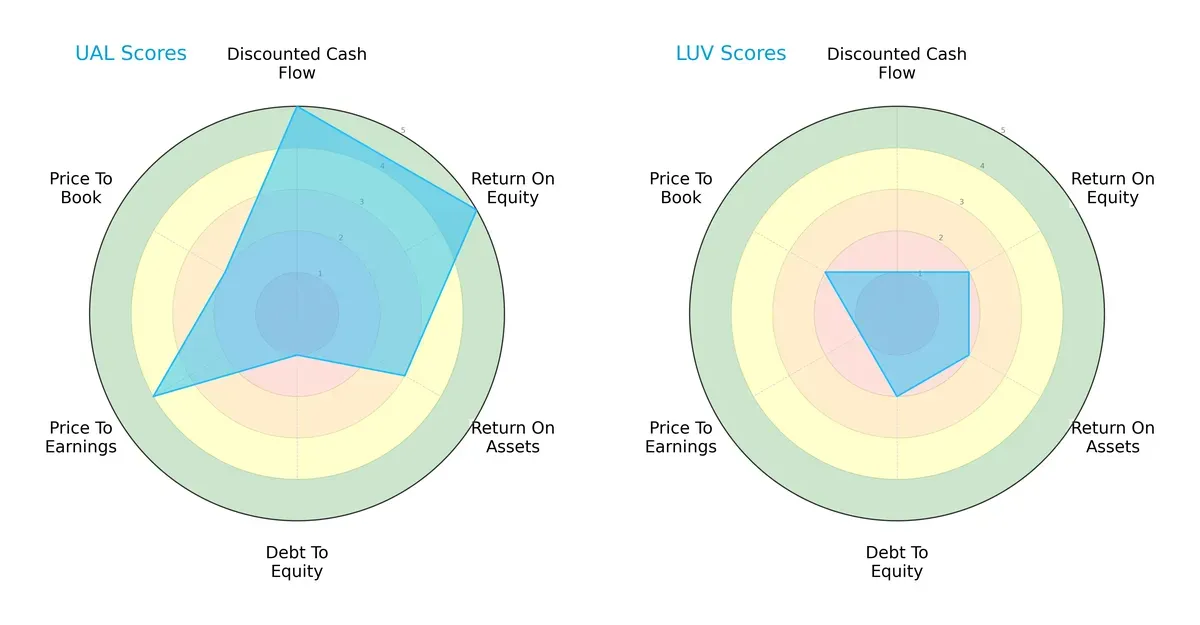
United Airlines dominates with high scores in discounted cash flow (5) and return on equity (5), reflecting strong profitability and valuation appeal. However, it carries a significant debt burden (score 1), a red flag in this capital-intensive sector. Southwest Airlines shows weaker performance across most metrics, with notably poor discounted cash flow (1) and valuation scores (1), signaling undervaluation risks but less financial efficiency. United Airlines presents a more balanced profile, while Southwest relies on modest debt levels but struggles with profitability and valuation.
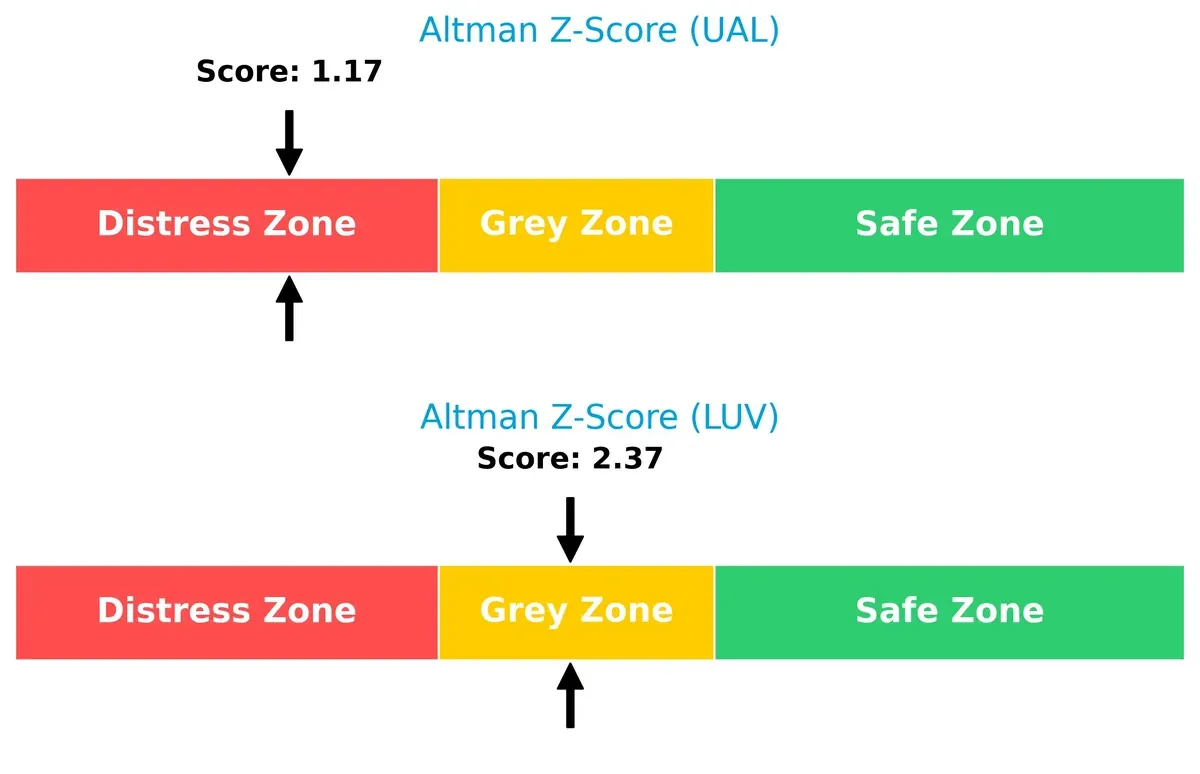
Bankruptcy Risk: Solvency Showdown
United Airlines’ Altman Z-Score of 1.17 places it in the distress zone, while Southwest’s 2.37 sits in the grey zone, indicating a better buffer against bankruptcy risk in this cycle:
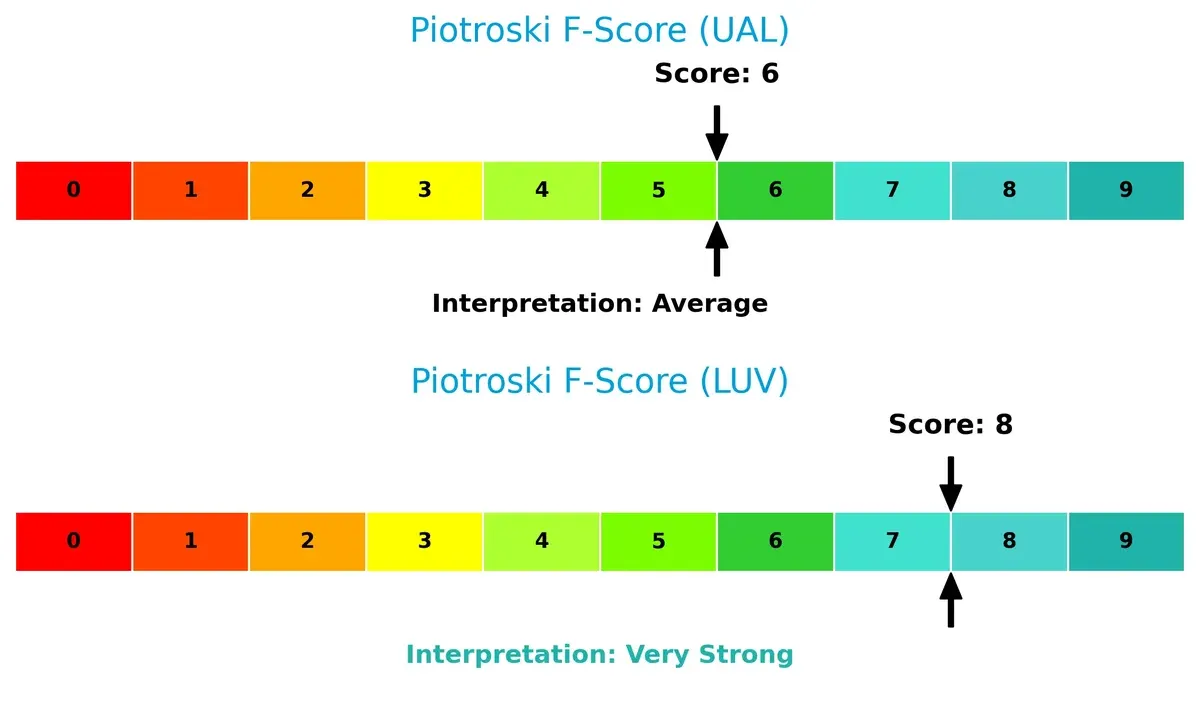
Financial Health: Quality of Operations
Southwest Airlines scores an impressive 8 on the Piotroski F-Score, signaling very strong financial health and operational quality. United Airlines’ 6 is average, suggesting some internal metrics warrant caution:
How are the two companies positioned?
This section dissects the operational DNA of UAL and LUV by comparing their revenue distribution and internal strengths and weaknesses. The goal is to confront their economic moats and identify which model offers a more resilient, sustainable competitive advantage today.
Revenue Segmentation: The Strategic Mix
This visual comparison dissects how United Airlines and Southwest Airlines diversify their income streams and highlights where their primary sector bets lie:
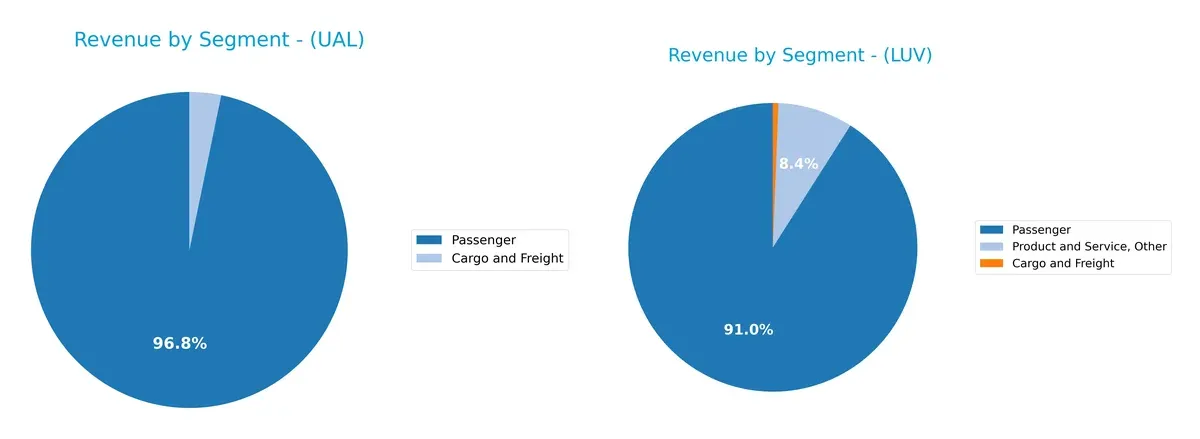
United Airlines anchors its revenue heavily on Passenger fares, generating $53.4B in 2025, dwarfing its $1.78B Cargo and Freight segment. Southwest Airlines shows a more diversified profile, with $25.5B Passenger revenue complemented by $2.36B from Product and Service, Other, plus $171M in Cargo. United’s concentration signals reliance on air travel demand, while Southwest’s mix mitigates risk through ancillary services and freight.
Strengths and Weaknesses Comparison
This table compares the Strengths and Weaknesses of United Airlines Holdings, Inc. and Southwest Airlines Co.:
United Airlines Holdings Strengths
- Higher profitability with favorable ROE and PE ratios
- Strong global presence in multiple international markets
- Larger passenger revenue base indicating significant market share
Southwest Airlines Strengths
- Lower debt-to-assets ratio and higher interest coverage enhancing financial stability
- Diversified revenue sources including product and service segments
- Competitive asset turnover suggesting operational efficiency
United Airlines Holdings Weaknesses
- Weak liquidity ratios with current and quick ratios below 1
- High debt-to-equity ratio indicating leverage risk
- No dividend yield limits shareholder returns
Southwest Airlines Weaknesses
- Poor profitability metrics with unfavorable net margin, ROE, and ROIC
- Elevated PE ratio may reflect overvaluation risk
- Low liquidity ratios raise concerns about short-term financial health
United Airlines demonstrates strong profitability and global reach but faces liquidity and leverage challenges. Southwest shows financial stability in debt management but struggles with profitability and valuation concerns. These factors shape their strategic financial priorities.
The Moat Duel: Analyzing Competitive Defensibility
A structural moat is the only barrier protecting long-term profits from relentless competitive erosion. Let’s explore how United Airlines and Southwest Airlines defend their turf:
United Airlines Holdings, Inc.: Global Network and Scale Advantage
United Airlines’ moat stems from its extensive international network and diversified global routes. This manifests in a strong gross margin of 64% and improving profitability metrics. Expanding in Asia and Latin America deepens its moat in 2026.
Southwest Airlines Co.: Low-Cost Operating Model
Southwest’s primary moat is its cost advantage through operational efficiency and a simplified fleet. However, its margin stability lags United’s, reflecting lower profitability and declining ROIC trends. Opportunities lie in digital platforms and ancillary services expansion.
Network Reach vs. Cost Efficiency: The Moat Showdown
United Airlines’ broader geographic footprint and rising ROIC create a deeper moat compared to Southwest’s shrinking profitability. I see United better positioned to defend market share amid intensifying competition globally.
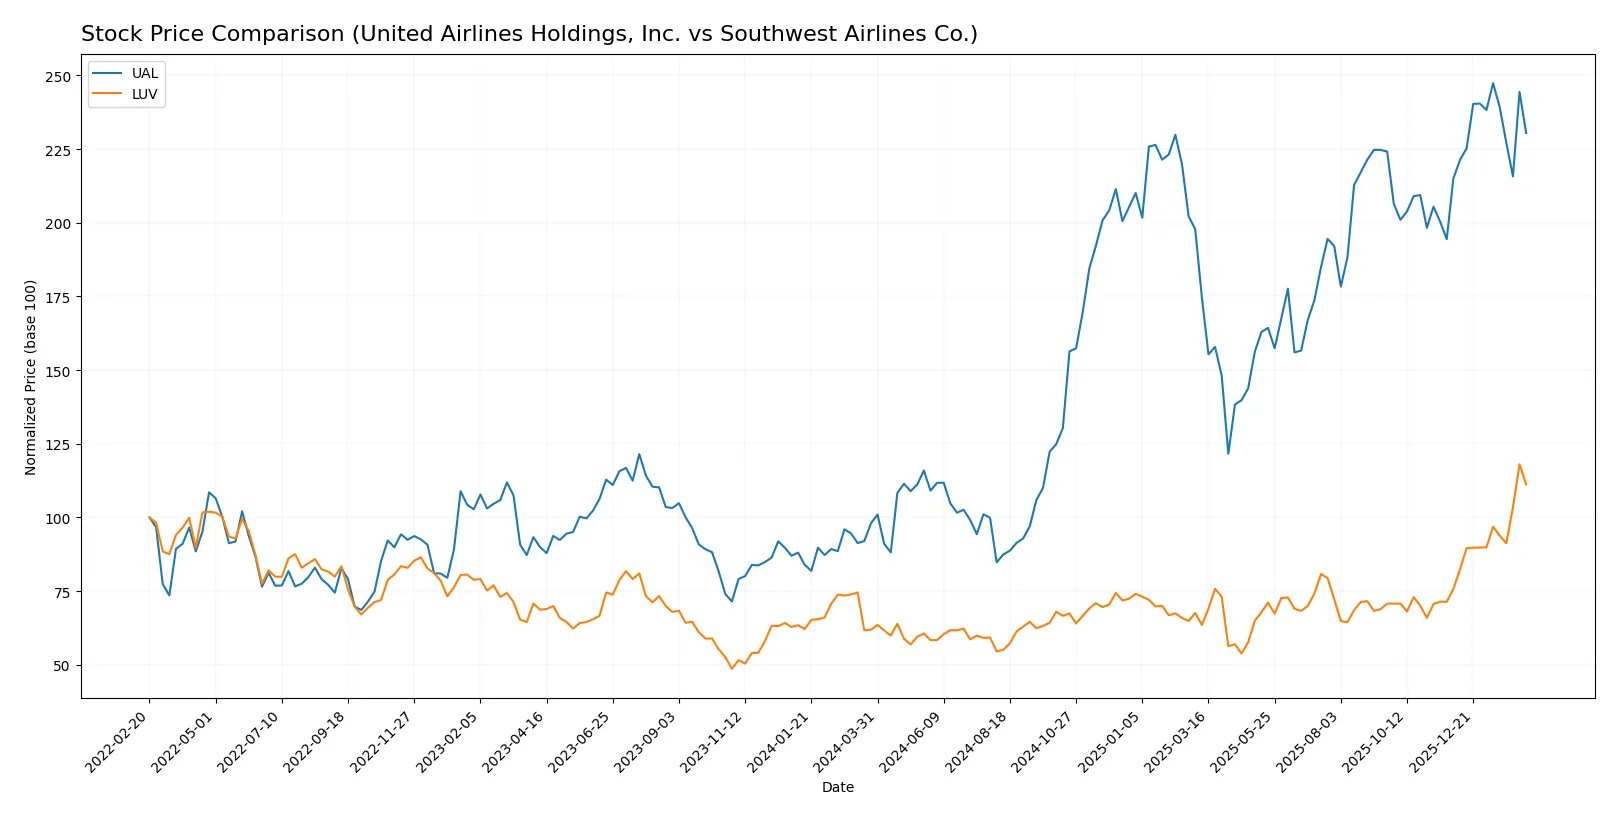
Which stock offers better returns?
Over the past year, United Airlines and Southwest Airlines showed strong price gains with contrasting acceleration patterns and distinct trading volume trends.
Trend Comparison
United Airlines’ stock surged 135.18% over 12 months, indicating a bullish trend with decelerating momentum. Volatility is high, with a standard deviation of 23.58 and prices ranging from 40.19 to 117.32.
Southwest Airlines’ stock rose 79.65% over the same period, reflecting a bullish trend with accelerating momentum. Volatility is moderate, with a standard deviation of 5.2 and prices between 24.74 and 54.26.
United Airlines outperformed Southwest Airlines in total price return, despite slower recent growth. Southwest showed stronger recent acceleration and higher buyer dominance in volume.
Target Prices
Analysts show a positive outlook with clear upside potential for United Airlines and Southwest Airlines.
| Company | Target Low | Target High | Consensus |
|---|---|---|---|
| United Airlines Holdings, Inc. | 110 | 150 | 136.5 |
| Southwest Airlines Co. | 32 | 57.5 | 49.58 |
The consensus targets for both airlines exceed current prices, signaling expected growth. United trades near 109, while Southwest sits at 51, below their respective consensus.

Don’t Let Luck Decide Your Entry Point
Optimize your entry points with our advanced ProRealTime indicators. You’ll get efficient buy signals with precise price targets for maximum performance. Start outperforming now!
How do institutions grade them?
United Airlines Holdings, Inc. Grades
This table summarizes the recent grades assigned to United Airlines Holdings, Inc. by various institutions.
| Grading Company | Action | New Grade | Date |
|---|---|---|---|
| TD Cowen | Maintain | Buy | 2026-01-22 |
| Argus Research | Maintain | Buy | 2026-01-22 |
| UBS | Maintain | Buy | 2026-01-22 |
| Goldman Sachs | Maintain | Buy | 2026-01-13 |
| Barclays | Maintain | Overweight | 2026-01-12 |
| Susquehanna | Maintain | Positive | 2026-01-09 |
| Citigroup | Maintain | Buy | 2026-01-07 |
| TD Cowen | Maintain | Buy | 2026-01-07 |
| UBS | Maintain | Buy | 2026-01-06 |
| B of A Securities | Maintain | Buy | 2026-01-06 |
Southwest Airlines Co. Grades
This table presents the latest grades issued for Southwest Airlines Co. by different grading firms.
| Grading Company | Action | New Grade | Date |
|---|---|---|---|
| Susquehanna | Maintain | Neutral | 2026-02-03 |
| Jefferies | Maintain | Hold | 2026-02-02 |
| UBS | Maintain | Neutral | 2026-02-02 |
| TD Cowen | Maintain | Hold | 2026-01-30 |
| BMO Capital | Upgrade | Outperform | 2026-01-30 |
| B of A Securities | Maintain | Underperform | 2026-01-30 |
| Wells Fargo | Maintain | Equal Weight | 2026-01-30 |
| Morgan Stanley | Maintain | Overweight | 2026-01-30 |
| Goldman Sachs | Maintain | Sell | 2026-01-30 |
| Evercore ISI Group | Maintain | In Line | 2026-01-29 |
Which company has the best grades?
United Airlines consistently receives strong buy and overweight ratings from major firms, signaling broad institutional confidence. Southwest Airlines shows more mixed opinions, including neutral and underperform grades, suggesting greater uncertainty for investors.
Risks specific to each company
The following categories identify the critical pressure points and systemic threats facing both firms in the 2026 market environment:
1. Market & Competition
United Airlines Holdings, Inc. (UAL)
- Faces intense global competition across diverse international routes, stressing pricing power and capacity management.
Southwest Airlines Co. (LUV)
- Focuses on domestic and near-international markets, contending with regional rivals and price sensitivity.
2. Capital Structure & Debt
United Airlines Holdings, Inc. (UAL)
- High debt-to-equity ratio (2.39) signals elevated leverage risk with low current and quick ratios (0.65, 0.59).
Southwest Airlines Co. (LUV)
- Lower leverage (0.75 debt-to-equity), better interest coverage (5.98), but still exhibits weak liquidity (current ratio 0.52).
3. Stock Volatility
United Airlines Holdings, Inc. (UAL)
- Beta of 1.26 indicates higher volatility than the market, reflecting sensitivity to economic cycles.
Southwest Airlines Co. (LUV)
- Beta of 1.11 shows moderate market volatility but relatively more stability than UAL.
4. Regulatory & Legal
United Airlines Holdings, Inc. (UAL)
- Subject to multi-jurisdictional aviation regulations and evolving environmental standards worldwide.
Southwest Airlines Co. (LUV)
- Primarily regulated within U.S. and near-international jurisdictions with growing scrutiny on emissions and safety.
5. Supply Chain & Operations
United Airlines Holdings, Inc. (UAL)
- Complex global supply chains increase exposure to disruptions and rising maintenance costs.
Southwest Airlines Co. (LUV)
- More concentrated operations reduce complexity but still vulnerable to fleet maintenance and labor issues.
6. ESG & Climate Transition
United Airlines Holdings, Inc. (UAL)
- Faces pressure to decarbonize global operations amid rising ESG investor demands.
Southwest Airlines Co. (LUV)
- Also pressured on climate transition but benefits from simpler fleet and shorter routes.
7. Geopolitical Exposure
United Airlines Holdings, Inc. (UAL)
- Broad international footprint exposes it to geopolitical instability and trade tensions.
Southwest Airlines Co. (LUV)
- Limited international exposure reduces geopolitical risk but concentrates risk domestically.
Which company shows a better risk-adjusted profile?
UAL’s most impactful risk is its high leverage and liquidity constraints, raising concerns over financial flexibility. LUV’s primary risk lies in weak profitability and stretched valuation multiples, signaling operational and market challenges. Despite UAL’s financial strain, its superior ROE and discounted cash flow scores indicate better capital efficiency. LUV’s stronger Piotroski and Altman Z-scores suggest more stable fundamentals, but its valuation and profitability weaknesses temper enthusiasm. Overall, UAL presents a riskier balance sheet, but LUV’s operational challenges and high P/E ratio undermine its risk-adjusted appeal.
Final Verdict: Which stock to choose?
United Airlines (UAL) stands out for its growing profitability and improving return on invested capital, signaling a budding competitive edge. Its key strength lies in value creation through enhanced operational efficiency. A point of vigilance remains its stretched liquidity position, which could pressure flexibility. UAL suits investors targeting aggressive growth with a tolerance for balance sheet risks.
Southwest Airlines (LUV) offers a strategic moat rooted in a lower debt load and stronger interest coverage, providing a safer financial cushion. Its operational model emphasizes stability and capital discipline despite weaker profitability metrics. LUV fits portfolios that prioritize growth at a reasonable price, appealing to those seeking more stability over high returns.
If you prioritize capital efficiency and improving profitability with a willingness to accept liquidity risks, UAL is the compelling choice due to its upward ROIC trend and value creation. However, if you seek financial safety and steadier cash flow with less aggressive growth, LUV offers better stability thanks to its healthier leverage profile and stronger interest coverage. Each name addresses distinct investor profiles within the cyclical airline sector.
Disclaimer: Investment carries a risk of loss of initial capital. The past performance is not a reliable indicator of future results. Be sure to understand risks before making an investment decision.
Go Further
I encourage you to read the complete analyses of United Airlines Holdings, Inc. and Southwest Airlines Co. to enhance your investment decisions: