In the rapidly evolving software application industry, Unity Software Inc. and SoundHound AI, Inc. stand out as pioneers driving innovation. Unity specializes in real-time 3D content platforms, fueling creativity across gaming and virtual reality, while SoundHound AI focuses on cutting-edge voice AI technology, enhancing conversational experiences. This article compares their market strategies and growth potential to help you decide which company could be the most compelling addition to your investment portfolio.
Table of contents
Companies Overview
I will begin the comparison between Unity Software Inc. and SoundHound AI, Inc. by providing an overview of these two companies and their main differences.
Unity Software Inc. Overview
Unity Software Inc. develops an interactive real-time 3D content platform aimed at content creators and developers. Its software solutions facilitate the creation, operation, and monetization of 2D and 3D content across mobile phones, PCs, consoles, and AR/VR devices. Founded in 2004 and headquartered in San Francisco, Unity serves a global market through various sales channels.
SoundHound AI, Inc. Overview
SoundHound AI, Inc. offers an independent voice AI platform designed to enable businesses to build conversational voice assistants. Its flagship Houndify platform integrates automatic speech recognition, natural language understanding, and text-to-speech technologies. Founded recently and based in Santa Clara, SoundHound focuses on delivering high-quality voice experiences across different industries.
Key similarities and differences
Both Unity and SoundHound operate in the technology sector within the software application industry, focusing on enabling advanced interactive and AI-driven experiences. Unity specializes in real-time 3D content creation for diverse devices, while SoundHound concentrates on voice AI and conversational platforms. Their differing core technologies and market applications highlight distinct business models despite shared industry positioning.
Income Statement Comparison
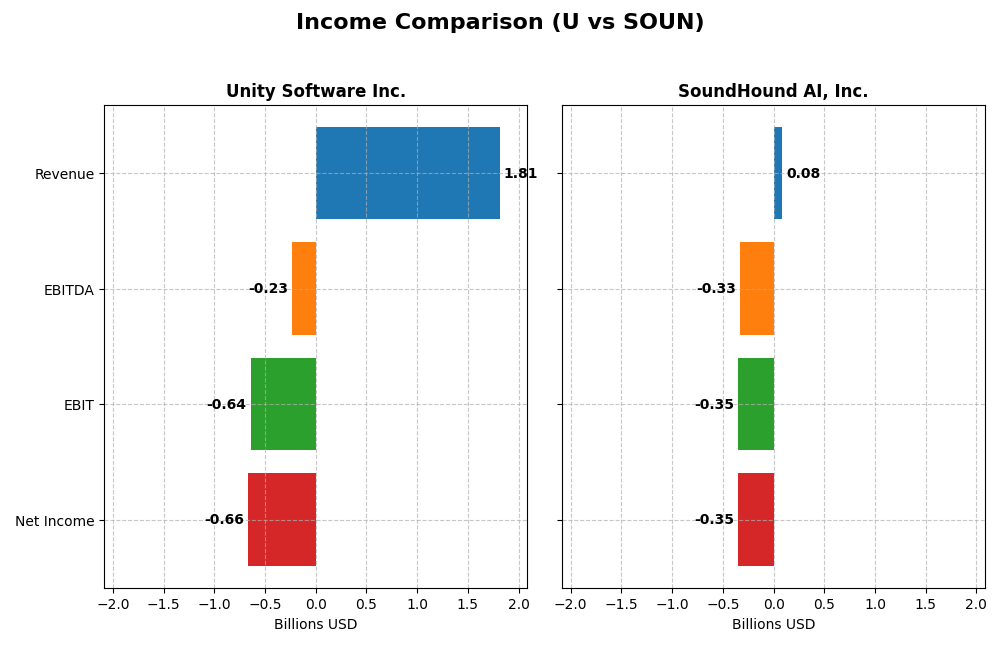
The table below compares key income statement metrics for Unity Software Inc. and SoundHound AI, Inc. based on their most recent fiscal year data for 2024.
| Metric | Unity Software Inc. (U) | SoundHound AI, Inc. (SOUN) |
|---|---|---|
| Market Cap | 17.5B | 4.7B |
| Revenue | 1.81B | 85M |
| EBITDA | -235M | -329M |
| EBIT | -644M | -348M |
| Net Income | -664M | -351M |
| EPS | -1.68 | -1.04 |
| Fiscal Year | 2024 | 2024 |
Income Statement Interpretations
Unity Software Inc.
Unity Software’s revenue grew significantly by 134.7% over the 2020-2024 period but declined by 17.1% in the latest year. Despite a strong gross margin of 73.48%, profitability remains challenged with negative net margins around -36.63%. The 2024 year showed an improvement in EBIT by 16.8% and EPS growth of 22.2%, indicating some operational progress amid ongoing losses.
SoundHound AI, Inc.
SoundHound AI experienced a remarkable 550.6% revenue increase over the period with an 84.6% jump in 2024 alone. However, it also faces substantial net losses, with net margins at -414.1% and an EBIT margin deeply negative at -410.6%. The latest year saw deteriorations in EBIT and EPS, reflecting high operational costs despite improving gross margins near 49%.
Which one has the stronger fundamentals?
Both companies show unfavorable global income statement evaluations due to persistent net losses and negative EBIT margins. Unity benefits from a higher and more stable gross margin and recent EBIT improvements, whereas SoundHound boasts stronger revenue growth but suffers from extreme negative profitability and high interest expenses. Overall, neither company currently demonstrates robust profitability fundamentals.
Financial Ratios Comparison
The following table presents the most recent available financial ratios for Unity Software Inc. and SoundHound AI, Inc., facilitating a direct comparison of key performance and financial health metrics as of fiscal year 2024.
| Ratios | Unity Software Inc. (U) | SoundHound AI, Inc. (SOUN) |
|---|---|---|
| ROE | -20.8% | -191.9% |
| ROIC | -12.8% | -68.1% |
| P/E | -13.4 | -19.1 |
| P/B | 2.79 | 36.76 |
| Current Ratio | 2.50 | 3.77 |
| Quick Ratio | 2.50 | 3.77 |
| D/E | 0.74 | 0.02 |
| Debt-to-Assets | 34.9% | 0.8% |
| Interest Coverage | -32.1 | -28.1 |
| Asset Turnover | 0.27 | 0.15 |
| Fixed Asset Turnover | 18.3 | 14.3 |
| Payout ratio | 0 | 0 |
| Dividend yield | 0 | 0 |
Interpretation of the Ratios
Unity Software Inc.
Unity Software exhibits a mixed ratio profile with significant weaknesses, including negative net margin (-36.63%) and return on equity (-20.81%), signaling profitability challenges. Favorable liquidity ratios (current and quick ratios at 2.5) suggest adequate short-term financial health. The company does not pay dividends, likely prioritizing reinvestment and growth, as free cash flow coverage is negative, indicating ongoing cash consumption.
SoundHound AI, Inc.
SoundHound AI shows mostly unfavorable ratios with a deeply negative net margin (-414.06%) and return on equity (-191.99%), reflecting severe profitability and efficiency issues. However, it has favorable debt metrics, including a low debt-to-assets ratio (0.79%) and debt-to-equity (0.02). The absence of dividends aligns with its high growth phase and reinvestment focus, supported by negative free cash flow and significant R&D expenses.
Which one has the best ratios?
Between the two, Unity Software’s ratios are slightly unfavorable overall, with more balance between strengths and weaknesses, particularly in liquidity and asset turnover. SoundHound AI’s ratios are predominantly unfavorable, especially in profitability and valuation, despite superior leverage figures. Thus, Unity Software presents a comparatively stronger ratio profile based on the 2024 fiscal data.
Strategic Positioning
This section compares the strategic positioning of Unity Software Inc. and SoundHound AI, Inc. across market position, key segments, and exposure to technological disruption:
Unity Software Inc.
- Market position and competitive pressure
- Key segments and business drivers
- Exposure to technological disruption
SoundHound AI, Inc.
- MarketCap 17.5B, high beta 2.05 indicates volatility
- Focused on Create and Operate Solutions for interactive 3D content
- Operates in interactive real-time 2D/3D content across multiple devices
Unity Software Inc. vs SoundHound AI, Inc. Positioning
Unity pursues a diversified strategy with multiple product lines in interactive content creation and operation, serving a broad customer base globally. SoundHound concentrates on voice AI with a narrower product focus and fewer employees, potentially limiting market scope but specializing deeply.
Which has the best competitive advantage?
Both companies are currently shedding value, but Unity’s ROIC is declining while SoundHound’s profitability is improving. Unity’s larger scale contrasts with SoundHound’s growth in ROIC, indicating different stages of competitive advantage development.
Stock Comparison
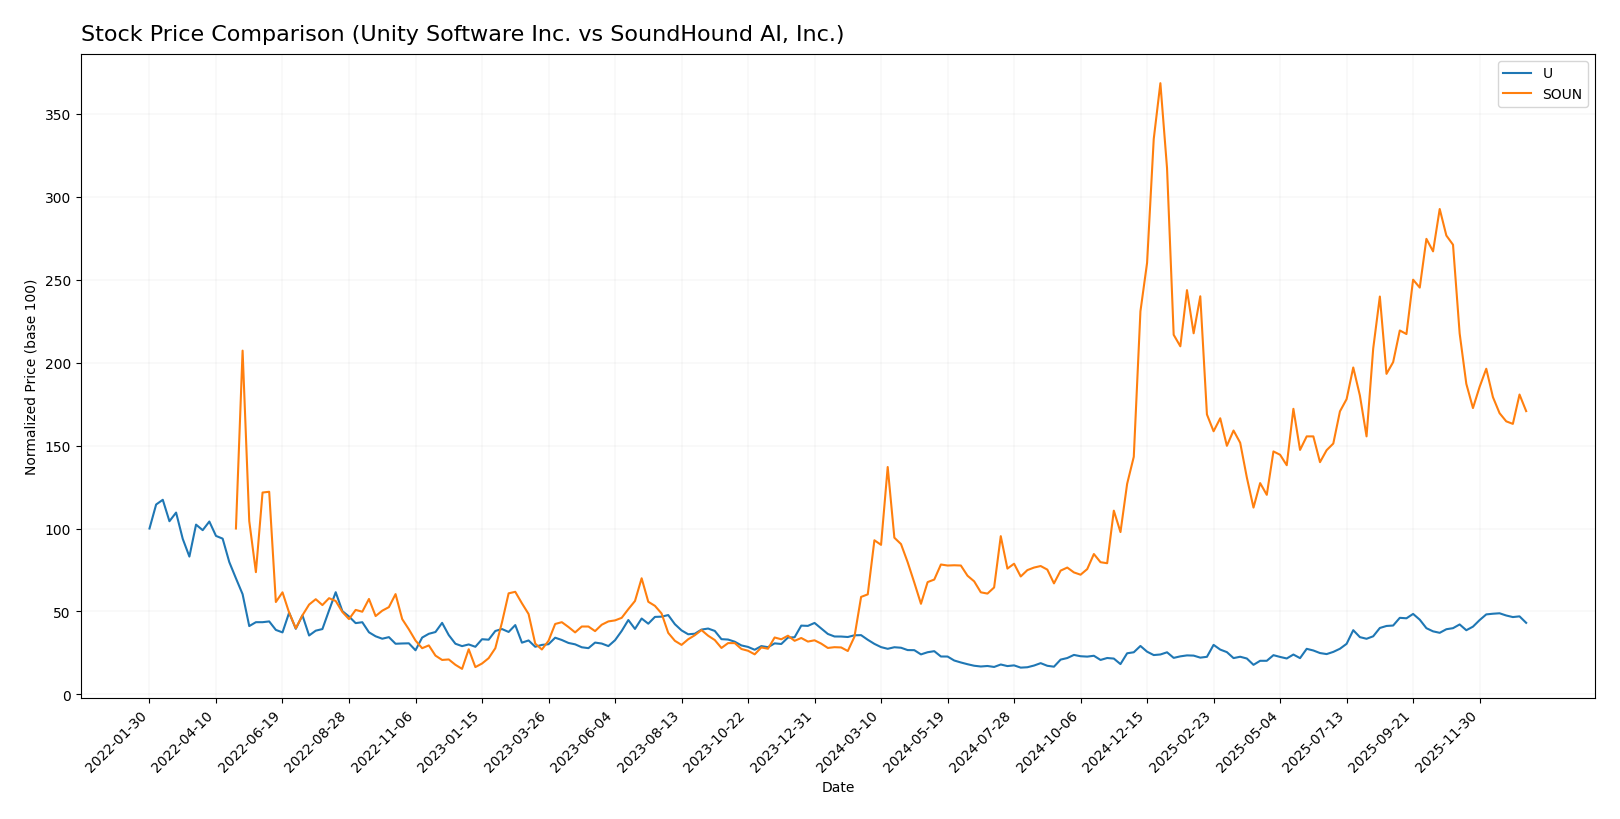
The stock prices of Unity Software Inc. and SoundHound AI, Inc. have shown significant movements over the past year, reflecting diverse trading dynamics and investor sentiment.
Trend Analysis
Unity Software Inc.’s stock showed a bullish trend over the past 12 months with a 31.0% price increase, accelerating from a low of 15.32 to a high of 46.42, accompanied by a high volatility of 9.04.
SoundHound AI, Inc. experienced a stronger bullish trend over the same period, with price gains of 183.16%, although recent months showed deceleration and a 37.0% decline, with lower volatility at 4.66.
SoundHound AI, Inc. outperformed Unity Software Inc. in market performance over the last year, despite recent downward pressure contrasting Unity’s continued acceleration.
Target Prices
The consensus target prices indicate a positive outlook from analysts for both companies.
| Company | Target High | Target Low | Consensus |
|---|---|---|---|
| Unity Software Inc. | 60 | 39 | 50.98 |
| SoundHound AI, Inc. | 15 | 11 | 13.33 |
Analysts expect Unity Software’s stock to appreciate significantly above its current price of $40.95, while SoundHound AI is also projected to rise moderately from $11.10.
Analyst Opinions Comparison
This section compares analysts’ ratings and grades for Unity Software Inc. and SoundHound AI, Inc.:
Rating Comparison
Unity Software Inc. Rating
- Rating: D+, considered very favorable by analysts.
- Discounted Cash Flow Score: 1, rated very unfavorable.
- ROE Score: 1, indicating very unfavorable profitability.
- ROA Score: 1, very unfavorable asset utilization.
- Debt To Equity Score: 1, very unfavorable financial risk.
- Overall Score: 1, very unfavorable financial standing.
SoundHound AI, Inc. Rating
- Rating: C-, also considered very favorable.
- Discounted Cash Flow Score: 1, rated very unfavorable.
- ROE Score: 1, also very unfavorable.
- ROA Score: 1, very unfavorable as well.
- Debt To Equity Score: 4, favorable financial risk.
- Overall Score: 1, also very unfavorable.
Which one is the best rated?
Both companies share an overall very unfavorable score of 1, but SoundHound AI has a notably better debt-to-equity score of 4 compared to Unity’s 1. Despite this, their overall ratings and other financial scores are similar.
Scores Comparison
Here is a comparison of the Altman Z-Score and Piotroski Score for Unity Software Inc. and SoundHound AI, Inc.:
Unity Software Inc. Scores
- Altman Z-Score of 2.93 places it in the grey zone, indicating moderate bankruptcy risk.
- Piotroski Score of 4 shows average financial strength.
SoundHound AI, Inc. Scores
- Altman Z-Score of 6.62 places it in the safe zone, indicating low bankruptcy risk.
- Piotroski Score of 3 indicates very weak financial strength.
Which company has the best scores?
SoundHound AI has a significantly higher Altman Z-Score, indicating stronger financial stability, but a weaker Piotroski Score. Unity Software shows moderate bankruptcy risk with a better Piotroski Score.
Grades Comparison
The grade assessments from reputable financial institutions for Unity Software Inc. and SoundHound AI, Inc. are as follows:
Unity Software Inc. Grades
This table summarizes recent grades assigned by established financial firms for Unity Software Inc.:
| Grading Company | Action | New Grade | Date |
|---|---|---|---|
| Morgan Stanley | Maintain | Overweight | 2026-01-13 |
| Goldman Sachs | Maintain | Neutral | 2026-01-13 |
| Wells Fargo | Maintain | Overweight | 2026-01-08 |
| Jefferies | Maintain | Buy | 2026-01-05 |
| Piper Sandler | Upgrade | Overweight | 2025-12-11 |
| BTIG | Upgrade | Buy | 2025-12-11 |
| Wells Fargo | Upgrade | Overweight | 2025-12-05 |
| Arete Research | Upgrade | Buy | 2025-12-01 |
| Citigroup | Maintain | Buy | 2025-11-11 |
| Wells Fargo | Maintain | Equal Weight | 2025-11-07 |
Overall, Unity Software Inc. shows a predominantly positive trend with multiple upgrades and strong buy/overweight ratings from respected firms.
SoundHound AI, Inc. Grades
This table presents recent reliable grades issued by financial analysts for SoundHound AI, Inc.:
| Grading Company | Action | New Grade | Date |
|---|---|---|---|
| Piper Sandler | Maintain | Neutral | 2026-01-05 |
| Cantor Fitzgerald | Upgrade | Overweight | 2025-12-12 |
| DA Davidson | Maintain | Buy | 2025-11-18 |
| Piper Sandler | Maintain | Neutral | 2025-11-07 |
| HC Wainwright & Co. | Maintain | Buy | 2025-10-16 |
| HC Wainwright & Co. | Maintain | Buy | 2025-09-17 |
| Wedbush | Maintain | Outperform | 2025-09-11 |
| DA Davidson | Maintain | Buy | 2025-09-10 |
| Ladenburg Thalmann | Upgrade | Buy | 2025-08-11 |
| Wedbush | Maintain | Outperform | 2025-08-08 |
SoundHound AI, Inc. enjoys mostly buy and outperform ratings, with a few upgrades from neutral to overweight or buy, indicating positive analyst sentiment.
Which company has the best grades?
Both Unity Software Inc. and SoundHound AI, Inc. hold a consensus rating of “Buy,” but Unity exhibits a higher number of upgrades and overweight ratings from a broad set of analysts. This could imply stronger market confidence in Unity, potentially affecting investor sentiment and portfolio positioning more favorably compared to SoundHound.
Strengths and Weaknesses
Below is a comparison of key strengths and weaknesses for Unity Software Inc. (U) and SoundHound AI, Inc. (SOUN) based on their recent financial and business performance.
| Criterion | Unity Software Inc. (U) | SoundHound AI, Inc. (SOUN) |
|---|---|---|
| Diversification | Moderate diversification: Create Solutions and Operate Solutions segments contribute $614M and $1.2B respectively in 2024. | Less diversified: Hosted Services ($57M), Licensing ($18M), and Professional Services ($9M) in 2024. |
| Profitability | Negative profitability with net margin of -36.63% and ROIC of -12.78%, value destroying. | More severely negative profitability: net margin -414.06%, ROIC -68.13%, also value destroying but improving ROIC trend. |
| Innovation | Strong focus on real-time 3D development platforms, but declining ROIC indicates challenges in converting innovation to profits. | Positioned in AI voice recognition with growing ROIC trend, indicating improving innovation impact despite losses. |
| Global presence | Established global footprint with significant market penetration in gaming and simulation sectors. | Smaller global reach, focused on AI voice technologies with niche markets. |
| Market Share | Significant player in game engine and real-time 3D content market. | Smaller market share in AI voice assistant and conversational AI markets. |
Key takeaway: Unity Software holds a stronger market position and diversification but struggles with profitability and value creation. SoundHound AI faces more severe profitability challenges but shows a positive trend in ROIC, suggesting potential for future improvement. Investors should weigh Unity’s market strength against its declining returns and consider SoundHound’s growth potential balanced by higher risks.
Risk Analysis
Below is a comparison of key risks for Unity Software Inc. (U) and SoundHound AI, Inc. (SOUN) based on the most recent data from 2024.
| Metric | Unity Software Inc. (U) | SoundHound AI, Inc. (SOUN) |
|---|---|---|
| Market Risk | High beta (2.05) indicates elevated market volatility risk | Very high beta (2.88) suggests even higher market volatility risk |
| Debt level | Moderate debt-to-equity (0.74), neutral risk profile | Very low debt-to-equity (0.02), low financial leverage risk |
| Regulatory Risk | Industry-facing typical tech software regulations | AI-focused regulatory scrutiny may increase, moderate risk |
| Operational Risk | Larger scale with 4,987 employees; complexity risk present | Smaller scale (842 employees), operational risk from growth challenges |
| Environmental Risk | Limited direct exposure due to software nature | Similar low exposure but dependent on data centers and AI infrastructure |
| Geopolitical Risk | Global operations in multiple countries, moderate exposure | Primarily US-based, lower geopolitical risk |
In synthesis, both companies face significant market risk due to their high betas, with SoundHound showing higher sensitivity to market swings. Unity’s moderate debt suggests manageable financial risk, whereas SoundHound’s low debt reduces leverage risk but its very unfavorable profitability and liquidity ratios highlight operational and financial challenges. Regulatory risks are rising especially for AI companies like SoundHound. These factors make market volatility and operational execution the most impactful risks currently.
Which Stock to Choose?
Unity Software Inc. (U) shows mixed financial health with a declining income trend in 2024, unfavorable profitability ratios including a -36.63% net margin and -20.81% ROE, moderate debt levels, and a “D+” rating reflecting very unfavorable overall scores.
SoundHound AI, Inc. (SOUN) presents strong revenue growth but suffers from very unfavorable profitability metrics such as a -414.06% net margin and -191.99% ROE, low debt levels, and a “C-” rating with mostly unfavorable financial scores despite a safer Altman Z-Score.
Investors favoring growth might view SOUN’s rapid revenue expansion and improving moat as potential, while those prioritizing financial stability could interpret U’s slightly better liquidity and average Altman Z-Score as signs of lower risk, albeit both show unfavorable profitability and value destruction.
Disclaimer: Investment carries a risk of loss of initial capital. The past performance is not a reliable indicator of future results. Be sure to understand risks before making an investment decision.
Go Further
I encourage you to read the complete analyses of Unity Software Inc. and SoundHound AI, Inc. to enhance your investment decisions: