Snowflake Inc. and Workday, Inc. stand out as leaders in the software application industry, each driving innovation through cloud-based solutions. Snowflake specializes in data platforms that unify business intelligence, while Workday focuses on enterprise applications for finance and human capital management. Their overlapping markets and distinct strategies offer a compelling comparison. In this article, I will help you decide which company holds the most promise for your investment portfolio.

Table of contents
Companies Overview
I will begin the comparison between Snowflake Inc. and Workday, Inc. by providing an overview of these two companies and their main differences.
Snowflake Inc. Overview
Snowflake Inc. is a technology company specializing in a cloud-based data platform known as Data Cloud. Its platform consolidates data into a single source of truth to enable business insights, data-driven applications, and data sharing across various industries. Incorporated in 2012 and based in Bozeman, Montana, Snowflake serves customers internationally and has a market cap of approximately 70.4B USD.
Workday, Inc. Overview
Workday, Inc. provides enterprise cloud applications that support financial management, human capital management, spend management, planning, and analytics. Founded in 2005 and headquartered in Pleasanton, California, Workday serves multiple sectors including healthcare, education, and retail. Its market cap stands near 49.9B USD, with a workforce exceeding 20K employees globally.
Key similarities and differences
Both Snowflake and Workday operate within the technology sector, focusing on cloud-based software solutions. They serve diverse industries and provide platforms aimed at optimizing business operations through data and analytics. However, Snowflake emphasizes data consolidation and sharing, while Workday offers a broader suite covering financial, HR, and spend management applications, reflecting a more extensive enterprise application portfolio.
Income Statement Comparison
The table below compares key income statement metrics for Snowflake Inc. and Workday, Inc. for the fiscal year 2025, providing a snapshot of their financial performance.
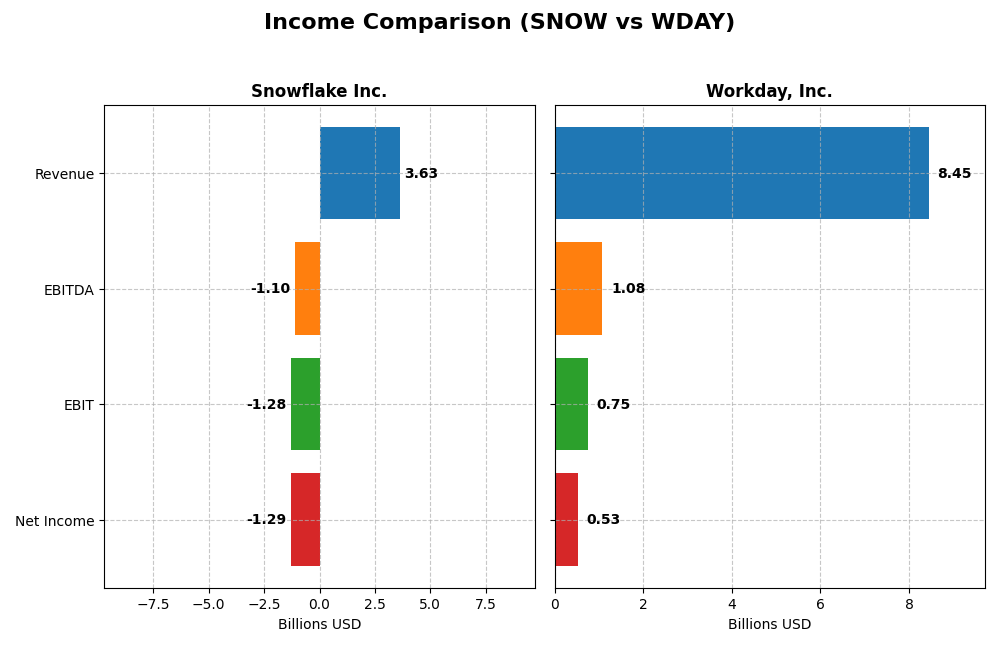
| Metric | Snowflake Inc. (SNOW) | Workday, Inc. (WDAY) |
|---|---|---|
| Market Cap | 70.4B | 49.9B |
| Revenue | 3.63B | 8.45B |
| EBITDA | -1.10B | 1.08B |
| EBIT | -1.28B | 752M |
| Net Income | -1.29B | 526M |
| EPS | -3.86 | 1.98 |
| Fiscal Year | 2025 | 2025 |
Income Statement Interpretations
Snowflake Inc.
Snowflake’s revenue increased substantially from 592M in 2021 to 3.63B in 2025, a growth of over 500%. However, net income remained negative, widening from -539M to -1.29B over the same period. Gross margin is strong and favorable at 66.5%, but the EBIT margin and net margin are deeply negative, reflecting ongoing high expenses and losses. In 2025, revenue growth accelerated by 29% while EBIT declined by 51%, indicating margin deterioration despite top-line gains.
Workday, Inc.
Workday displayed consistent revenue growth, rising from 4.32B in 2021 to 8.45B in 2025, nearly doubling over five years. Net income turned positive and grew from a loss of -282M in 2021 to a profit of 526M in 2025. Gross margin is robust at 75.5%, with a modestly positive EBIT margin of 8.9%. The fiscal year 2025 saw revenue increase by 16.35% and EBIT surge 60%, though net margin growth declined, signaling some pressure on profitability despite operational improvements.
Which one has the stronger fundamentals?
Workday demonstrates stronger fundamentals due to positive net income growth, improving margins, and a predominantly favorable income statement evaluation. Snowflake, while showing impressive revenue expansion and a solid gross margin, struggles with sustained losses and negative EBIT margins. The mixed signals in Snowflake’s profitability contrast with Workday’s more balanced financial improvements, suggesting a more stable earnings trajectory for Workday.
Financial Ratios Comparison
Below is a comparison of key financial ratios for Snowflake Inc. (SNOW) and Workday, Inc. (WDAY) based on their most recent fiscal year data (2025).
| Ratios | Snowflake Inc. (SNOW) | Workday, Inc. (WDAY) |
|---|---|---|
| ROE | -42.9% | 5.8% |
| ROIC | -25.2% | 2.7% |
| P/E | -47.0 | 132.2 |
| P/B | 20.1 | 7.7 |
| Current Ratio | 1.75 | 1.85 |
| Quick Ratio | 1.75 | 1.85 |
| D/E (Debt-to-Equity) | 0.90 | 0.37 |
| Debt-to-Assets | 29.7% | 18.7% |
| Interest Coverage | -528 | 3.64 |
| Asset Turnover | 0.40 | 0.47 |
| Fixed Asset Turnover | 5.53 | 5.36 |
| Payout ratio | 0% | 0% |
| Dividend yield | 0% | 0% |
Interpretation of the Ratios
Snowflake Inc.
Snowflake’s financial ratios show several weaknesses, including negative net margin (-35.45%), poor return on equity (-42.86%) and invested capital (-25.24%), and unfavorable interest coverage. However, liquidity ratios like current and quick ratio at 1.75 are favorable. Snowflake does not pay dividends, likely due to negative profitability and ongoing reinvestment in growth and R&D.
Workday, Inc.
Workday presents a more balanced ratio profile with a positive net margin (6.23%) but modest returns on equity (5.82%) and invested capital (2.73%) marked as unfavorable. Liquidity and leverage ratios are mostly favorable, including a current ratio of 1.85 and debt-to-equity of 0.37. Workday also does not distribute dividends, possibly focusing on reinvestment and growth strategies.
Which one has the best ratios?
Comparing both, Workday exhibits a more neutral overall ratio evaluation with a better balance between favorable and unfavorable metrics. Snowflake faces more pronounced profitability and coverage challenges, leading to a slightly unfavorable rating. Workday’s stronger liquidity and debt management tilt the ratio assessment in its favor despite some weak returns.
Strategic Positioning
This section compares the strategic positioning of Snowflake Inc. and Workday, Inc. based on market position, key segments, and exposure to technological disruption:
Snowflake Inc.
- Positioned as a cloud-based data platform with 70B market cap amid competitive software application sector.
- Key driver is Product revenue from Data Cloud platform, totaling 3.46B in 2025, supported by professional services.
- Exposure through cloud data consolidation technology but no explicit details on disruption risks provided.
Workday, Inc.
- Enterprise cloud applications provider with 50B market cap competing in broad software application market.
- Main revenue from Subscription Services at 7.72B in 2025, complemented by professional services.
- Faces disruption risks in cloud applications with embedded machine learning and augmented analytics capabilities.
Snowflake Inc. vs Workday, Inc. Positioning
Snowflake focuses on a concentrated data platform business generating most revenue from product sales, while Workday has a diversified portfolio emphasizing subscription services across finance and human capital management, offering broader business solutions.
Which has the best competitive advantage?
Both companies are shedding value with ROIC below WACC; however, Workday shows improving profitability trends, suggesting a slightly stronger competitive moat compared to Snowflake’s very unfavorable declining returns.
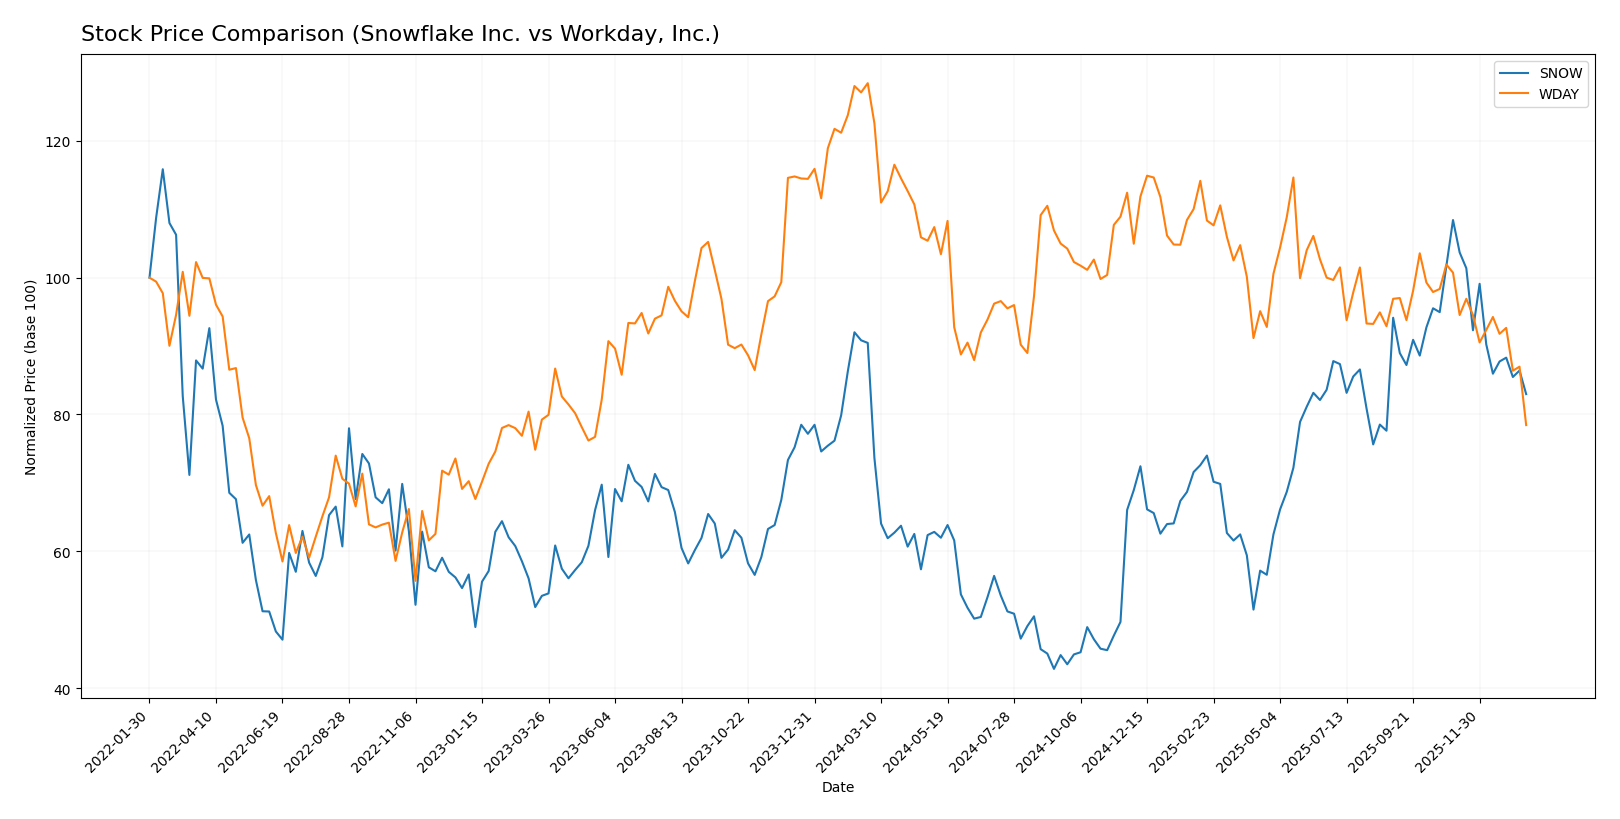
Stock Comparison
The stock prices of Snowflake Inc. and Workday, Inc. over the past year reveal pronounced bearish trends with notable deceleration and significant price declines, highlighting distinct trading dynamics and volume shifts.
Trend Analysis
Snowflake Inc. experienced a bearish trend with an 8.27% price decrease over the past 12 months, showing deceleration in the downtrend. The stock fluctuated between $108.56 and $274.88 with high volatility (std deviation 42.6).
Workday, Inc. also followed a bearish trend with a sharper 38.91% price decline over the same period, decelerating as well. Its price ranged from $186.86 to $305.88 with moderate volatility (std deviation 20.22).
Comparing both stocks, Workday, Inc. showed the largest market performance loss, underperforming Snowflake Inc. by a wide margin during the last year.
Target Prices
The current analyst consensus reveals bullish target prices for both Snowflake Inc. and Workday, Inc.
| Company | Target High | Target Low | Consensus |
|---|---|---|---|
| Snowflake Inc. | 325 | 237 | 281.86 |
| Workday, Inc. | 320 | 235 | 274.47 |
Analysts expect Snowflake’s price to rise significantly from the current 210.38 USD, while Workday’s consensus target also suggests upside potential from its 186.86 USD price.
Analyst Opinions Comparison
This section compares analysts’ ratings and grades for Snowflake Inc. and Workday, Inc.:
Rating Comparison
Snowflake Inc. Rating
- Rating: C-, considered Very Favorable overall rating by analysts.
- Discounted Cash Flow Score: Moderate score of 3 indicates an average valuation outlook.
- ROE Score: Very Unfavorable score of 1, indicating low efficiency in generating profits.
- ROA Score: Very Unfavorable score of 1, showing poor asset utilization.
- Debt To Equity Score: Very Unfavorable score of 1, indicating higher financial risk.
- Overall Score: Very Unfavorable score of 1, showing weak overall financial health.
Workday, Inc. Rating
- Rating: B-, considered Very Favorable overall rating by analysts.
- Discounted Cash Flow Score: Favorable score of 4 suggests a positive valuation outlook.
- ROE Score: Moderate score of 3, reflecting decent profit generation efficiency.
- ROA Score: Moderate score of 3, demonstrating reasonable asset use effectiveness.
- Debt To Equity Score: Moderate score of 2, indicating a more balanced financial risk.
- Overall Score: Moderate score of 2, reflecting better overall financial standing.
Which one is the best rated?
Based strictly on the provided data, Workday, Inc. is better rated than Snowflake Inc., with higher scores in discounted cash flow, ROE, ROA, debt-to-equity, and overall financial health.
Scores Comparison
Here is a comparison of the Altman Z-Score and Piotroski Score for Snowflake Inc. and Workday, Inc.:
SNOW Scores
- Altman Z-Score: 5.36, indicating a safe zone with low bankruptcy risk.
- Piotroski Score: 4, classified as average financial strength.
WDAY Scores
- Altman Z-Score: 4.41, indicating a safe zone with low bankruptcy risk.
- Piotroski Score: 6, classified as average financial strength.
Which company has the best scores?
Both firms are in the Altman Z-Score safe zone, but SNOW scores higher on this measure. WDAY has a higher Piotroski Score, suggesting relatively stronger financial health by that metric.
Grades Comparison
Here is the grades comparison of Snowflake Inc. and Workday, Inc. by various grading companies:
Snowflake Inc. Grades
The following table summarizes Snowflake Inc.’s recent grades from reputable grading firms.
| Grading Company | Action | New Grade | Date |
|---|---|---|---|
| Barclays | Downgrade | Equal Weight | 2026-01-12 |
| Argus Research | Upgrade | Buy | 2026-01-08 |
| Citigroup | Maintain | Buy | 2025-12-08 |
| Wells Fargo | Maintain | Overweight | 2025-12-04 |
| Keybanc | Maintain | Overweight | 2025-12-04 |
| Piper Sandler | Maintain | Overweight | 2025-12-04 |
| Morgan Stanley | Maintain | Overweight | 2025-12-04 |
| Wedbush | Maintain | Outperform | 2025-12-04 |
| Deutsche Bank | Maintain | Buy | 2025-12-04 |
| Cantor Fitzgerald | Maintain | Overweight | 2025-12-04 |
Snowflake shows mostly stable overweight and buy ratings, with a recent downgrade by Barclays to equal weight balanced by an upgrade from Argus Research.
Workday, Inc. Grades
Below is the summary of Workday, Inc.’s grades from established grading companies.
| Grading Company | Action | New Grade | Date |
|---|---|---|---|
| Barclays | Maintain | Overweight | 2026-01-12 |
| RBC Capital | Maintain | Outperform | 2026-01-05 |
| TD Cowen | Maintain | Buy | 2025-11-26 |
| DA Davidson | Maintain | Neutral | 2025-11-26 |
| Wells Fargo | Maintain | Overweight | 2025-11-26 |
| Barclays | Maintain | Overweight | 2025-11-26 |
| Keybanc | Maintain | Overweight | 2025-11-26 |
| Citigroup | Maintain | Neutral | 2025-11-26 |
| JP Morgan | Maintain | Overweight | 2025-11-26 |
| UBS | Maintain | Neutral | 2025-11-26 |
Workday’s grades are steady, with multiple overweight ratings and some neutral assessments, indicating a generally positive but cautious outlook.
Which company has the best grades?
Both Snowflake Inc. and Workday, Inc. show predominantly buy and overweight grades from well-known analysts, reflecting positive sentiment. Snowflake has more buy and outperform ratings, while Workday has a mix of overweight and neutral grades. This pattern may influence investors differently depending on risk tolerance and confidence in growth prospects.
Strengths and Weaknesses
Below is a comparison of key strengths and weaknesses for Snowflake Inc. (SNOW) and Workday, Inc. (WDAY) based on their recent financial and operational data.
| Criterion | Snowflake Inc. (SNOW) | Workday, Inc. (WDAY) |
|---|---|---|
| Diversification | Focused mainly on cloud data platform products; limited professional services revenue (~$164M in 2025). | Strong subscription services ($7.72B in 2025) plus professional services (~$728M), showing broader revenue sources. |
| Profitability | Negative net margin (-35.45%) and ROIC (-25.24%), value destroying, declining profitability. | Slightly profitable with net margin 6.23%, ROIC positive but below WACC, improving profitability trend. |
| Innovation | High fixed asset turnover (5.53) indicates operational efficiency; however, heavy value destruction signals weak competitive moat. | Also strong fixed asset turnover (5.36); growing ROIC trend suggests improving competitive positioning. |
| Global presence | Moderate current and quick ratios (1.75), manageable debt (D/E 0.9), but unfavorable interest coverage. | Better liquidity (1.85 current ratio), lower debt (D/E 0.37), and healthy interest coverage (6.6). |
| Market Share | Rapid revenue growth in products (up to $3.46B in 2025) but struggling to convert to profits. | Larger and more stable subscription revenue base ($7.72B in 2025), with consistent growth and improving margins. |
Key takeaways: Workday shows a more balanced business model with positive profitability trends and better financial health, despite modest valuation concerns. Snowflake demonstrates strong top-line growth but struggles with sustained profitability and value creation, indicating higher investment risk.
Risk Analysis
Below is a comparative table outlining the key risk factors for Snowflake Inc. (SNOW) and Workday, Inc. (WDAY) based on their latest financial and operational data for 2025.
| Metric | Snowflake Inc. (SNOW) | Workday, Inc. (WDAY) |
|---|---|---|
| Market Risk | Beta 1.144, moderate market volatility | Beta 1.142, moderate market volatility |
| Debt level | Debt-to-Equity 0.9 (neutral) | Debt-to-Equity 0.37 (favorable) |
| Regulatory Risk | Moderate, tech sector scrutiny | Moderate, cloud enterprise regulation |
| Operational Risk | Negative net margin (-35.45%), ROE (-42.86%) | Modest net margin (6.23%), ROE (5.82%) |
| Environmental Risk | Moderate, typical for software companies | Moderate, typical for software companies |
| Geopolitical Risk | US-based, global exposure | US-based, global exposure |
Snowflake faces higher operational risks due to its significant negative profitability and weak return metrics, despite a healthy liquidity position and manageable debt. Workday shows better financial stability with lower leverage and positive margins but faces valuation risks with high P/E and P/B ratios. Market and regulatory risks remain moderate for both, with geopolitical exposure linked to their international presence.
Which Stock to Choose?
Snowflake Inc. shows strong revenue growth of 29.2% in 2025 but suffers from negative profitability with a net margin of -35.45% and declining returns on equity and capital employed. Its debt level is moderate, and the financial ratios reveal a slightly unfavorable profile overall. The company’s rating is very favorable, although key profitability scores are very unfavorable.
Workday, Inc. experienced solid income growth of 16.4% in 2025 with a positive net margin of 6.23% and improving returns on assets and equity. Debt ratios are favorable, and the financial ratios present a neutral stance overall. Its rating is very favorable with moderate scores across profitability and debt metrics.
For investors seeking growth potential, Snowflake’s rapid revenue expansion might appear attractive despite its current profitability challenges. Conversely, Workday’s stable profitability and improving returns could be more suitable for those prioritizing financial stability and consistent value creation. The choice may depend on an investor’s risk tolerance and strategic focus.
Disclaimer: Investment carries a risk of loss of initial capital. The past performance is not a reliable indicator of future results. Be sure to understand risks before making an investment decision.
Go Further
I encourage you to read the complete analyses of Snowflake Inc. and Workday, Inc. to enhance your investment decisions: