Home > Comparison > Technology > UBER vs SNOW
The strategic rivalry between Uber Technologies, Inc. and Snowflake Inc. shapes the evolution of the technology sector. Uber operates a capital-intensive, global mobility and delivery platform, while Snowflake delivers a high-margin, cloud-based data platform. This head-to-head pits platform scale against data innovation. This analysis will determine which business model offers superior risk-adjusted returns for a diversified portfolio in today’s dynamic tech landscape.
Table of contents
Companies Overview
Uber Technologies and Snowflake Inc. shape the future of digital services through mobility and cloud data innovation.
Uber Technologies, Inc.: Global Leader in Mobility and Delivery
Uber dominates the mobility sector by connecting millions with independent ride providers worldwide. Its core revenue derives from Mobility, Delivery, and Freight segments, offering rides, food delivery, and logistics solutions. In 2026, Uber focuses strategically on expanding its platform ecosystem and enhancing financial partnerships to deepen market penetration across multiple continents.
Snowflake Inc.: Pioneer in Cloud Data Platforms
Snowflake commands the cloud data market by offering a Data Cloud platform that centralizes data for analytics and application development. Its revenue engine relies on subscription-based services that empower enterprises with scalable data consolidation and sharing. In 2026, Snowflake sharpens its focus on broadening its customer base and advancing platform capabilities to maintain its competitive edge in cloud innovation.
Strategic Collision: Similarities & Divergences
Both companies leverage technology-driven platforms but diverge in business philosophies—Uber pursues a broad, multi-service mobility ecosystem, while Snowflake emphasizes an open, scalable data infrastructure. Their primary battleground lies in capturing enterprise and consumer engagement through seamless digital experiences. Uber offers a diversified service portfolio, whereas Snowflake presents a specialized growth profile anchored in cloud data dominance.
Income Statement Comparison
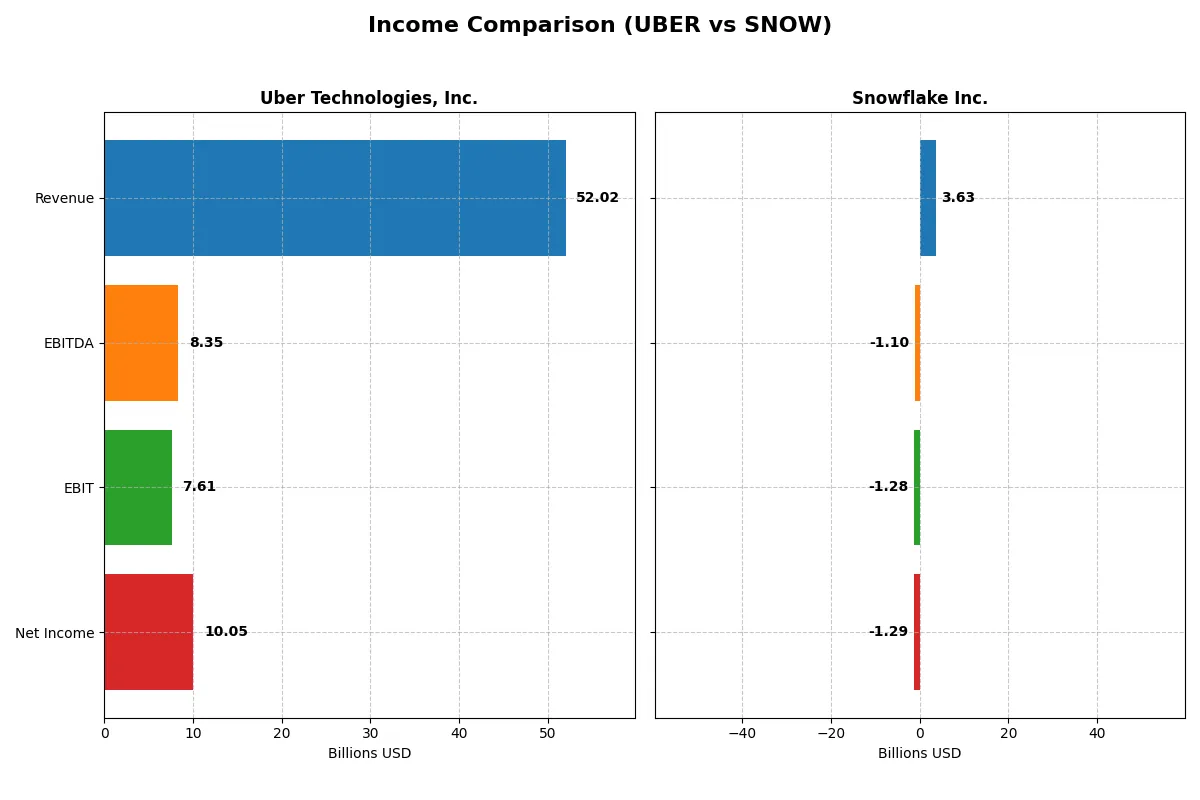
This data dissects the core profitability and scalability of both corporate engines to reveal who dominates the bottom line:
| Metric | Uber Technologies, Inc. (UBER) | Snowflake Inc. (SNOW) |
|---|---|---|
| Revenue | 52B | 3.6B |
| Cost of Revenue | 31.3B | 1.2B |
| Operating Expenses | 15.1B | 3.9B |
| Gross Profit | 20.7B | 2.4B |
| EBITDA | 8.3B | -1.1B |
| EBIT | 7.6B | -1.3B |
| Interest Expense | 440M | 2.8M |
| Net Income | 10B | -1.3B |
| EPS | 4.82 | -3.86 |
| Fiscal Year | 2025 | 2025 |
Income Statement Analysis: The Bottom-Line Duel
This income statement comparison reveals which company runs a more efficient and sustainable profit engine through their recent financial performance.
Uber Technologies, Inc. Analysis
Uber’s revenue surged from $17.5B in 2021 to $52B in 2025, with net income exploding from a loss of $496M to a $10B profit. Gross margins improve steadily, hitting 39.8% in 2025, while net margins reflect solid profitability near 19.3%. The latest year shows exceptional operating leverage, with EBIT growing 64% year-over-year, signaling strong momentum.
Snowflake Inc. Analysis
Snowflake’s revenue expanded impressively from $592M in 2021 to $3.6B in 2025, maintaining a robust 66.5% gross margin. However, net losses deepened to -$1.29B in 2025, with negative net and EBIT margins around -35%. Despite strong top-line growth, profitability metrics deteriorate, reflecting high operating expenses and ongoing investment pressures.
Margin Strength vs. Growth Ambitions
Uber clearly leads in bottom-line profitability and margin expansion, turning massive revenue gains into solid earnings. Snowflake excels in revenue growth and gross margin but struggles to convert this into profit, weighed down by heavy operating costs. For investors prioritizing efficiency and profitability, Uber’s profile stands out as more fundamentally attractive.
Financial Ratios Comparison
These vital ratios act as a diagnostic tool to expose the underlying fiscal health, valuation premiums, and capital efficiency of the companies compared below:
| Ratios | Uber Technologies, Inc. (UBER) | Snowflake Inc. (SNOW) |
|---|---|---|
| ROE | 45.7% (2024) | -42.9% (2025) |
| ROIC | 6.8% (2024) | -25.2% (2025) |
| P/E | 12.8 (2024) | Negative (2025) |
| P/B | 5.86 (2024) | 20.13 (2025) |
| Current Ratio | 1.07 (2024) | 1.75 (2025) |
| Quick Ratio | 1.07 (2024) | 1.75 (2025) |
| D/E | 0.53 (2024) | 0.90 (2025) |
| Debt-to-Assets | 22.3% (2024) | 29.7% (2025) |
| Interest Coverage | 5.35 (2024) | Negative (2025) |
| Asset Turnover | 0.86 (2024) | 0.40 (2025) |
| Fixed Asset Turnover | 14.14 (2024) | 5.53 (2025) |
| Payout Ratio | 0% (2024) | 0% (2025) |
| Dividend Yield | 0% (2024) | 0% (2025) |
| Fiscal Year | 2024 | 2025 |
Efficiency & Valuation Duel: The Vital Signs
Financial ratios act as a company’s DNA, unmasking hidden risks and revealing operational strengths and weaknesses in clear, measurable terms.
Uber Technologies, Inc.
Uber posts a robust 19.33% net margin, signaling operational efficiency despite a 0% ROE and ROIC, which suggest limited returns on equity and invested capital. Its P/E ratio at 16.85 appears fairly valued. Uber pays no dividend, likely reinvesting in growth and R&D, which supports its long-term expansion strategy amid moderate financial leverage and favorable interest coverage.
Snowflake Inc.
Snowflake carries a steep net margin loss of -35.45% and a deeply negative ROE of -42.86%, reflecting ongoing profitability challenges. Its P/E ratio is negative, indicating losses, while a high P/B ratio of 20.13 flags potential overvaluation. Snowflake maintains a strong current ratio of 1.75 but offers no dividend, focusing capital on heavy R&D investments to fuel future growth in a competitive cloud market.
Prudent Growth vs. Risky Expansion
Both companies share slightly unfavorable global ratio profiles, yet Uber balances moderate profitability with fair valuation and sound cash flow. Snowflake’s high valuation and deep losses signal greater risk but potential for high growth. Investors seeking operational steadiness may favor Uber, while those targeting aggressive growth might consider Snowflake’s profile.
Which one offers the Superior Shareholder Reward?
Uber Technologies, Inc. and Snowflake Inc. both forego dividends, focusing on reinvestment and buybacks. Uber’s free cash flow per share stands at $4.7, nearly double Snowflake’s $2.7, fueling a modest but consistent buyback program. Snowflake prioritizes aggressive R&D and growth, reflected in its negative margins and high price multiples. Uber’s lower leverage and positive net margins suggest a more sustainable capital return model. I find Uber offers a superior total shareholder reward in 2026 due to stronger free cash flow generation and prudent buyback intensity. Snowflake’s growth strategy carries higher risk and delayed shareholder payoff.
Comparative Score Analysis: The Strategic Profile
The radar chart reveals the fundamental DNA and trade-offs of Uber Technologies, Inc. and Snowflake Inc., highlighting their strategic financial profiles:
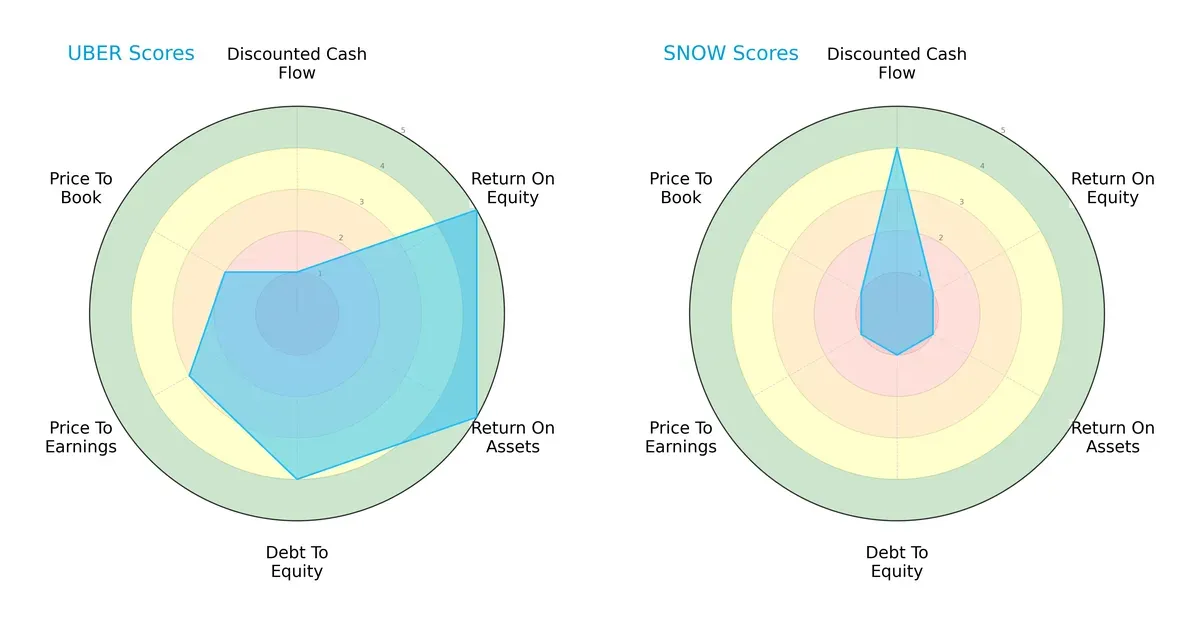
Uber shows a more balanced scorecard with strong ROE (5) and ROA (5), indicating efficient profit and asset use. It maintains a favorable debt-to-equity (4) and moderate valuation scores (P/E 3, P/B 2). Snowflake relies heavily on discounted cash flow strength (4) but scores very low in profitability and financial stability metrics (ROE 1, ROA 1, Debt/Equity 1, P/E 1, P/B 1). Uber’s profile suggests sustainable operations, while Snowflake depends on growth potential.
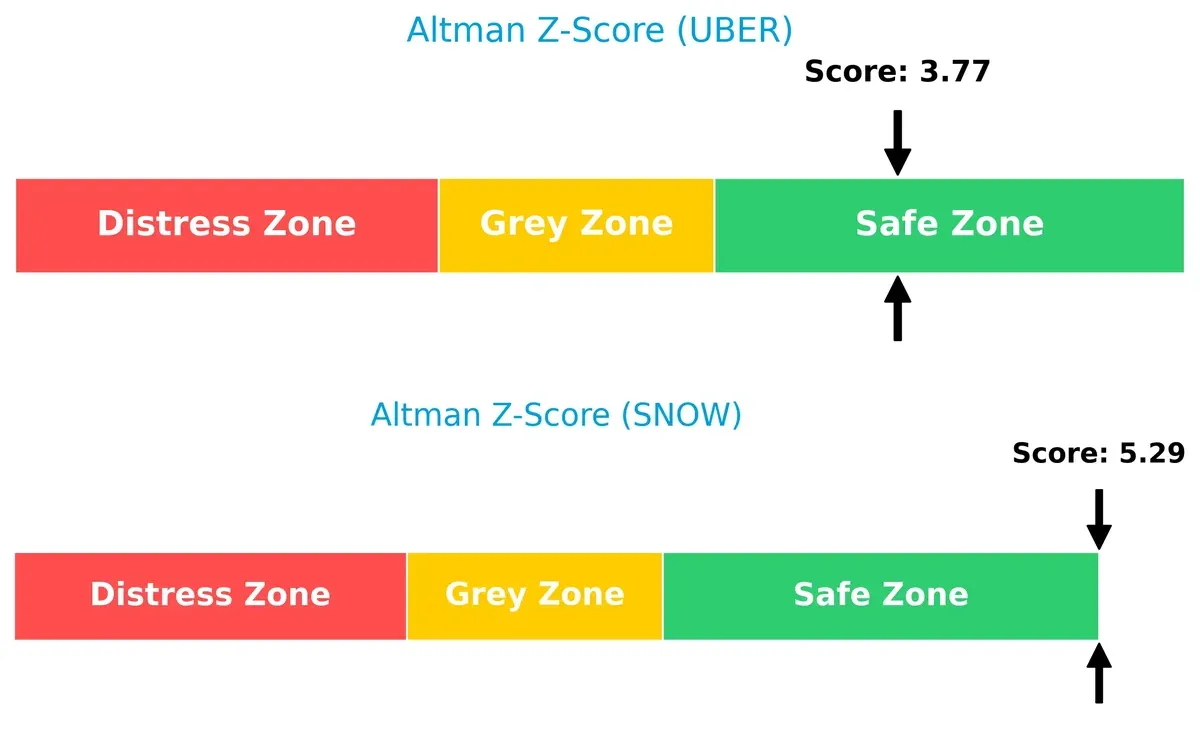
Bankruptcy Risk: Solvency Showdown
Uber’s Altman Z-Score stands at 3.77, while Snowflake’s is 5.29, both firmly in the safe zone, indicating strong long-term survival prospects in this cycle:
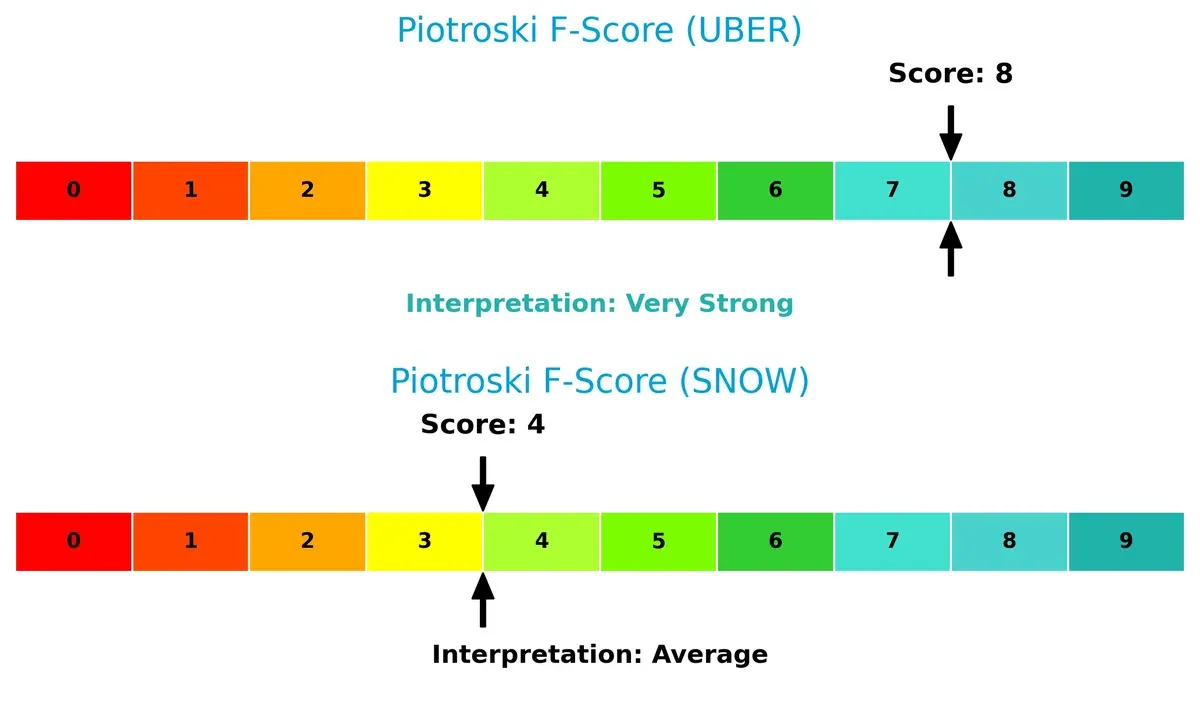
Financial Health: Quality of Operations
Uber scores an impressive 8 on the Piotroski F-Score, signaling very strong financial health. Snowflake’s score of 4 reflects average internal metrics, with potential red flags compared to Uber’s robust operational quality:
How are the two companies positioned?
This section dissects Uber and Snowflake’s operational DNA by comparing revenue distribution and internal strengths and weaknesses. The goal is to confront their economic moats to identify which business model offers the most resilient, sustainable competitive advantage today.
Revenue Segmentation: The Strategic Mix
This comparison dissects how Uber Technologies and Snowflake diversify their income streams and where their primary sector bets lie:
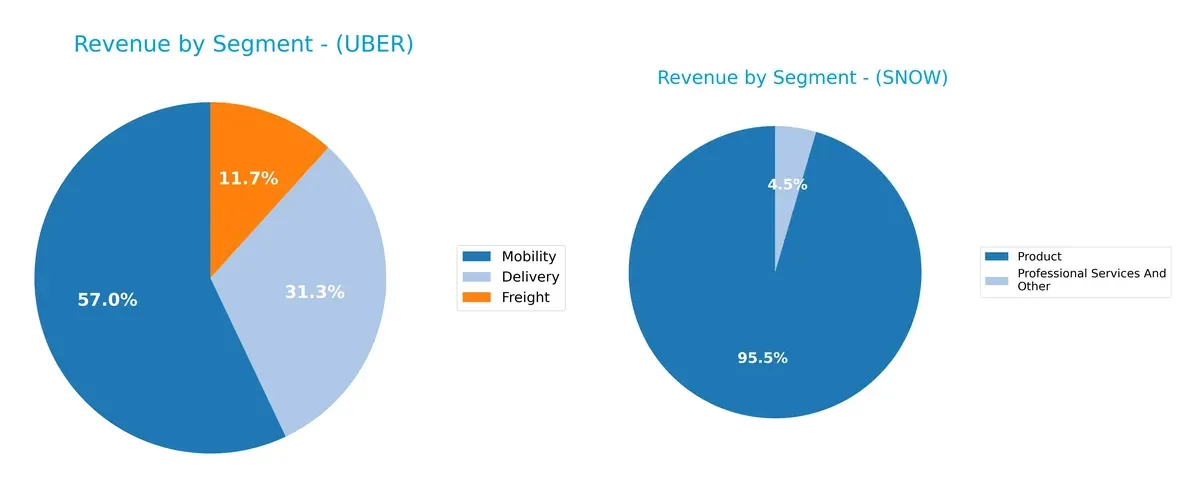
Uber anchors its revenue in Mobility with $25B, supported by Delivery at $13.7B and Freight at $5.1B, showcasing a diversified ecosystem across transport and logistics. Snowflake, by contrast, pivots almost entirely on its Product segment at $3.46B, with minimal Professional Services income. Uber’s mix reduces concentration risk and leverages network effects, while Snowflake’s reliance on one segment signals high growth potential but greater vulnerability to market shifts.
Strengths and Weaknesses Comparison
This table compares the strengths and weaknesses of Uber and Snowflake across key financial and strategic dimensions:
Uber Strengths
- Diversified revenue from Delivery, Freight, and Mobility segments
- Strong global presence across US, EMEA, Asia Pacific, Latin America
- Favorable net margin at 19.33%
- Low debt-to-assets ratio enhances financial stability
- High interest coverage ratio at 17.29
Snowflake Strengths
- Favorable current and quick ratios at 1.75 imply solid liquidity
- Favorable debt-to-assets ratio supports moderate leverage
- High fixed asset turnover at 5.53 indicates efficient asset use
- Growing product revenue reaching $3.46B in 2025
- Strong US market presence accounting for majority revenue
Uber Weaknesses
- Unfavorable ROE and ROIC at 0%, signaling weak capital returns
- Unfavorable liquidity ratios (current and quick) at 0
- No available WACC data limits cost of capital assessment
- Unfavorable asset and fixed asset turnover ratios
- No dividend yield, which may deter income investors
Snowflake Weaknesses
- Negative net margin and ROE at -35.45% and -42.86% reflect losses
- Unfavorable interest coverage at -464.78 suggests financial distress
- High P/B ratio at 20.13 indicates possible overvaluation
- Unfavorable asset turnover at 0.4 suggests lower operational efficiency
- No dividend yield, limiting income appeal
Uber’s diversified operations and strong margin contrast with liquidity and efficiency challenges. Snowflake shows liquidity strength but faces profitability and valuation hurdles. Both companies exhibit areas requiring strategic focus to enhance financial health.
The Moat Duel: Analyzing Competitive Defensibility
A durable structural moat is the sole barrier protecting long-term profits from relentless competitive erosion. Let’s break down the battleground:
Uber Technologies, Inc.: Network Effects Powering Scale and Efficiency
Uber’s moat stems from powerful network effects linking millions of riders and drivers globally. This fuels margin stability and a growing ROIC trend, signaling efficient capital use. Expansion into delivery and freight markets in 2026 could deepen this advantage but requires vigilance against regulatory risks.
Snowflake Inc.: Intangible Assets and Data Ecosystem Lock-in
Snowflake’s moat arises from proprietary data cloud technology and customer lock-in via intangible assets. However, its declining ROIC and negative net margins reveal operational challenges. Growth in new data services markets offers expansion potential but demands sharper capital discipline to reverse value erosion.
Network Scale vs. Data Ecosystem: Uber’s Wide Moat Outpaces Snowflake’s Struggles
Uber’s growing ROIC and robust network effects create a wider, more sustainable moat than Snowflake’s shrinking profitability and value-destroying capital returns. Uber stands better equipped to defend and extend market share in a competitive landscape.
Which stock offers better returns?
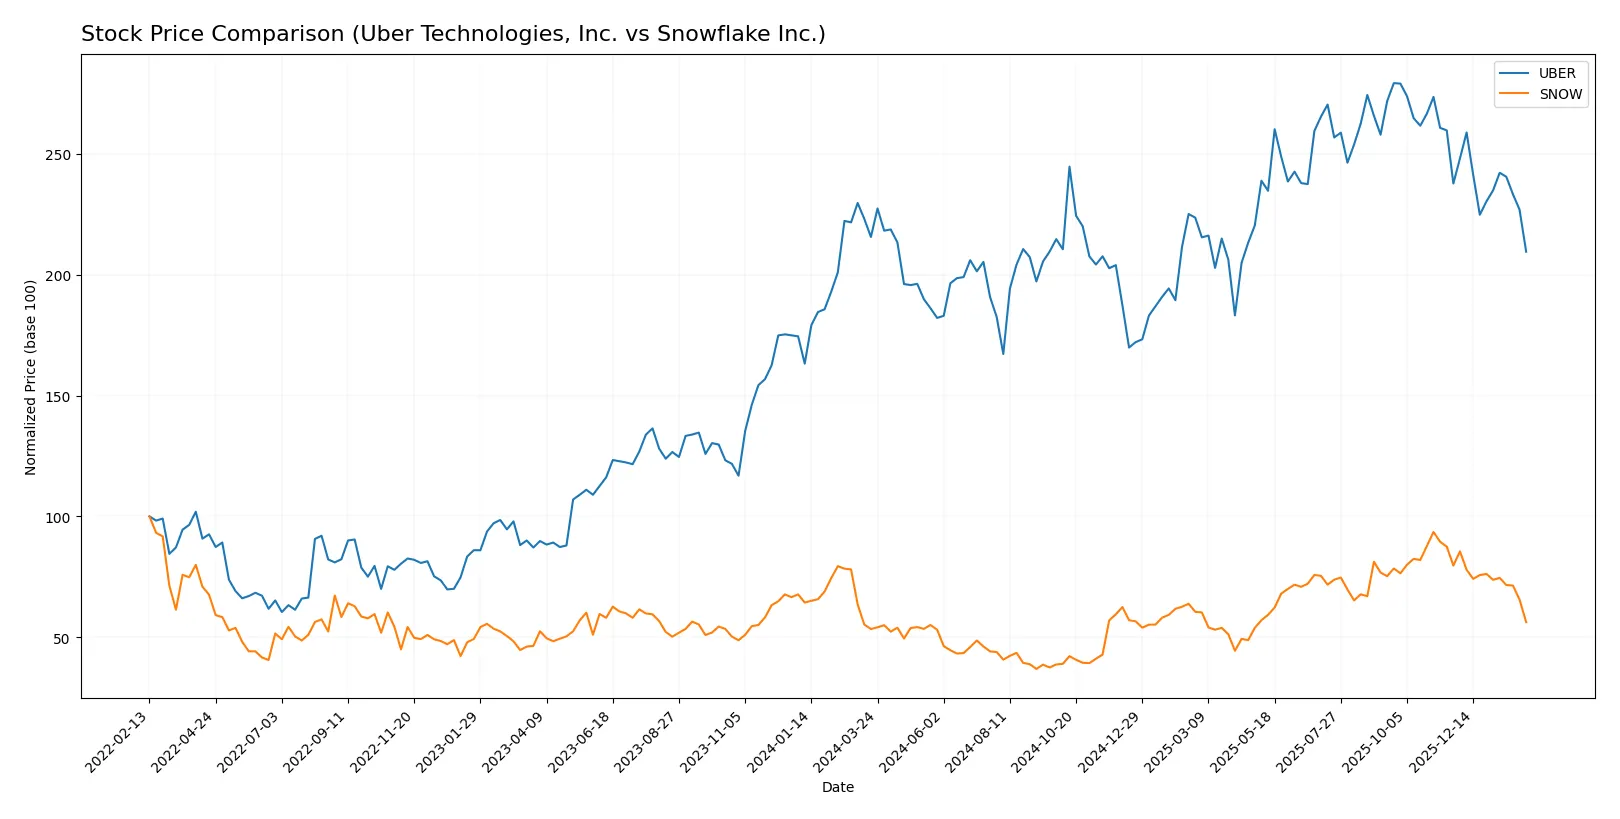
The past year reveals contrasting dynamics: Uber’s shares declined steadily, while Snowflake’s price rose overall despite recent sharp drops.
Trend Comparison
Uber Technologies, Inc. shows a bearish trend over the past 12 months, with a -2.83% price change and decelerating decline. The price ranged between 59 and 98.5, with volatility at 10.3.
Snowflake Inc. exhibits a bullish trend over 12 months, rising 5.3% despite deceleration. Its price fluctuated widely from 109 to 275, reflecting high volatility at 42.4.
Snowflake outperformed Uber in market returns over the year. However, both stocks faced recent steep declines and seller dominance in volume, indicating caution.
Target Prices
Analysts present a solid target consensus reflecting confidence in both Uber Technologies and Snowflake Inc.
| Company | Target Low | Target High | Consensus |
|---|---|---|---|
| Uber Technologies, Inc. | 73 | 140 | 110.1 |
| Snowflake Inc. | 237 | 325 | 281.86 |
Uber’s consensus target of 110.1 suggests a 49% upside from the current 73.92 stock price. Snowflake’s 281.86 target predicts a substantial 70% gain from today’s 165.29 price.

Don’t Let Luck Decide Your Entry Point
Optimize your entry points with our advanced ProRealTime indicators. You’ll get efficient buy signals with precise price targets for maximum performance. Start outperforming now!
How do institutions grade them?
Here is the comparison of recent institutional grades for Uber Technologies, Inc. and Snowflake Inc.:
Uber Technologies, Inc. Grades
The table below shows the latest grades assigned to Uber by reputable firms.
| Grading Company | Action | New Grade | Date |
|---|---|---|---|
| BTIG | Maintain | Buy | 2026-02-04 |
| Needham | Maintain | Buy | 2026-02-03 |
| Stifel | Maintain | Buy | 2026-01-27 |
| Guggenheim | Maintain | Buy | 2026-01-22 |
| Keybanc | Maintain | Overweight | 2026-01-20 |
| BTIG | Maintain | Buy | 2026-01-15 |
| Cantor Fitzgerald | Maintain | Overweight | 2026-01-08 |
| Wells Fargo | Maintain | Overweight | 2026-01-08 |
| Wolfe Research | Maintain | Outperform | 2026-01-06 |
| Wedbush | Maintain | Neutral | 2025-12-19 |
Snowflake Inc. Grades
Below is the summary of Snowflake’s ratings from credible grading institutions.
| Grading Company | Action | New Grade | Date |
|---|---|---|---|
| DA Davidson | Maintain | Buy | 2026-01-30 |
| Morgan Stanley | Maintain | Overweight | 2026-01-27 |
| Barclays | Downgrade | Equal Weight | 2026-01-12 |
| Argus Research | Upgrade | Buy | 2026-01-08 |
| Citigroup | Maintain | Buy | 2025-12-08 |
| Keybanc | Maintain | Overweight | 2025-12-04 |
| Needham | Maintain | Buy | 2025-12-04 |
| Cantor Fitzgerald | Maintain | Overweight | 2025-12-04 |
| Stifel | Maintain | Buy | 2025-12-04 |
| BTIG | Maintain | Buy | 2025-12-04 |
Which company has the best grades?
Uber consistently receives Buy or Overweight ratings, indicating broad institutional confidence. Snowflake’s grades are generally Buy or Overweight but include a recent downgrade to Equal Weight. Uber’s more stable positive consensus may suggest lower perceived risk for investors.
Risks specific to each company
The following categories identify the critical pressure points and systemic threats facing both firms in the 2026 market environment:
1. Market & Competition
Uber Technologies, Inc.
- Faces intense competition in ride-sharing and delivery, with pressure on pricing and margins.
Snowflake Inc.
- Competes in a crowded cloud data platform market, challenged by larger incumbents and rapid innovation cycles.
2. Capital Structure & Debt
Uber Technologies, Inc.
- Maintains favorable debt metrics with strong interest coverage, indicating manageable financial risk.
Snowflake Inc.
- Carries moderate debt levels with weak interest coverage, raising concerns about debt servicing capacity.
3. Stock Volatility
Uber Technologies, Inc.
- Beta of 1.21 suggests slightly higher volatility than the market, typical for tech growth stocks.
Snowflake Inc.
- Beta of 1.15 indicates high but somewhat lower volatility, reflecting cloud sector dynamics.
4. Regulatory & Legal
Uber Technologies, Inc.
- Subject to evolving gig economy labor laws and regional regulatory scrutiny worldwide.
Snowflake Inc.
- Faces data privacy regulations and compliance risks in multiple jurisdictions impacting operations.
5. Supply Chain & Operations
Uber Technologies, Inc.
- Operational complexity across global markets with dependence on independent drivers and delivery partners.
Snowflake Inc.
- Relies on cloud infrastructure providers and network stability; operational disruptions could impair service.
6. ESG & Climate Transition
Uber Technologies, Inc.
- Increasing pressure to reduce carbon footprint in mobility and delivery segments.
Snowflake Inc.
- Focus on sustainable data centers and energy-efficient cloud services amid investor ESG demands.
7. Geopolitical Exposure
Uber Technologies, Inc.
- Global footprint exposes it to geopolitical risks, including trade tensions and regulatory arbitrage.
Snowflake Inc.
- International operations expose it to geopolitical uncertainties impacting data sovereignty and cross-border flows.
Which company shows a better risk-adjusted profile?
Uber’s strongest risk lies in market competition and regulatory challenges, yet it benefits from solid debt management and financial stability. Snowflake’s biggest risk is its capital structure, with poor interest coverage and weak profitability signaling financial vulnerability. Uber’s higher Altman Z-Score (3.77) and very strong Piotroski score (8) underpin a safer risk-adjusted profile. Snowflake’s mixed scores and negative margins confirm a riskier stance. The contrast in interest coverage—Uber at 17.29 vs. Snowflake’s -464.78—highlights urgent financial health concerns for Snowflake in 2026.
Final Verdict: Which stock to choose?
Uber’s superpower lies in its operational efficiency and strong cash generation, evidenced by its improving profitability and robust free cash flow. However, its modest current liquidity ratios suggest a need for vigilance on short-term financial flexibility. Uber fits well in aggressive growth portfolios seeking companies nearing profitability inflection.
Snowflake’s strategic moat is rooted in its cloud data platform and strong recurring revenue model, offering a durable competitive advantage. It presents a safer balance sheet position relative to Uber but struggles with profitability and value destruction signals. Snowflake suits growth-at-a-reasonable-price (GARP) investors prioritizing market leadership over near-term earnings.
If you prioritize operational profitability and cash flow strength, Uber is the compelling choice due to its improving margins and financial discipline. However, if you seek exposure to innovative cloud infrastructure with better balance sheet stability, Snowflake offers superior strategic positioning despite current profitability challenges. Both carry risks, so alignment with your investment horizon and risk tolerance is critical.
Disclaimer: Investment carries a risk of loss of initial capital. The past performance is not a reliable indicator of future results. Be sure to understand risks before making an investment decision.
Go Further
I encourage you to read the complete analyses of Uber Technologies, Inc. and Snowflake Inc. to enhance your investment decisions: