In the dynamic world of technology software, Snowflake Inc. and Tyler Technologies, Inc. stand out as influential players. Both specialize in application software but serve distinct yet overlapping markets—Snowflake focuses on cloud-based data platforms, while Tyler targets integrated public sector solutions. Their innovative strategies and market presence make them compelling candidates for investment consideration. Join me as we explore which company offers the most promising opportunity for your portfolio.
Table of contents
Companies Overview
I will begin the comparison between Snowflake and Tyler Technologies by providing an overview of these two companies and their main differences.
Snowflake Overview
Snowflake Inc. provides a cloud-based data platform that enables customers to consolidate data into a single source of truth to drive business insights, build data-driven applications, and share data. Founded in 2012 and headquartered in Bozeman, Montana, Snowflake serves a diverse range of industries internationally. The company is positioned as a key player in the software-application sector with a market cap of approximately 70.4B USD.
Tyler Technologies Overview
Tyler Technologies, Inc. offers integrated information management solutions and services primarily for the public sector. Its products cover financial management, judicial solutions, public safety software, and property appraisal systems, among others. Founded in 1966 and based in Plano, Texas, Tyler operates across multiple segments with a market cap near 18.9B USD, focusing on government and educational institutions.
Key similarities and differences
Both Snowflake and Tyler Technologies operate within the technology sector, specifically in software applications. Snowflake focuses on cloud-based data platforms serving a broad industry base, while Tyler targets public sector clients with specialized management and judicial software. Snowflake’s business model is centered on data consolidation and analytics in the cloud, whereas Tyler provides integrated management solutions tailored to government and education needs.
Income Statement Comparison
The table below presents a side-by-side comparison of key income statement metrics for Snowflake Inc. and Tyler Technologies, Inc. for their most recent fiscal years.

| Metric | Snowflake Inc. (SNOW) | Tyler Technologies, Inc. (TYL) |
|---|---|---|
| Market Cap | 70.4B | 18.9B |
| Revenue | 3.63B | 2.14B |
| EBITDA | -1.10B | 466M |
| EBIT | -1.28B | 314M |
| Net Income | -1.29B | 263M |
| EPS | -3.86 | 6.17 |
| Fiscal Year | 2025 | 2024 |
Income Statement Interpretations
Snowflake Inc.
Snowflake’s revenue surged by over 500% from 2021 to 2025, reaching $3.63B in 2025, yet it reported a net loss of $1.29B that year. Gross margin remained strong at 66.5%, but EBIT and net margins stayed negative, worsening to -35.36% and -35.45%, respectively. Despite robust revenue growth in 2025 (+29.2%), earnings and margins deteriorated, reflecting rising costs.
Tyler Technologies, Inc.
Tyler Technologies showed steady revenue growth, rising 91.5% over 2020-2024 to $2.14B, with net income growing 35% to $263M in 2024. Margins were solid and improving, with a gross margin of 41.0%, EBIT margin of 14.7%, and net margin of 12.3%. The 2024 year saw favorable expansions in earnings, margins, and EPS, indicating improving profitability alongside revenue growth (+9.5%).
Which one has the stronger fundamentals?
Tyler Technologies exhibits stronger fundamentals, with consistent profitability, positive EBIT and net margins, and favorable earnings growth. Snowflake, despite impressive top-line growth and high gross margins, continues to face significant losses and negative margins. Tyler’s financial profile reflects more stable and favorable income statement metrics over the analyzed periods.
Financial Ratios Comparison
The table below compares key financial ratios for Snowflake Inc. and Tyler Technologies, Inc. based on their most recent fiscal year data, providing a snapshot of profitability, liquidity, valuation, and leverage.
| Ratios | Snowflake Inc. (2025) | Tyler Technologies, Inc. (2024) |
|---|---|---|
| ROE | -42.9% | 7.8% |
| ROIC | -25.2% | 6.2% |
| P/E | -47.0 | 93.4 |
| P/B | 20.1 | 7.3 |
| Current Ratio | 1.75 | 1.35 |
| Quick Ratio | 1.75 | 1.35 |
| D/E (Debt-to-Equity) | 0.90 | 0.19 |
| Debt-to-Assets | 29.7% | 12.3% |
| Interest Coverage | -528 | 50.5 |
| Asset Turnover | 0.40 | 0.41 |
| Fixed Asset Turnover | 5.53 | 10.95 |
| Payout Ratio | 0 | 0 |
| Dividend Yield | 0 | 0 |
Interpretation of the Ratios
Snowflake Inc.
Snowflake’s financial ratios show several weaknesses, including negative net margin (-35.45%) and return on equity (-42.86%), indicating operational challenges and low profitability. Its current and quick ratios at 1.75 are favorable, reflecting adequate liquidity. The company does not pay dividends, consistent with its negative net income and focus on reinvestment and growth in cloud data platforms.
Tyler Technologies, Inc.
Tyler Technologies displays a more balanced ratio profile with a favorable net margin of 12.3% and decent liquidity indicated by a quick ratio of 1.35. However, its return on equity is modest at 7.76%, considered unfavorable, and valuation multiples like PE (93.42) and PB (7.25) are high. Like Snowflake, it does not distribute dividends, likely prioritizing reinvestment and acquisitions.
Which one has the best ratios?
Tyler Technologies holds a slight advantage with 50% favorable ratios compared to Snowflake’s 35.7%, reflecting better profitability and financial stability. However, Tyler’s high valuation multiples and moderate returns pose concerns. Snowflake’s liquidity is stronger, but its profitability and coverage ratios are weaker, making its overall ratio assessment slightly unfavorable.
Strategic Positioning
This section compares the strategic positioning of Snowflake Inc. and Tyler Technologies, Inc., including Market position, Key segments, and Exposure to technological disruption:
Snowflake Inc.
- Market leader in cloud-based data platform with high competitive pressure in software applications.
- Key segments include cloud data platform and professional services driving growth.
- Cloud-based platform exposes it to ongoing technological innovations and disruption risks.
Tyler Technologies, Inc.
- Focused on public sector software with moderate competitive pressure.
- Diverse segments: enterprise software, appraisal and tax, SaaS, and transaction fees.
- Strategic collaboration with AWS reduces disruption risk in cloud hosting services.
Snowflake Inc. vs Tyler Technologies, Inc. Positioning
Snowflake’s strategy centers on a specialized, scalable cloud data platform, while Tyler offers diversified public sector software solutions. Snowflake faces intense competition in cloud technology; Tyler benefits from stable, multi-segment public sector demand but less growth scope.
Which has the best competitive advantage?
Both companies exhibit very unfavorable MOAT evaluations with declining ROIC below WACC, indicating value destruction and weakening competitive advantages based on current financial efficiency measures.
Stock Comparison
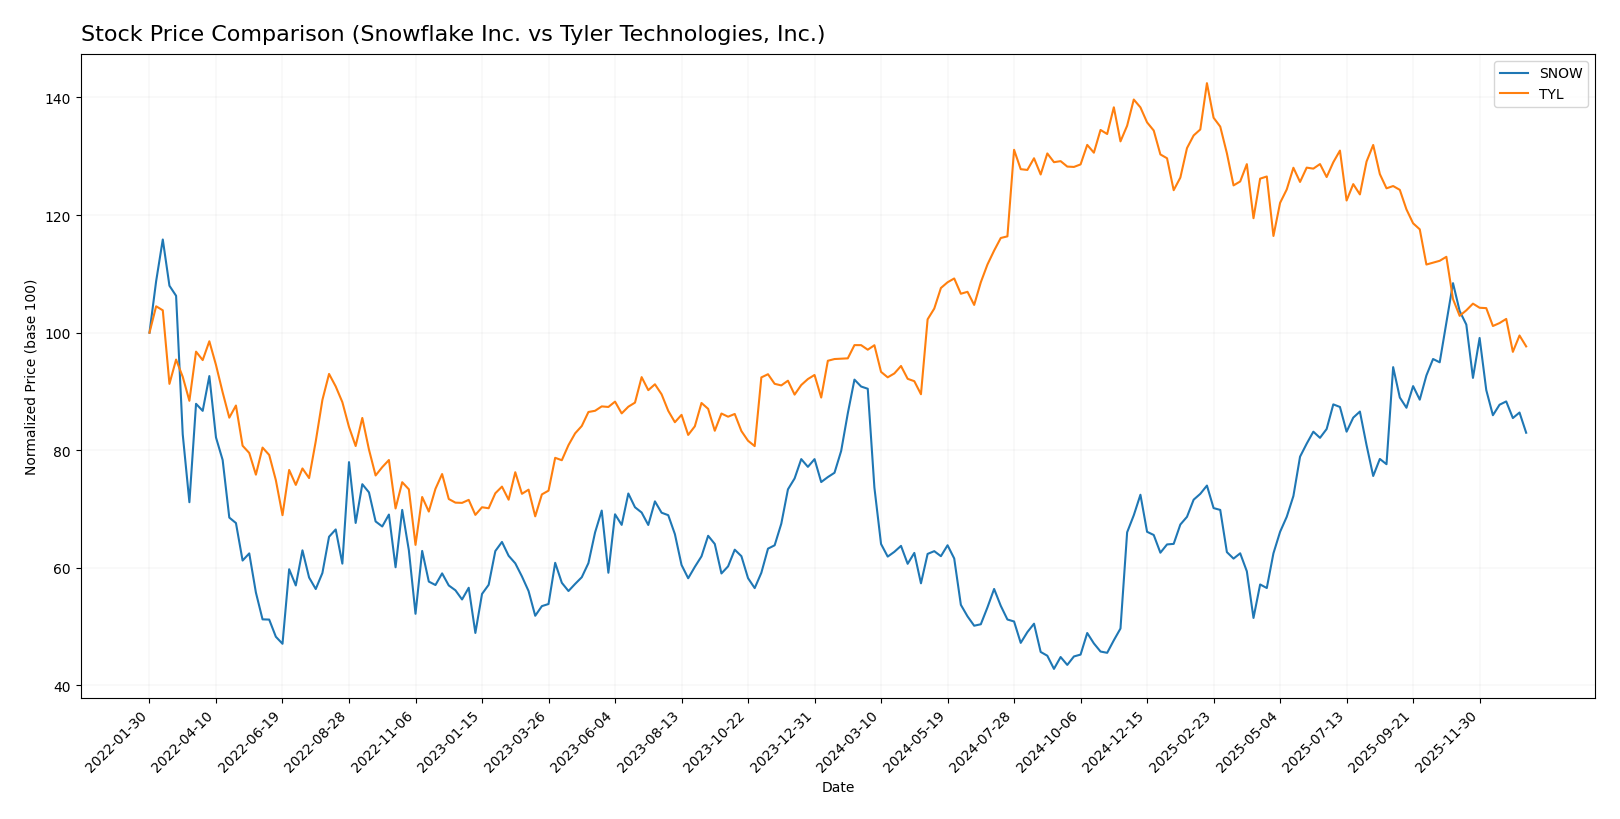
The stock prices of Snowflake Inc. and Tyler Technologies, Inc. have shown contrasting dynamics over the past year, with Snowflake experiencing a notable bearish trend while Tyler Technologies displayed a mild bullish tendency amid varying buyer-seller volumes.
Trend Analysis
Snowflake Inc. posted a -8.27% price change over the past 12 months, indicating a bearish trend with deceleration; the stock peaked at 274.88 and bottomed at 108.56, showing considerable volatility (std dev 42.6).
Tyler Technologies, Inc. recorded a slight 0.58% gain over the same period, classified as bullish but with deceleration; it reached a high of 641.7 and a low of 403.35, experiencing higher volatility (std dev 61.82).
Comparing both stocks, Tyler Technologies delivered the highest market performance with a positive price change, while Snowflake showed a more pronounced negative trend over the past year.
Target Prices
The current analyst target consensus indicates positive growth potential for both Snowflake Inc. and Tyler Technologies, Inc.
| Company | Target High | Target Low | Consensus |
|---|---|---|---|
| Snowflake Inc. | 325 | 237 | 281.86 |
| Tyler Technologies, Inc. | 675 | 470 | 584 |
Analysts expect Snowflake’s stock to appreciate moderately, with consensus targets above the current price of $210.38. Tyler Technologies shows strong upside potential from its current $440.01 price, reflecting bullish sentiment.
Analyst Opinions Comparison
This section compares analysts’ ratings and grades for Snowflake Inc. and Tyler Technologies, Inc.:
Rating Comparison
Snowflake Inc. Rating
- Rating: C-, considered very favorable by analysts.
- Discounted Cash Flow Score: Moderate at 3 out of 5.
- ROE Score: Very unfavorable at 1 out of 5, indicating weak equity returns.
- ROA Score: Very unfavorable at 1 out of 5, reflecting poor asset utilization.
- Debt To Equity Score: Very unfavorable at 1 out of 5, signaling high financial risk.
- Overall Score: Very unfavorable at 1 out of 5.
Tyler Technologies, Inc. Rating
- Rating: B, considered very favorable by analysts.
- Discounted Cash Flow Score: Favorable at 4 out of 5.
- ROE Score: Moderate at 3 out of 5, showing decent equity returns.
- ROA Score: Favorable at 4 out of 5, indicating effective asset use.
- Debt To Equity Score: Moderate at 3 out of 5, suggesting manageable debt levels.
- Overall Score: Moderate at 3 out of 5.
Which one is the best rated?
Tyler Technologies holds a stronger analyst rating overall, with a B rating and generally moderate to favorable financial scores. Snowflake’s scores are mostly very unfavorable, reflected in its lower C- rating and overall score.
Scores Comparison
The comparison of Snowflake Inc. and Tyler Technologies, Inc. scores is as follows:
SNOW Scores
- Altman Z-Score: 5.36, indicating a safe zone, low bankruptcy risk.
- Piotroski Score: 4, classified as average financial strength.
TYL Scores
- Altman Z-Score: 7.42, indicating a safe zone, very low bankruptcy risk.
- Piotroski Score: 6, classified as average financial strength.
Which company has the best scores?
Tyler Technologies has a higher Altman Z-Score of 7.42 compared to Snowflake’s 5.36, suggesting stronger financial stability. Tyler also scores better on the Piotroski Score with 6 versus Snowflake’s 4, indicating relatively stronger financial health.
Grades Comparison
The following tables present recent reliable grades for Snowflake Inc. and Tyler Technologies, Inc.:
Snowflake Inc. Grades
This table summarizes recent analyst grades and rating actions for Snowflake Inc.:
| Grading Company | Action | New Grade | Date |
|---|---|---|---|
| Barclays | Downgrade | Equal Weight | 2026-01-12 |
| Argus Research | Upgrade | Buy | 2026-01-08 |
| Citigroup | Maintain | Buy | 2025-12-08 |
| Wells Fargo | Maintain | Overweight | 2025-12-04 |
| Keybanc | Maintain | Overweight | 2025-12-04 |
| Piper Sandler | Maintain | Overweight | 2025-12-04 |
| Morgan Stanley | Maintain | Overweight | 2025-12-04 |
| Wedbush | Maintain | Outperform | 2025-12-04 |
| Deutsche Bank | Maintain | Buy | 2025-12-04 |
| Cantor Fitzgerald | Maintain | Overweight | 2025-12-04 |
Overall, Snowflake’s grades trend mostly positive with predominantly “Overweight” and “Buy” ratings, despite a recent downgrade by Barclays.
Tyler Technologies, Inc. Grades
This table summarizes recent analyst grades and rating actions for Tyler Technologies, Inc.:
| Grading Company | Action | New Grade | Date |
|---|---|---|---|
| Piper Sandler | Maintain | Overweight | 2026-01-13 |
| Wells Fargo | Maintain | Equal Weight | 2026-01-08 |
| DA Davidson | Maintain | Neutral | 2025-12-09 |
| Evercore ISI Group | Maintain | In Line | 2025-10-31 |
| DA Davidson | Maintain | Neutral | 2025-10-31 |
| DA Davidson | Maintain | Neutral | 2025-10-10 |
| DA Davidson | Maintain | Neutral | 2025-08-05 |
| Barclays | Maintain | Overweight | 2025-07-31 |
| Needham | Maintain | Buy | 2025-05-13 |
| Barclays | Maintain | Overweight | 2025-04-25 |
Tyler Technologies’ grades show a steady pattern of “Neutral” to “Overweight” ratings, with fewer upgrades and mostly stable opinions.
Which company has the best grades?
Snowflake Inc. has generally received stronger and more numerous “Buy” and “Overweight” ratings compared to Tyler Technologies, which shows a predominance of “Neutral” grades. This suggests Snowflake may have a more favorable analyst outlook, potentially influencing investor sentiment and portfolio inclusion.
Strengths and Weaknesses
Below is a comparative overview of key strengths and weaknesses for Snowflake Inc. (SNOW) and Tyler Technologies, Inc. (TYL), based on the most recent financial and strategic data.
| Criterion | Snowflake Inc. (SNOW) | Tyler Technologies, Inc. (TYL) |
|---|---|---|
| Diversification | Moderate: Primarily cloud data platform products; revenue mainly from product sales (3.46B in 2025) with limited service diversification | High: Diverse revenue streams including SaaS (645M), transaction fees (698M), maintenance (463M), and professional services (264M) in 2024 |
| Profitability | Unfavorable: Negative net margin (-35.45%), ROIC -25.24%, ROE -42.86%, indicating value destruction and declining profitability | Favorable net margin (12.3%) but mixed ROE (7.76%, unfavorable) and neutral ROIC (6.2%), showing moderate profitability and some concerns |
| Innovation | Strong product growth: Revenue increased from 553M (2021) to 3.46B (2025) highlighting rapid expansion and innovation in cloud data services | Stable innovation with platform technologies and enterprise software; fixed asset turnover high (10.95), indicating efficient asset use |
| Global presence | Growing but concentrated in cloud data markets; expansion potential remains | Established presence with broad software solutions for public sector markets, but less global than cloud-native competitors |
| Market Share | Significant in cloud data warehousing but facing intense competition; profitability challenges may limit market defense | Solid in specialized public sector software with diversified offerings, supporting stable market share |
Key takeaways: Snowflake shows impressive revenue growth and innovation but struggles with profitability and value creation, posing higher risk. Tyler Technologies offers more diversified revenues and better profitability metrics, suggesting a more stable investment profile with moderate growth prospects.
Risk Analysis
Below is a comparative table summarizing key risks for Snowflake Inc. (SNOW) and Tyler Technologies, Inc. (TYL) based on the most recent data available (2025 for SNOW, 2024 for TYL):
| Metric | Snowflake Inc. (SNOW) | Tyler Technologies, Inc. (TYL) |
|---|---|---|
| Market Risk | High beta (1.144) indicates higher volatility | Moderate beta (0.916), less volatile |
| Debt level | Moderate debt-to-equity (0.9), debt-to-assets 29.72% | Low debt-to-equity (0.19), debt-to-assets 12.32% |
| Regulatory Risk | Moderate, typical for cloud software sector | Moderate, public sector software may face compliance changes |
| Operational Risk | Negative net margin (-35.45%), operational losses | Positive net margin (12.3%), stable operations |
| Environmental Risk | Low direct exposure, but cloud infrastructure energy use is a concern | Low direct exposure, public sector focus limits environmental impact |
| Geopolitical Risk | Moderate, with international customers and cloud data sovereignty concerns | Moderate, US-focused but reliant on federal/state budgets |
In synthesis, Snowflake carries higher market and operational risks due to its higher volatility, negative profitability, and relatively elevated debt. Tyler Technologies shows stronger financial stability with lower debt and positive margins, reducing operational risk. However, both face moderate regulatory and geopolitical risks inherent in software and public sector markets. Investors should weigh Snowflake’s growth potential against its financial and market risk, while Tyler offers steadier but potentially slower growth.
Which Stock to Choose?
Snowflake Inc. (SNOW) shows strong revenue growth of 29.2% in 2025 with a favorable gross margin of 66.5%, but suffers from negative profitability ratios including a -42.9% ROE and -35.5% net margin. Its debt profile is moderate, and the overall financial ratios are slightly unfavorable. The company has a very unfavorable moat rating due to declining ROIC well below WACC, and its rating stands at C- with very unfavorable overall scores.
Tyler Technologies, Inc. (TYL) reports steady income growth near 9.5% with a positive net margin of 12.3% and a moderate ROE of 7.8%. Its financial ratios are generally favorable, particularly low debt and sound interest coverage. Despite also having a very unfavorable moat rating reflecting declining ROIC below WACC, Tyler holds a B rating with mostly moderate to favorable financial scores.
For investors, Tyler’s stronger profitability and more favorable financial ratios might suggest it could be more suitable for those prioritizing stability and moderate growth. Snowflake’s rapid revenue expansion but negative earnings and weaker ratios may appeal more to risk-tolerant investors focused on growth potential but wary of value destruction risks.
Disclaimer: Investment carries a risk of loss of initial capital. The past performance is not a reliable indicator of future results. Be sure to understand risks before making an investment decision.
Go Further
I encourage you to read the complete analyses of Snowflake Inc. and Tyler Technologies, Inc. to enhance your investment decisions: