Snowflake Inc. and Strategy Inc. are two prominent players in the software application industry, each carving a unique path in data management and analytics. Snowflake excels with its cloud-based data platform, enabling seamless data consolidation and insight generation, while Strategy Inc. combines AI-driven analytics with innovative Bitcoin treasury management. This article will analyze their market positions and innovation strategies to help you decide which company offers the most compelling investment opportunity.
Table of contents
Companies Overview
I will begin the comparison between Snowflake Inc. and Strategy Inc by providing an overview of these two companies and their main differences.
Snowflake Inc. Overview
Snowflake Inc. provides a cloud-based data platform in the United States and internationally, focusing on enabling customers to consolidate data into a single source of truth. Its Data Cloud platform supports business insights, data-driven applications, and data sharing across various industries. Founded in 2012 and based in Bozeman, Montana, Snowflake operates in the software application industry and had a market cap of 72.5B USD as of 2026.
Strategy Inc Overview
Strategy Inc operates as a bitcoin treasury company and also offers AI-powered enterprise analytics software, serving clients globally across multiple regions. The company provides investors economic exposure to Bitcoin through various securities and offers software tools like Strategy One and Strategy Mosaic for data-driven decision-making. Incorporated in 1989 and headquartered in Tysons Corner, Virginia, it trades on NASDAQ with a market cap of 45.1B USD.
Key similarities and differences
Both Snowflake and Strategy Inc operate in the technology sector within the software application industry, focusing on data and analytics solutions. However, Snowflake primarily delivers cloud-based data platforms for general business intelligence, while Strategy Inc combines bitcoin treasury operations with AI analytics software. Market capitalization and employee count also differ significantly, with Snowflake being larger in market cap and workforce.
Income Statement Comparison
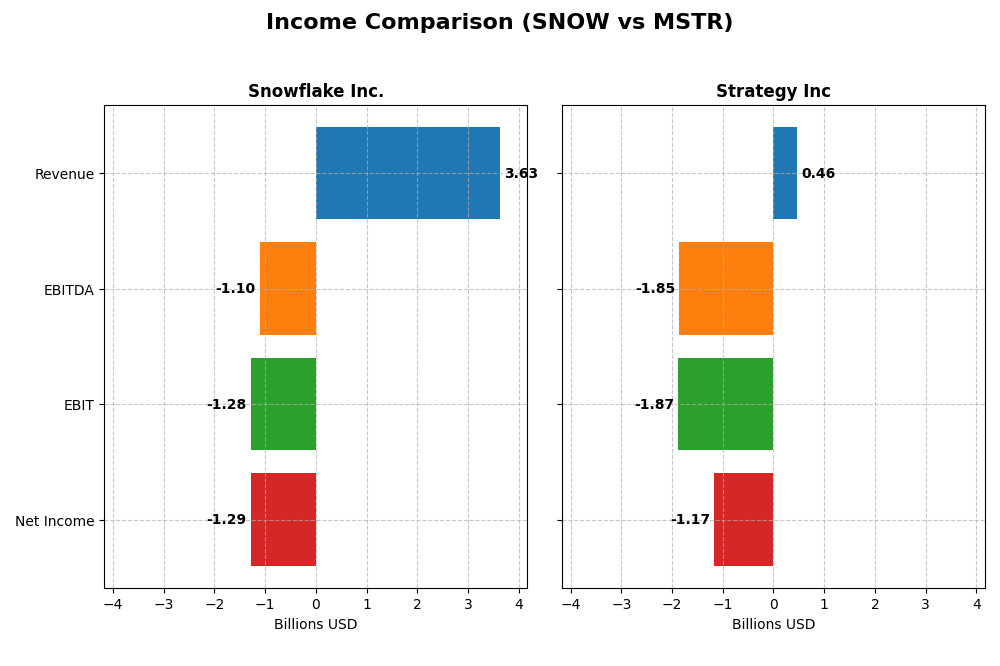
This table presents a side-by-side comparison of key income statement metrics for Snowflake Inc. and Strategy Inc for their most recent fiscal years.
| Metric | Snowflake Inc. (SNOW) | Strategy Inc (MSTR) |
|---|---|---|
| Market Cap | 72.5B | 45.1B |
| Revenue | 3.63B | 463M |
| EBITDA | -1.10B | -1.85B |
| EBIT | -1.28B | -1.87B |
| Net Income | -1.29B | -1.17B |
| EPS | -3.86 | -6.06 |
| Fiscal Year | 2025 | 2024 |
Income Statement Interpretations
Snowflake Inc.
Snowflake Inc. demonstrated strong revenue growth from 2021 to 2025, increasing from $592M to $3.63B, a 513% rise. Despite this, net income declined significantly, with persistent losses expanding from -$539M to -$1.29B. Gross margins remained favorable at 66.5%, but EBIT and net margins stayed negative. In 2025, revenue growth slowed to 29.2%, while EBIT and net income margins deteriorated further.
Strategy Inc
Strategy Inc’s revenue showed a slight overall decline from $481M in 2020 to $463M in 2024, with corresponding negative net income fluctuations, peaking at -$1.47B in 2022 and improving slightly to -$1.17B in 2024. Gross margin remained strong at 72%, yet EBIT and net margins were deeply negative, with substantial interest expenses impacting profitability. The latest year reflected worsening declines in revenue, EBIT, and net income margins.
Which one has the stronger fundamentals?
Snowflake presents a more favorable income statement profile, with robust revenue and gross profit growth over the period, though it still reports losses and negative margins. Strategy Inc faces broader challenges, with consistently unfavorable metrics, higher interest expenses, and deeper net losses. Overall, Snowflake’s fundamentals appear stronger based on growth and margin stability, while Strategy’s metrics indicate more pronounced financial distress.
Financial Ratios Comparison
The table below presents the most recent key financial ratios for Snowflake Inc. (SNOW) and Strategy Inc (MSTR) based on their fiscal year 2025 and 2024 data respectively, providing a snapshot of their financial health and valuation metrics.
| Ratios | Snowflake Inc. (2025) | Strategy Inc (2024) |
|---|---|---|
| ROE | -42.9% | -6.4% |
| ROIC | -25.3% | -4.4% |
| P/E | -47.0 | -47.8 |
| P/B | 20.1 | 3.06 |
| Current Ratio | 1.75 | 0.71 |
| Quick Ratio | 1.75 | 0.71 |
| D/E (Debt-to-Equity) | 0.90 | 0.40 |
| Debt-to-Assets | 29.7% | 28.1% |
| Interest Coverage | -528 | -29.9 |
| Asset Turnover | 0.40 | 0.018 |
| Fixed Asset Turnover | 5.53 | 5.73 |
| Payout ratio | 0 | 0 |
| Dividend yield | 0 | 0 |
Interpretation of the Ratios
Snowflake Inc.
Snowflake’s ratios present a mixed picture with a slightly unfavorable overall assessment. Key weaknesses include negative net margin (-35.45%), return on equity (-42.86%), and return on invested capital (-25.32%), signaling profitability challenges. However, the company shows favorable liquidity ratios (current and quick ratio at 1.75) and manageable debt levels. Snowflake does not pay dividends, likely reflecting reinvestment in growth and R&D priorities.
Strategy Inc
Strategy Inc’s ratios are largely unfavorable, with significant concerns from a negative net margin (-251.73%) and weak liquidity indicated by current and quick ratios at 0.71. Return metrics are also negative, including ROE at -6.4%. The company does not distribute dividends, which may indicate focus on reinvestment or restructuring. Favorable debt-to-equity and fixed asset turnover ratios are noted but insufficient to offset broader weaknesses.
Which one has the best ratios?
Snowflake Inc. holds a marginally better ratio profile with a higher proportion of favorable and neutral metrics compared to Strategy Inc. While both face profitability difficulties and do not pay dividends, Snowflake’s stronger liquidity and lower financial risk position it ahead. Strategy Inc’s more pronounced unfavorable ratios and liquidity challenges weigh more heavily on its financial health assessment.
Strategic Positioning
This section compares the strategic positioning of Snowflake Inc. and Strategy Inc., focusing on market position, key segments, and exposure to technological disruption:
Snowflake Inc.
- Leading cloud-based data platform with significant market cap and moderate beta
- Main revenue from cloud data products and professional services
- Positioned in cloud data platform space with no direct mention of disruption
Strategy Inc
- Bitcoin treasury company with AI analytics software, smaller market cap and higher beta
- Revenues diversified across licenses, maintenance, subscriptions, and technology services
- Exposure to rapidly evolving bitcoin market and AI-powered analytics software
Snowflake Inc. vs Strategy Inc Positioning
Snowflake’s approach centers on a focused cloud data platform with strong product revenue growth, while Strategy Inc combines bitcoin treasury activities with enterprise analytics, diversifying across software and crypto-related financial exposure.
Which has the best competitive advantage?
Both companies show very unfavorable MOAT evaluations with declining ROIC and value destruction, indicating neither currently holds a strong competitive advantage based on efficient capital use and profitability trends.
Stock Comparison
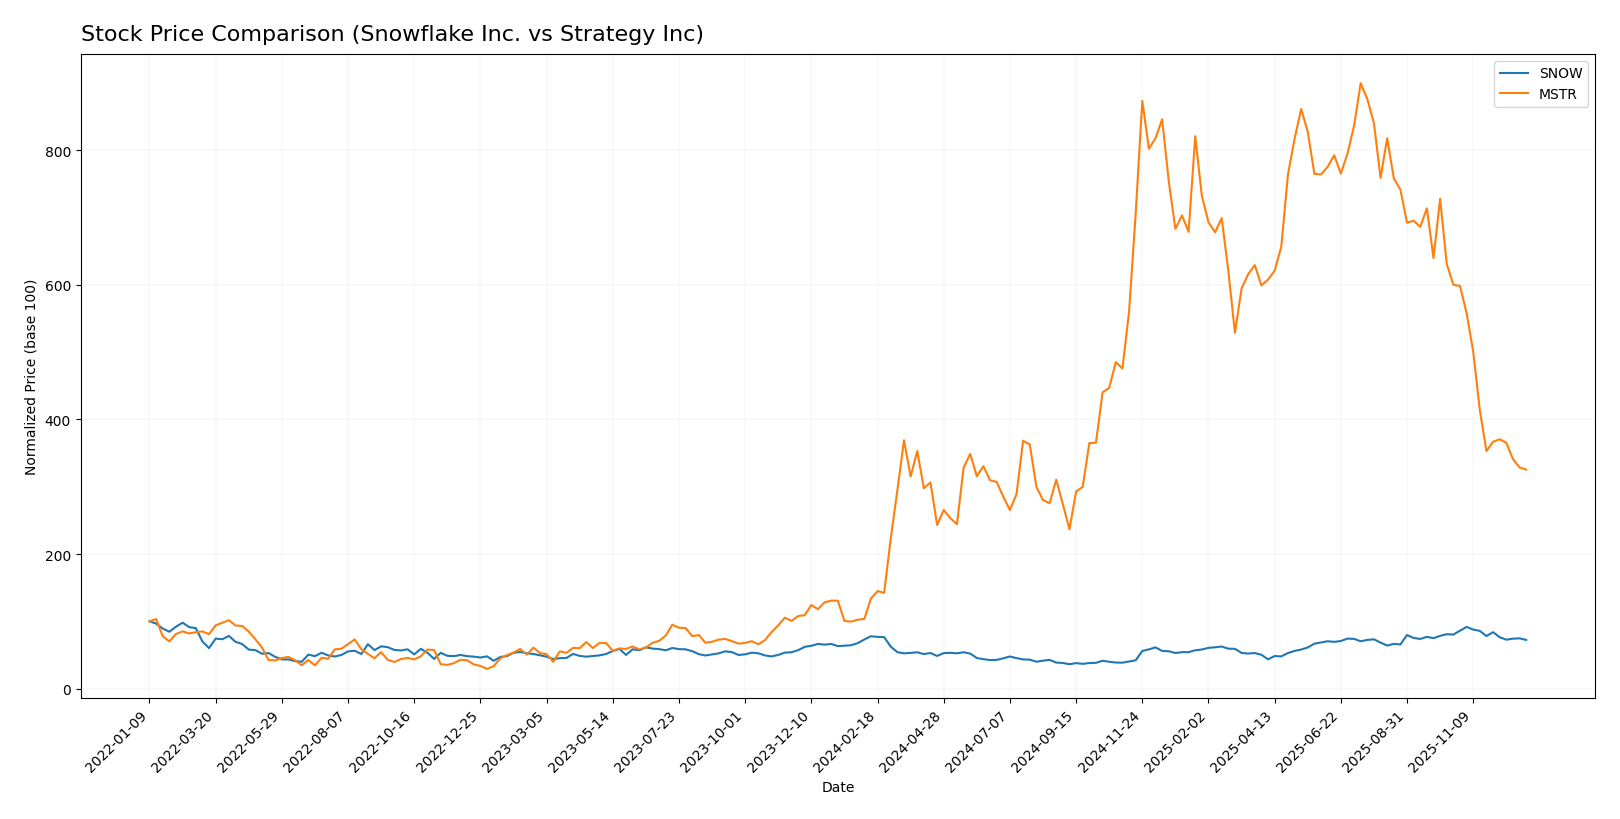
The stock price movements of Snowflake Inc. and Strategy Inc. over the past 12 months reveal contrasting trends, with Strategy Inc. exhibiting strong gains despite recent declines, while Snowflake Inc. shows a consistent downtrend with decelerating momentum.
Trend Analysis
Snowflake Inc. experienced a bearish trend over the past year with a -7.1% price change, marked by deceleration and a high volatility level (std deviation 42.98), peaking at 274.88 and bottoming at 108.56. Recent months show further weakening with a -9.98% decline and a negative slope of -4.3.
Strategy Inc. displayed a bullish trend over the same period, gaining 143.17%, though with deceleration and extreme volatility (std deviation 105.72), reaching a high of 434.58 and a low of 64.63. Recently, it suffered a sharp -45.78% drop with a steep negative slope of -13.11.
Comparing both stocks, Strategy Inc. has delivered substantially higher market performance over the past year despite recent losses, while Snowflake Inc. has maintained a bearish trajectory throughout.
Target Prices
The consensus target prices for Snowflake Inc. and Strategy Inc reflect bullish analyst expectations.
| Company | Target High | Target Low | Consensus |
|---|---|---|---|
| Snowflake Inc. | 325 | 237 | 283.25 |
| Strategy Inc | 705 | 175 | 472.8 |
Analysts see significant upside potential for both stocks compared to current prices of $216.71 for Snowflake and $157.16 for Strategy, indicating positive market sentiment.
Analyst Opinions Comparison
This section compares analysts’ ratings and grades for Snowflake Inc. and Strategy Inc.:
Rating Comparison
Snowflake Inc. Rating
- Rating: C-, classified as Very Favorable overall.
- Discounted Cash Flow Score: 3, indicating a Moderate status.
- ROE Score: 1, indicating a Very Unfavorable status.
- ROA Score: 1, indicating a Very Unfavorable status.
- Debt To Equity Score: 1, indicating a Very Unfavorable status.
- Overall Score: 1, indicating a Very Unfavorable status.
Strategy Inc Rating
- Rating: A-, classified as Very Favorable overall.
- Discounted Cash Flow Score: 1, indicating a Very Unfavorable status.
- ROE Score: 4, indicating a Favorable status.
- ROA Score: 5, indicating a Very Favorable status.
- Debt To Equity Score: 3, indicating a Moderate status.
- Overall Score: 4, indicating a Favorable status.
Which one is the best rated?
Based strictly on the provided data, Strategy Inc. is better rated with an A- rating and higher scores in ROE, ROA, debt to equity, and overall score. Snowflake Inc. holds a lower C- rating and scores mostly very unfavorable except for a moderate DCF score.
Scores Comparison
Here is a comparison of the Altman Z-Score and Piotroski Score for both companies:
SNOW Scores
- Altman Z-Score: 6.22, indicating a safe financial zone with low bankruptcy risk.
- Piotroski Score: 4, showing average financial strength and investment quality.
MSTR Scores
- Altman Z-Score: 2.59, placing it in the grey zone with moderate bankruptcy risk.
- Piotroski Score: 4, showing average financial strength and investment quality.
Which company has the best scores?
SNOW has a higher Altman Z-Score, indicating stronger financial stability compared to MSTR, which sits in the grey zone. Both companies share the same average Piotroski Score of 4.
Grades Comparison
Here is a comparison of the latest reliable grades for Snowflake Inc. and Strategy Inc.:
Snowflake Inc. Grades
The table below lists recent analyst grades for Snowflake Inc. from reputable firms.
| Grading Company | Action | New Grade | Date |
|---|---|---|---|
| Citigroup | Maintain | Buy | 2025-12-08 |
| Needham | Maintain | Buy | 2025-12-04 |
| DA Davidson | Maintain | Buy | 2025-12-04 |
| Stifel | Maintain | Buy | 2025-12-04 |
| Keybanc | Maintain | Overweight | 2025-12-04 |
| Baird | Maintain | Outperform | 2025-12-04 |
| Morgan Stanley | Maintain | Overweight | 2025-12-04 |
| Deutsche Bank | Maintain | Buy | 2025-12-04 |
| Scotiabank | Maintain | Sector Outperform | 2025-12-04 |
| Canaccord Genuity | Maintain | Buy | 2025-12-04 |
Snowflake Inc.’s grades reflect a consistent strong buy and outperform consensus across major financial institutions.
Strategy Inc Grades
Below is a summary of recent grades issued by recognized analysts for Strategy Inc.
| Grading Company | Action | New Grade | Date |
|---|---|---|---|
| Citigroup | Maintain | Buy | 2025-12-22 |
| Bernstein | Maintain | Outperform | 2025-12-08 |
| Monness, Crespi, Hardt | Upgrade | Neutral | 2025-11-10 |
| HC Wainwright & Co. | Maintain | Buy | 2025-11-03 |
| Canaccord Genuity | Maintain | Buy | 2025-11-03 |
| Cantor Fitzgerald | Maintain | Overweight | 2025-10-31 |
| BTIG | Maintain | Buy | 2025-10-31 |
| TD Cowen | Maintain | Buy | 2025-10-31 |
| Wells Fargo | Downgrade | Equal Weight | 2025-09-30 |
| TD Cowen | Maintain | Buy | 2025-09-16 |
Strategy Inc’s ratings show a majority buy and outperform stance, though there is some recent moderation with a downgrade to equal weight.
Which company has the best grades?
Snowflake Inc. holds a stronger and more uniform buy and outperform consensus compared to Strategy Inc., which has a few recent downgrades. This suggests Snowflake currently enjoys higher analyst confidence, potentially indicating lower perceived risk or stronger growth prospects for investors.
Strengths and Weaknesses
The table below compares the current strengths and weaknesses of Snowflake Inc. (SNOW) and Strategy Inc. (MSTR) based on their diversification, profitability, innovation, global presence, and market share.
| Criterion | Snowflake Inc. (SNOW) | Strategy Inc. (MSTR) |
|---|---|---|
| Diversification | Moderate: Revenue mainly from Products (3.46B) and Professional Services (164M) with growing product sales | Moderate: Revenue spread across License (49M), Maintenance (244M), Subscription (107M), Technology Service (64M) |
| Profitability | Weak: Negative net margin (-35.45%), ROIC (-25.32%), and declining profitability trend | Weak: More severe negative net margin (-251.73%), ROIC (-4.38%), and worsening profitability |
| Innovation | Moderate: Investment in product development but declining ROIC indicates challenges | Moderate: Stable product turnover but deteriorating financial returns |
| Global presence | Strong: Extensive cloud-based services with scalable global reach | Moderate: Legacy software licensing and services, less scalable globally |
| Market Share | Growing product revenue suggests increasing market traction | Stable but limited growth in key segments, market share challenged by newer entrants |
Key takeaway: Both companies currently face significant profitability challenges with declining returns on invested capital, signaling value destruction. Snowflake shows stronger growth potential in product revenue and global scalability, while Strategy Inc. struggles with heavy losses and less favorable financial ratios. Investors should exercise caution and focus on risk management before considering positions in either.
Risk Analysis
Below is a summary table of key risk factors for Snowflake Inc. (SNOW) and Strategy Inc. (MSTR) as of the most recent fiscal years.
| Metric | Snowflake Inc. (SNOW) | Strategy Inc. (MSTR) |
|---|---|---|
| Market Risk | Beta 1.09, moderate market volatility exposure | Beta 3.41, high market volatility exposure |
| Debt Level | Debt-to-Equity 0.9 (neutral), Debt/Assets 29.7% (favorable) | Debt-to-Equity 0.4 (favorable), Debt/Assets 28.1% (favorable) |
| Regulatory Risk | Moderate, operates globally in tech/data sectors | Elevated, due to bitcoin treasury activities and crypto regulation |
| Operational Risk | Moderate, cloud platform dependency, negative net margin (-35.5%) | High, crypto exposure and reliance on AI analytics, negative net margin (-251.7%) |
| Environmental Risk | Low, typical for software sector | Low, typical for software sector |
| Geopolitical Risk | Moderate, global data operations | High, international crypto markets subject to geopolitical tensions |
The most impactful risks are Strategy Inc.’s high market volatility and regulatory exposure due to its bitcoin treasury focus, which adds significant operational and geopolitical uncertainty. Snowflake faces moderate market and operational risks with a negative profitability trend but benefits from a stronger liquidity position and safer financial stability indicated by its Altman Z-score. Investors should weigh these risks carefully against their portfolio risk tolerance.
Which Stock to Choose?
Snowflake Inc. (SNOW) shows strong revenue growth of 29.21% in the last year and a favorable gross margin of 66.5%, but profitability remains negative with a net margin of -35.45%. Its financial ratios are slightly unfavorable overall, with a current ratio of 1.75 indicating reasonable liquidity and moderate debt levels. The company has a very favorable rating of C- but displays value destruction with declining ROIC compared to WACC.
Strategy Inc (MSTR) has experienced declining revenue and profitability, with a negative net margin of -251.73% and unfavorable income statement growth. Its financial ratios are mostly unfavorable, including weak liquidity (current ratio 0.71) despite low debt-to-equity. However, MSTR holds a very favorable A- rating and a grey zone Altman Z-score, though it also shows value destruction and declining ROIC.
For investors focused on growth, Snowflake’s strong revenue momentum and liquidity might appear more attractive despite profitability challenges. Conversely, those prioritizing rating strength and financial stability might view Strategy Inc’s favorable rating and grey zone distress score as potential indicators, though its income and ratio trends remain unfavorable. The choice could depend on the investor’s risk tolerance and strategic focus.
Disclaimer: Investment carries a risk of loss of initial capital. The past performance is not a reliable indicator of future results. Be sure to understand risks before making an investment decision.
Go Further
I encourage you to read the complete analyses of Snowflake Inc. and Strategy Inc to enhance your investment decisions: