In the dynamic world of software applications, Snowflake Inc. and monday.com Ltd. stand out as innovative players transforming how businesses manage data and workflows. Both companies operate in the cloud-based software sector, targeting diverse industries with platforms designed to enhance productivity and decision-making. This comparison explores their market presence, growth strategies, and innovation to help you determine which company aligns best with your investment goals.

Table of contents
Companies Overview
I will begin the comparison between Snowflake Inc. and monday.com Ltd. by providing an overview of these two companies and their main differences.
Snowflake Inc. Overview
Snowflake Inc. operates a cloud-based data platform, Data Cloud, which consolidates data for business insights, application development, and data sharing. Founded in 2012 and based in Bozeman, Montana, Snowflake serves diverse industries internationally. It positions itself as a leader in cloud data solutions, with a market cap of $70.4B and over 7,800 employees.
monday.com Ltd. Overview
monday.com Ltd., headquartered in Tel Aviv, Israel, develops Work OS, a cloud-based visual work platform for building custom software applications and managing work. Founded in 2012, it serves organizations across multiple sectors globally, including education and government. monday.com’s market cap stands at $6.5B with about 2,500 employees, focusing on modular work management solutions.
Key similarities and differences
Both companies operate in the software application industry offering cloud-based platforms that enhance business operations through data and workflow management. Snowflake specializes in data consolidation and insights for various industries, while monday.com emphasizes customizable work management tools and software applications. Snowflake is significantly larger by market cap and workforce, reflecting differing scales and market focuses.
Income Statement Comparison
The table below compares key income statement metrics for Snowflake Inc. and monday.com Ltd. based on their most recent fiscal year results.

| Metric | Snowflake Inc. (SNOW) | monday.com Ltd. (MNDY) |
|---|---|---|
| Market Cap | 70.4B | 6.5B |
| Revenue | 3.63B | 972M |
| EBITDA | -1.10B | 58M |
| EBIT | -1.28B | 40M |
| Net Income | -1.29B | 32M |
| EPS | -3.86 | 0.65 |
| Fiscal Year | 2025 | 2024 |
Income Statement Interpretations
Snowflake Inc.
Snowflake’s revenue showed strong growth from 2021 to 2025, rising from $592M to $3.63B, representing a 513% increase overall. However, net income remained negative throughout, worsening to a loss of $1.29B in 2025. Gross margins held favorably steady at 66.5%, but EBIT and net margins stayed negative, with recent year losses deepening despite a 29.2% revenue increase in 2025.
monday.com Ltd.
monday.com’s revenue grew from $161M in 2020 to $972M in 2024, a 503% increase, with net income turning positive in 2024 at $32M after years of losses. The company maintained a strong gross margin of 89.3%, while EBIT and net margins improved to slightly positive levels in 2024. Its recent year showed significant gains in profitability alongside a 33.2% revenue increase.
Which one has the stronger fundamentals?
monday.com exhibits stronger fundamentals with consistent revenue growth coupled with improving profitability, reflected in positive net income and margins in the latest period. Snowflake, despite its robust revenue growth, continues to face substantial losses and negative margins, indicating ongoing challenges in achieving profitability. Thus, monday.com’s income statement presents a more favorable financial trajectory.
Financial Ratios Comparison
The table below presents the most recent financial ratios for Snowflake Inc. (SNOW) and monday.com Ltd. (MNDY) based on their fiscal year 2025 and 2024 data respectively.
| Ratios | Snowflake Inc. (2025) | monday.com Ltd. (2024) |
|---|---|---|
| ROE | -42.9% | 3.14% |
| ROIC | -25.2% | -1.73% |
| P/E | -47.0 | 363.0 |
| P/B | 20.1 | 11.4 |
| Current Ratio | 1.75 | 2.66 |
| Quick Ratio | 1.75 | 2.66 |
| D/E | 0.90 | 0.10 |
| Debt-to-Assets | 29.7% | 6.29% |
| Interest Coverage | -527.7 | 0 |
| Asset Turnover | 0.40 | 0.58 |
| Fixed Asset Turnover | 5.53 | 7.13 |
| Payout ratio | 0 | 0 |
| Dividend yield | 0 | 0 |
Interpretation of the Ratios
Snowflake Inc.
Snowflake’s financial ratios show several weaknesses, including negative returns on equity (-42.86%) and invested capital (-25.24%), alongside an unfavorable net margin of -35.45%. However, liquidity ratios such as current and quick ratios are favorable at 1.75. The company does not pay dividends, likely focusing on reinvestment and growth, as indicated by zero dividend yield and payout.
monday.com Ltd.
monday.com presents a mixed ratio profile with a modest positive net margin (3.33%) and return on equity (3.14%), though still marked unfavorable. Its liquidity ratios are strong, with a current ratio of 2.66 and low debt-to-assets at 6.29%. Like Snowflake, it pays no dividends, probably prioritizing growth and R&D over shareholder payouts.
Which one has the best ratios?
monday.com’s ratios are more balanced, with higher liquidity and lower leverage compared to Snowflake’s more negative profitability metrics. Snowflake’s unfavorable returns and margins weigh heavily on its profile despite some favorable liquidity and turnover ratios. Overall, monday.com’s financial ratios appear more stable and neutral, while Snowflake trends slightly unfavorable.
Strategic Positioning
This section compares the strategic positioning of Snowflake Inc. and monday.com Ltd., including Market position, Key segments, and Exposure to technological disruption:
Snowflake Inc.
- Large market cap ~70B USD with moderate competitive pressure in cloud data platforms.
- Key revenue from cloud-based data platform products, growing from 553M USD in 2021 to 3.46B USD in 2025.
- Positioned in cloud data consolidation, potentially exposed to evolving cloud and data analytics technologies.
monday.com Ltd.
- Smaller market cap ~6.5B USD facing competitive pressure in work management software.
- Focused on cloud-based visual work OS and modular software applications, no detailed revenue data provided.
- Focused on cloud work management tools, exposed to disruption in collaborative software and SaaS innovation.
Snowflake vs monday.com Positioning
Snowflake operates with a diversified product portfolio focused on data platforms and professional services, showing strong revenue scale. monday.com concentrates on visual work OS and modular applications, with less disclosed revenue data and a more niche market scope.
Which has the best competitive advantage?
Both companies are currently shedding value with ROIC below WACC, but monday.com shows improving profitability trends, whereas Snowflake’s profitability is declining, indicating a weaker competitive advantage.
Stock Comparison
The stock price chart illustrates significant bearish trends for both Snowflake Inc. and monday.com Ltd. over the past 12 months, reflecting notable price declines and shifting trading dynamics.
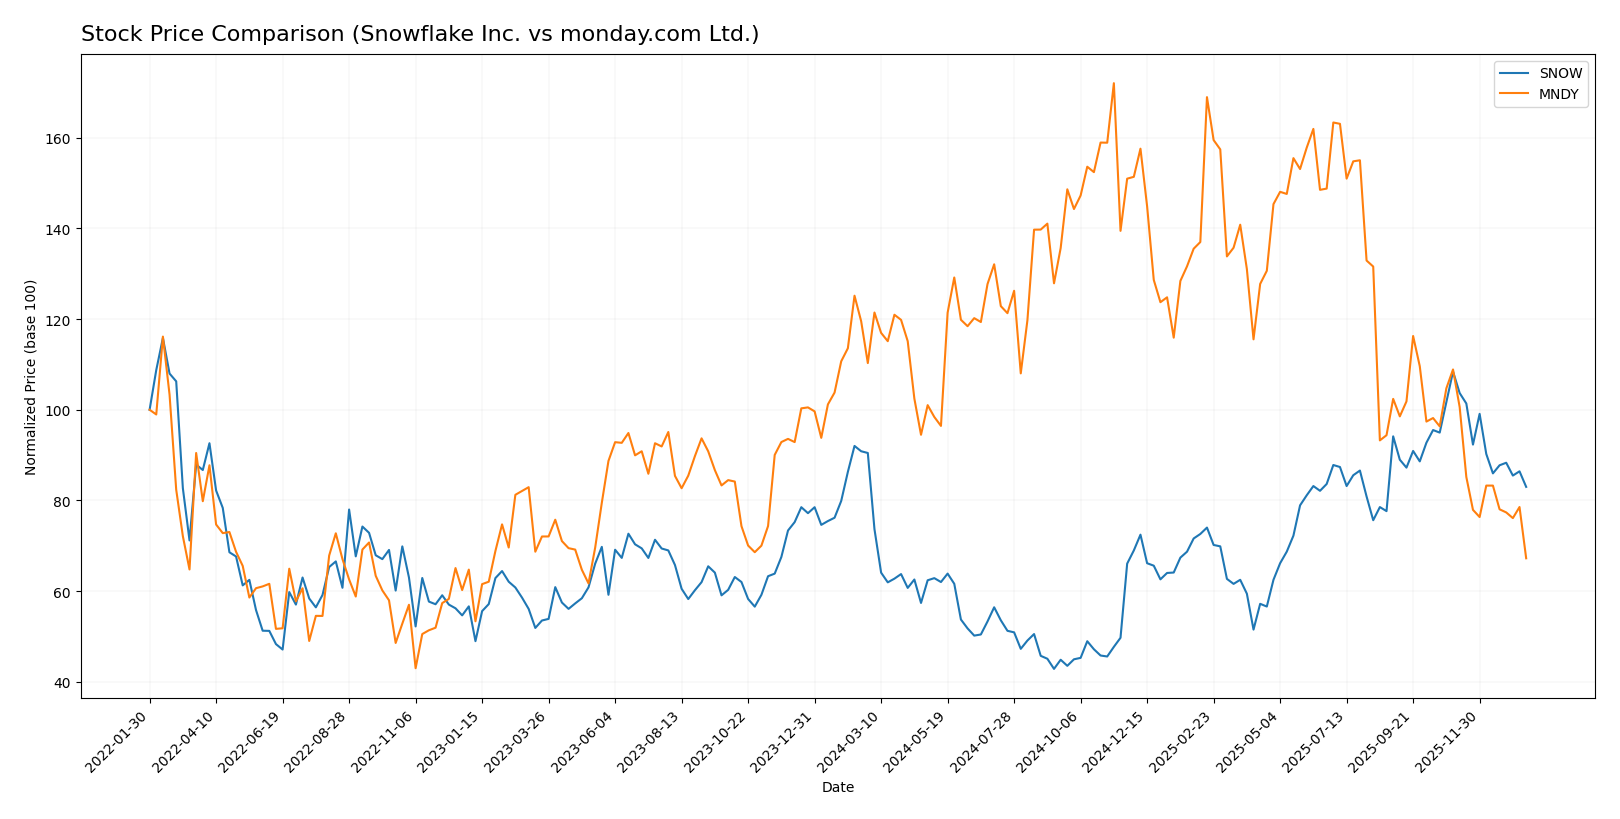
Trend Analysis
Snowflake Inc. experienced a bearish trend over the past year with a price decrease of 8.27%, showing deceleration and a wide price range between 108.56 and 274.88. Recent months indicate an accelerated decline of 23.46%.
monday.com Ltd. also showed a bearish trend with a sharper 39.06% drop over the last 12 months, accompanied by deceleration. The stock’s highest price was 324.31 and the lowest 126.7, with recent losses near 38.27%.
Comparing both stocks, monday.com Ltd. delivered the largest market performance decline, underperforming Snowflake Inc. during the analyzed period.
Target Prices
Analysts present a generally optimistic target price consensus for Snowflake Inc. and monday.com Ltd.
| Company | Target High | Target Low | Consensus |
|---|---|---|---|
| Snowflake Inc. | 325 | 237 | 281.86 |
| monday.com Ltd. | 330 | 194 | 264.42 |
Target prices suggest that both stocks have significant upside potential compared to current prices of $210.38 for Snowflake and $126.70 for monday.com, reflecting positive analyst sentiment.
Analyst Opinions Comparison
This section compares analysts’ ratings and grades for Snowflake Inc. and monday.com Ltd.:
Rating Comparison
SNOW Rating
- Rating: C-, considered Very Favorable overall
- Discounted Cash Flow Score: 3, Moderate valuation view
- ROE Score: 1, indicating very unfavorable profitability
- ROA Score: 1, indicating very unfavorable asset use
- Debt To Equity Score: 1, very unfavorable financial risk
- Overall Score: 1, very unfavorable financial standing
MNDY Rating
- Rating: B-, considered Very Favorable overall
- Discounted Cash Flow Score: 4, Favorable valuation view
- ROE Score: 3, indicating moderate profitability
- ROA Score: 3, indicating moderate asset utilization
- Debt To Equity Score: 3, moderate financial risk
- Overall Score: 3, moderate financial standing
Which one is the best rated?
Based on the provided data, monday.com Ltd. has a better overall rating and higher scores across most financial metrics compared to Snowflake Inc., indicating a stronger financial profile in this comparison.
Scores Comparison
Here is the comparison of Snowflake Inc. and monday.com Ltd. scores:
SNOW Scores
- Altman Z-Score: 5.36, indicating a safe zone for bankruptcy risk.
- Piotroski Score: 4, reflecting average financial strength.
MNDY Scores
- Altman Z-Score: 6.33, also indicating a safe zone.
- Piotroski Score: 5, reflecting average financial strength.
Which company has the best scores?
Both Snowflake Inc. and monday.com Ltd. have Altman Z-Scores in the safe zone, with monday.com slightly higher. monday.com’s Piotroski Score is also higher, suggesting marginally stronger financial health based on these metrics.
Grades Comparison
Here is a comparison of recent grades and ratings assigned to Snowflake Inc. and monday.com Ltd.:
Snowflake Inc. Grades
The following table summarizes recent grade actions from reputable financial institutions for Snowflake Inc.:
| Grading Company | Action | New Grade | Date |
|---|---|---|---|
| Barclays | Downgrade | Equal Weight | 2026-01-12 |
| Argus Research | Upgrade | Buy | 2026-01-08 |
| Citigroup | Maintain | Buy | 2025-12-08 |
| Wells Fargo | Maintain | Overweight | 2025-12-04 |
| Keybanc | Maintain | Overweight | 2025-12-04 |
| Piper Sandler | Maintain | Overweight | 2025-12-04 |
| Morgan Stanley | Maintain | Overweight | 2025-12-04 |
| Wedbush | Maintain | Outperform | 2025-12-04 |
| Deutsche Bank | Maintain | Buy | 2025-12-04 |
| Cantor Fitzgerald | Maintain | Overweight | 2025-12-04 |
Snowflake has mostly maintained overweight and buy ratings, with a recent downgrade by Barclays to equal weight.
monday.com Ltd. Grades
The following table shows recent grades and rating actions for monday.com Ltd. by established financial firms:
| Grading Company | Action | New Grade | Date |
|---|---|---|---|
| BTIG | Maintain | Buy | 2026-01-15 |
| Barclays | Maintain | Overweight | 2026-01-12 |
| Jefferies | Maintain | Buy | 2026-01-05 |
| Citigroup | Maintain | Buy | 2025-12-23 |
| Tigress Financial | Maintain | Buy | 2025-12-11 |
| Baird | Maintain | Outperform | 2025-11-11 |
| Wells Fargo | Maintain | Overweight | 2025-11-11 |
| DA Davidson | Maintain | Buy | 2025-11-11 |
| Morgan Stanley | Maintain | Overweight | 2025-11-11 |
| Piper Sandler | Maintain | Overweight | 2025-11-11 |
monday.com has consistently received buy and overweight ratings with no recent downgrades.
Which company has the best grades?
Both Snowflake and monday.com carry a consensus “Buy” rating, but monday.com shows a steady pattern of maintained buy and overweight grades without downgrades. This stability could signal a more confident outlook from analysts, potentially affecting investor sentiment toward risk and growth expectations.
Strengths and Weaknesses
Below is a comparison of key strengths and weaknesses for Snowflake Inc. (SNOW) and monday.com Ltd. (MNDY) based on their latest financial and operational data.
| Criterion | Snowflake Inc. (SNOW) | monday.com Ltd. (MNDY) |
|---|---|---|
| Diversification | Moderate, revenue mainly from products (3.46B USD in 2025) with limited services | Limited product/service diversification, focused on SaaS collaboration tools |
| Profitability | Negative net margin (-35.45%), declining ROIC, value destroying | Slightly positive net margin (3.33%), growing ROIC but still value destroying |
| Innovation | Strong product growth, but declining capital efficiency | Improving profitability suggests innovation gains, but high valuation risks |
| Global presence | Large multinational footprint, strong market penetration | Growing international presence with solid balance sheet |
| Market Share | Significant in cloud data warehousing but under pressure due to profitability issues | Niche player in work OS market, steady growth but at high cost |
Key takeaways: Snowflake shows impressive top-line growth but suffers from worsening profitability and capital inefficiency, posing risks for investors. monday.com exhibits improving profitability and stronger balance sheet metrics, though its valuation and limited diversification warrant cautious optimism. Both companies currently destroy value but show potential paths to improvement.
Risk Analysis
Below is a comparative table of key risks for Snowflake Inc. (SNOW) and monday.com Ltd. (MNDY) based on the most recent financial year data and market context:
| Metric | Snowflake Inc. (SNOW) | monday.com Ltd. (MNDY) |
|---|---|---|
| Market Risk | Beta 1.144, volatile sector demand | Beta 1.255, higher volatility in NASDAQ tech stocks |
| Debt level | Debt-to-assets 29.72%, moderate leverage | Debt-to-assets 6.29%, low leverage |
| Regulatory Risk | US tech regulations, data privacy laws | EU and Israel regulations, GDPR compliance |
| Operational Risk | High operating losses, negative margins | Narrow positive margin, moderate operational efficiency |
| Environmental Risk | Moderate, typical for cloud software | Moderate, typical for cloud software |
| Geopolitical Risk | US-centric with international customers | Exposure to Middle East and Europe geopolitical tensions |
The most impactful risks for Snowflake stem from its operational losses and moderate leverage, which increase financial vulnerability despite a strong market position. monday.com’s main risks are market volatility and regulatory complexities across regions, though it benefits from lower debt and better operational margins. Both companies remain in the safe zone for bankruptcy risk but require careful monitoring of market and operational factors.
Which Stock to Choose?
Snowflake Inc. (SNOW) shows strong revenue growth of 29.21% in 2025 and a favorable gross margin at 66.5%, but suffers from negative profitability ratios including a -42.86% ROE and -35.45% net margin. Its debt metrics are moderate with a 0.9 debt-to-equity ratio, yet the overall rating is very favorable despite some unfavorable financial ratios and a very unfavorable moat due to declining ROIC.
monday.com Ltd. (MNDY) reports a favorable income statement with a 33.21% revenue growth in 2024 and a high gross margin of 89.33%. Profitability remains modest with a 3.14% ROE and 3.33% net margin, supported by low debt with a 0.1 debt-to-equity ratio. The company holds a neutral global ratio opinion, a slightly unfavorable moat with improving ROIC, and a very favorable rating.
Investors prioritizing rapid income growth and high gross margins might find monday.com’s improving profitability and financial stability appealing, while those focusing on market rating and financial risks could view Snowflake’s strong revenue growth and very favorable rating as noteworthy despite its value destruction signals. The choice might depend on whether the investor prefers a company with improving profitability or one with a stronger overall rating but current profitability challenges.
Disclaimer: Investment carries a risk of loss of initial capital. The past performance is not a reliable indicator of future results. Be sure to understand risks before making an investment decision.
Go Further
I encourage you to read the complete analyses of Snowflake Inc. and monday.com Ltd. to enhance your investment decisions: