Snowflake Inc. and Elastic N.V. are two prominent players in the software application industry, specializing in innovative data solutions. Snowflake focuses on cloud-based data platforms, while Elastic offers powerful search and analytics software for multi-cloud environments. Both companies target data-driven enterprises and demonstrate strong innovation strategies. In this article, I will help you determine which company presents the most compelling investment opportunity in 2026.
Table of contents
Companies Overview
I will begin the comparison between Snowflake and Elastic by providing an overview of these two companies and their main differences.
Snowflake Overview
Snowflake Inc. provides a cloud-based data platform that enables customers to consolidate data into a single source of truth for business insights, data-driven applications, and data sharing. Founded in 2012 and based in Bozeman, Montana, Snowflake serves organizations of various sizes across multiple industries. It operates in the software application industry with a market cap of approximately 72.5B USD and employs around 7,800 people.
Elastic Overview
Elastic N.V. specializes in search technology solutions designed for public and private clouds in multi-cloud environments. Its flagship product, Elastic Stack, includes Elasticsearch, Kibana, Beats, Elastic Agent, and Logstash, supporting data ingestion, search, analysis, and visualization. Founded in 2012 and headquartered in Mountain View, California, Elastic operates in the software application industry with a market cap near 7.6B USD and employs about 3,400 people.
Key similarities and differences
Both Snowflake and Elastic operate within the software application sector, focusing on cloud-based data solutions to enhance data management and analysis. Snowflake emphasizes data consolidation and sharing via its Data Cloud platform, while Elastic focuses on real-time search, analytics, and visualization through its Elastic Stack. Snowflake’s market cap and workforce size are significantly larger than Elastic’s, reflecting its broader scale and market reach.
Income Statement Comparison
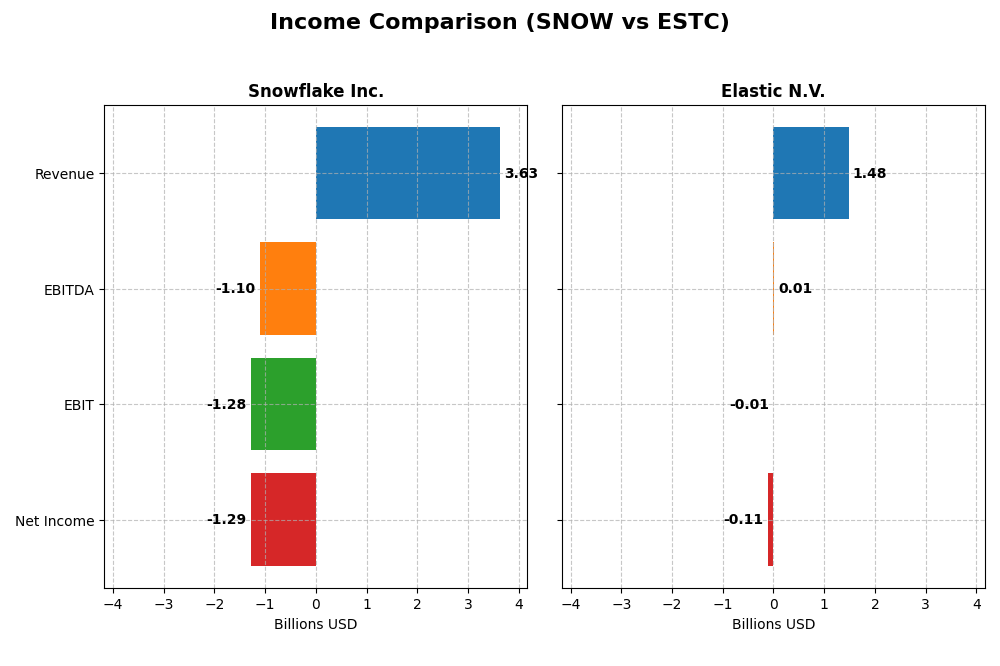
Below is a comparison of the key income statement metrics for Snowflake Inc. and Elastic N.V. for their most recent fiscal year.
| Metric | Snowflake Inc. (SNOW) | Elastic N.V. (ESTC) |
|---|---|---|
| Market Cap | 72.5B | 7.6B |
| Revenue | 3.63B | 1.48B |
| EBITDA | -1.10B | 6.1M |
| EBIT | -1.28B | -6.3M |
| Net Income | -1.29B | -108.1M |
| EPS | -3.86 | -1.04 |
| Fiscal Year | 2025 | 2025 |
Income Statement Interpretations
Snowflake Inc.
Snowflake’s revenue surged from 592M in 2021 to 3.63B in 2025, marking robust growth, while net income remained negative, deepening to -1.29B in 2025. Gross margin stabilized at a favorable 66.5%, but EBIT and net margins stayed unfavorable. The latest year showed strong revenue and gross profit growth, though EBIT and net income margins deteriorated, reflecting widening losses.
Elastic N.V.
Elastic’s revenue grew steadily from 608M in 2021 to 1.48B in 2025, with net income fluctuating but improving overall to -108M in 2025 after a positive spike in 2024. Gross margin remained solid at 74.4%, while EBIT and net margins were negative but improved in 2025. Recent performance featured healthy revenue and gross profit increases, alongside a notable EBIT improvement despite persistent net losses.
Which one has the stronger fundamentals?
Elastic exhibits stronger fundamentals with a higher gross margin, better EBIT margin, and positive net income growth over the period. Snowflake, despite faster revenue expansion, shows greater net losses and margin pressures. Elastic’s more favorable global income statement evaluation (71% favorable) contrasts with Snowflake’s balanced but neutral stance, indicating Elastic’s income statement is comparatively healthier.
Financial Ratios Comparison
The table below presents a comparison of key financial ratios for Snowflake Inc. (SNOW) and Elastic N.V. (ESTC) based on their most recent fiscal year data.
| Ratios | Snowflake Inc. (SNOW) FY 2025 | Elastic N.V. (ESTC) FY 2025 |
|---|---|---|
| ROE | -42.9% | -11.7% |
| ROIC | -25.3% | -11.8% |
| P/E | -47.0 | -82.7 |
| P/B | 20.1 | 9.64 |
| Current Ratio | 1.75 | 1.92 |
| Quick Ratio | 1.75 | 1.92 |
| D/E (Debt to Equity) | 0.90 | 0.64 |
| Debt-to-Assets | 29.7% | 22.9% |
| Interest Coverage | -528 | -2.17 |
| Asset Turnover | 0.40 | 0.57 |
| Fixed Asset Turnover | 5.53 | 51.3 |
| Payout Ratio | 0 | 0 |
| Dividend Yield | 0 | 0 |
Interpretation of the Ratios
Snowflake Inc.
Snowflake’s ratios show significant weaknesses, including a deeply negative net margin (-35.45%), return on equity (-42.86%), and return on invested capital (-25.32%), signaling profitability and efficiency challenges. Favorable liquidity ratios (current and quick at 1.75) suggest reasonable short-term financial health. The company does not pay dividends, reflecting its reinvestment strategy and growth focus.
Elastic N.V.
Elastic exhibits mixed ratios with a less negative net margin (-7.29%) and return on equity (-11.66%) compared to Snowflake, indicating somewhat better profitability but still below par. Key liquidity ratios are favorable (current and quick at 1.92), and the weighted average cost of capital (7.96%) is positive. Like Snowflake, Elastic does not pay dividends, likely prioritizing growth and reinvestment.
Which one has the best ratios?
Elastic’s ratios appear more balanced, with a neutral overall assessment contrasting Snowflake’s slightly unfavorable profile. Elastic shows a lower degree of negative profitability and a stronger current ratio, while Snowflake struggles with more unfavorable profitability and valuation metrics despite some liquidity strengths. This positions Elastic as having comparatively better financial ratios.
Strategic Positioning
This section compares the strategic positioning of Snowflake Inc. and Elastic N.V. across Market position, Key segments, and Exposure to technological disruption:
Snowflake Inc.
- Large market cap of 72.5B USD in software application, faces competitive pressure in cloud data platforms.
- Focused on cloud-based Data Cloud platform consolidating data for insights and applications; product revenue dominates.
- Operates in cloud data management, exposed to rapid changes in cloud and data analytics technologies.
Elastic N.V.
- Smaller market cap of 7.6B USD, competes in multi-cloud search and analytics software.
- Concentrated on Elastic Stack subscription services including search, logging, and monitoring tools.
- Positioned in multi-cloud environments with software evolving in search and analytics, facing tech shifts.
Snowflake Inc. vs Elastic N.V. Positioning
Snowflake’s strategy is diversified around a broad cloud data platform with higher revenue scale, while Elastic concentrates on a specialized search and analytics stack with subscription-driven growth. Snowflake benefits from scale, Elastic from focused product innovation.
Which has the best competitive advantage?
Both companies currently shed value as ROIC is below WACC; however, Elastic shows improving profitability with growing ROIC, indicating a slightly more favorable competitive advantage than Snowflake’s declining ROIC trend.
Stock Comparison
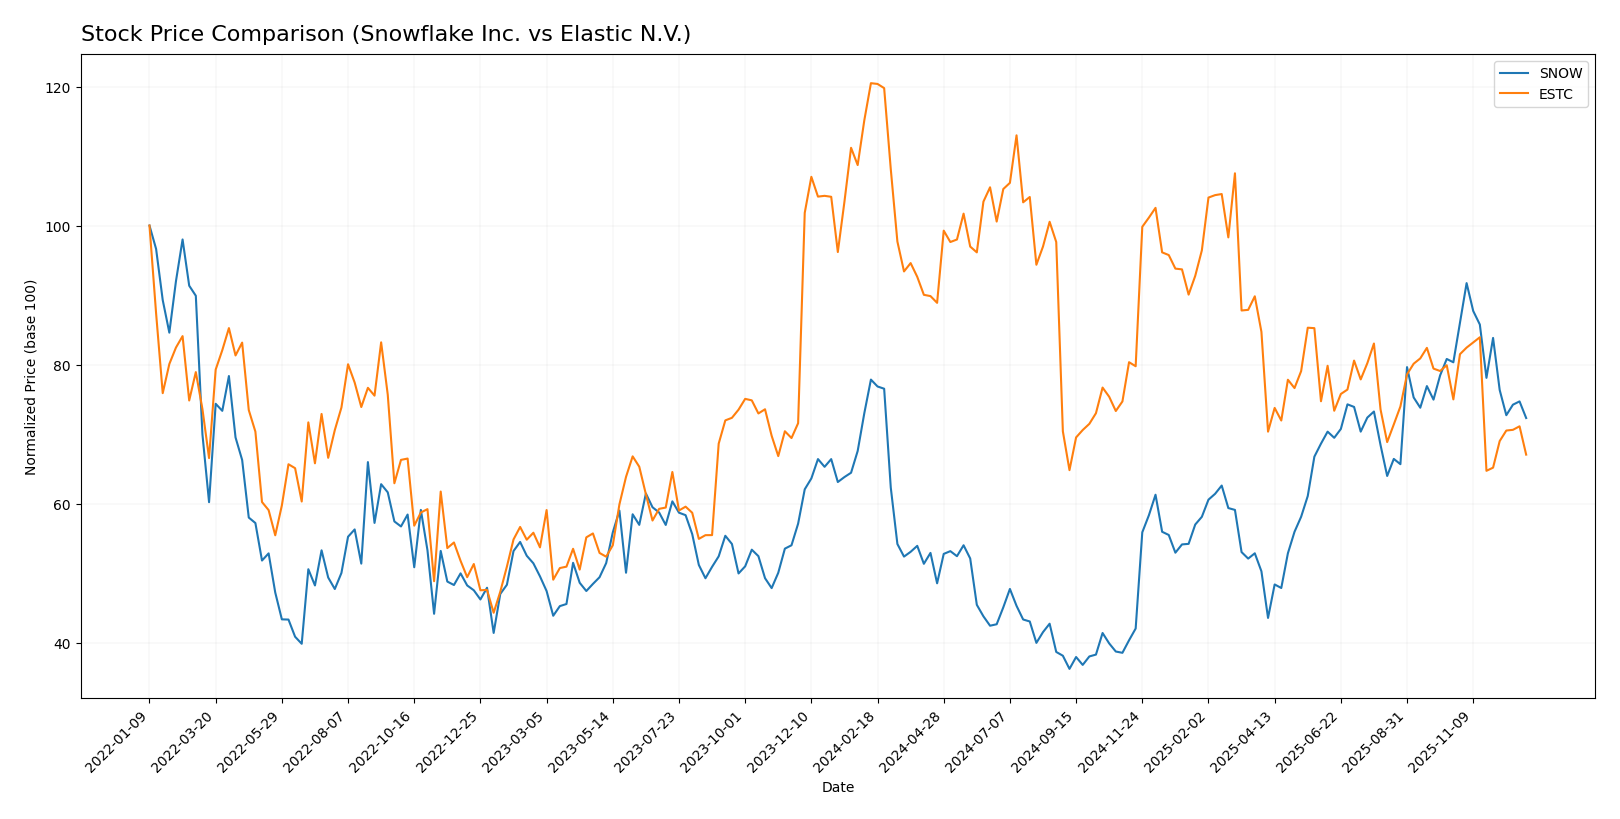
The stock prices of Snowflake Inc. and Elastic N.V. have both experienced significant declines over the past 12 months, with notable volatility and deceleration in downward trends, reflecting challenging trading dynamics.
Trend Analysis
Snowflake Inc. (SNOW) shows a bearish trend with a 7.1% price decline over the past year, accompanied by high volatility (std deviation 42.98) and deceleration in the downward movement. Recent months reflect a sharper 9.98% drop.
Elastic N.V. (ESTC) also presents a bearish trend with a steep 44.35% price decrease over the same period, lower volatility (std deviation 14.77), and decelerating losses. Its recent trend shows a 10.6% fall but with less steep slope.
Comparing both, Elastic’s stock delivered the lowest market performance with a much larger decline over the last year, while Snowflake showed a less severe but still bearish trend.
Target Prices
Here is the current consensus on target prices for Snowflake Inc. and Elastic N.V., reflecting analyst expectations.
| Company | Target High | Target Low | Consensus |
|---|---|---|---|
| Snowflake Inc. | 325 | 237 | 283.25 |
| Elastic N.V. | 134 | 76 | 108 |
Analysts expect Snowflake’s stock to rise significantly above its current price of $216.71, while Elastic’s consensus target price of $108 implies a strong upside from its current $72.56.
Analyst Opinions Comparison
This section compares analysts’ ratings and grades for Snowflake Inc. and Elastic N.V.:
Rating Comparison
Snowflake Inc. Rating
- Rating: C- with a very favorable status
- Discounted Cash Flow Score: 3, indicating moderate value
- ROE Score: 1, reflecting a very unfavorable return on equity
- ROA Score: 1, showing very unfavorable asset utilization
- Debt To Equity Score: 1, representing very unfavorable financial risk
- Overall Score: 1, categorized as very unfavorable
Elastic N.V. Rating
- Rating: C- with a very favorable status
- Discounted Cash Flow Score: 3, indicating moderate value
- ROE Score: 1, reflecting a very unfavorable return on equity
- ROA Score: 1, showing very unfavorable asset utilization
- Debt To Equity Score: 1, representing very unfavorable financial risk
- Overall Score: 1, categorized as very unfavorable
Which one is the best rated?
Both Snowflake Inc. and Elastic N.V. share identical ratings and financial scores, each rated C- with moderate DCF scores but very unfavorable scores for ROE, ROA, debt to equity, and overall assessment. Neither company is rated better than the other based on this data.
Scores Comparison
Here is a comparison of the financial health scores for Snowflake Inc. and Elastic N.V.:
SNOW Scores
- Altman Z-Score: 6.22, indicating a safe zone with low bankruptcy risk.
- Piotroski Score: 4, reflecting average financial strength.
ESTC Scores
- Altman Z-Score: 3.23, also in the safe zone with moderate financial stability.
- Piotroski Score: 4, similarly indicating average financial strength.
Which company has the best scores?
Based on the provided data, Snowflake has a higher Altman Z-Score than Elastic, indicating stronger financial stability. Both have the same average Piotroski Score, suggesting similar financial strength.
Grades Comparison
Here is a comparison of recent grades assigned by reputable financial institutions for Snowflake Inc. and Elastic N.V.:
Snowflake Inc. Grades
The following table summarizes Snowflake’s latest grades from leading grading companies:
| Grading Company | Action | New Grade | Date |
|---|---|---|---|
| Citigroup | Maintain | Buy | 2025-12-08 |
| Needham | Maintain | Buy | 2025-12-04 |
| DA Davidson | Maintain | Buy | 2025-12-04 |
| Stifel | Maintain | Buy | 2025-12-04 |
| Keybanc | Maintain | Overweight | 2025-12-04 |
| Baird | Maintain | Outperform | 2025-12-04 |
| Morgan Stanley | Maintain | Overweight | 2025-12-04 |
| Deutsche Bank | Maintain | Buy | 2025-12-04 |
| Scotiabank | Maintain | Sector Outperform | 2025-12-04 |
| Canaccord Genuity | Maintain | Buy | 2025-12-04 |
Snowflake’s grades consistently indicate strong buy and outperform ratings, reflecting high analyst confidence.
Elastic N.V. Grades
The following table presents Elastic’s recent grades from recognized grading firms:
| Grading Company | Action | New Grade | Date |
|---|---|---|---|
| Citigroup | Maintain | Buy | 2025-11-24 |
| Cantor Fitzgerald | Maintain | Neutral | 2025-11-21 |
| Stifel | Maintain | Buy | 2025-11-21 |
| B of A Securities | Maintain | Neutral | 2025-11-21 |
| DA Davidson | Maintain | Neutral | 2025-11-21 |
| Scotiabank | Maintain | Sector Perform | 2025-11-21 |
| Piper Sandler | Maintain | Overweight | 2025-11-21 |
| Jefferies | Maintain | Buy | 2025-11-21 |
| Wedbush | Maintain | Outperform | 2025-11-21 |
| Guggenheim | Maintain | Buy | 2025-11-21 |
Elastic’s ratings vary between neutral and buy, with some firms indicating sector perform and overweight, suggesting mixed analyst sentiment.
Which company has the best grades?
Snowflake Inc. has received more consistently positive grades, predominantly “Buy” and “Outperform,” compared to Elastic N.V.’s mixed “Buy” and “Neutral” ratings. This difference may influence investor confidence differently, reflecting varied perceived growth potential and risk profiles.
Strengths and Weaknesses
Below is a comparative overview of key strengths and weaknesses of Snowflake Inc. (SNOW) and Elastic N.V. (ESTC) based on recent financial and operational data.
| Criterion | Snowflake Inc. (SNOW) | Elastic N.V. (ESTC) |
|---|---|---|
| Diversification | Moderate product focus mainly on data platform and services | Subscription-focused with growing professional services |
| Profitability | Negative net margin (-35.45%), ROIC -25.32%, value destroying | Negative net margin (-7.29%), ROIC -11.8%, but improving ROIC |
| Innovation | High innovation in cloud data warehousing but profitability struggles | Steady innovation with increasing profitability trend |
| Global presence | Significant global footprint in cloud computing | Global reach with strong subscription growth |
| Market Share | Leading in cloud data platform market | Competitive in search and analytics software segment |
Key takeaways: Snowflake leads in market presence and innovation but faces severe profitability challenges and value destruction. Elastic shows better profitability trends and more balanced ratios, suggesting a more stable investment profile despite some negative margins. Caution is advised with both due to ongoing profitability issues.
Risk Analysis
Below is a comparative risk overview of Snowflake Inc. (SNOW) and Elastic N.V. (ESTC) based on their latest financial and operational data from 2025.
| Metric | Snowflake Inc. (SNOW) | Elastic N.V. (ESTC) |
|---|---|---|
| Market Risk | Beta 1.09, moderate volatility | Beta 0.97, slightly lower volatility |
| Debt level | Debt-to-assets 29.7%, moderate leverage | Debt-to-assets 23.0%, moderate leverage |
| Regulatory Risk | US-based, moderate exposure to data/privacy regulations | US and global multi-cloud, moderate regulatory complexity |
| Operational Risk | Large employee base (7.8K), complex cloud platform | Smaller workforce (3.4K), focused product suite |
| Environmental Risk | Limited direct exposure, cloud operations energy use | Similar cloud operations energy footprint |
| Geopolitical Risk | US-centric with some international clients | Global multi-cloud presence, more geopolitical exposure |
Snowflake faces the most impactful risks from its unfavorable profitability and operational efficiency metrics, despite a solid Altman Z-score indicating low bankruptcy risk. Elastic shows a more balanced risk profile with slightly better leverage and operational metrics but also suffers from negative profitability. Both companies carry moderate market and regulatory risks typical for tech cloud service providers. Caution is advised due to their ongoing challenges in profitability and interest coverage.
Which Stock to Choose?
Snowflake Inc. (SNOW) shows strong revenue growth of 29.2% in 2025 and a favorable gross margin of 66.5%, but profitability ratios remain negative, with a net margin of -35.45% and declining returns on equity and invested capital. Its debt levels appear manageable, yet the company is rated very favorable overall despite some unfavorable financial ratios, indicating mixed financial health.
Elastic N.V. (ESTC) posts moderate revenue growth of 17.0% and a higher gross margin of 74.4%, with improving EBIT growth of 93.5% in 2025. Profitability ratios are negative but less severe than SNOW’s, with a net margin of -7.29%. Debt metrics are favorable, and the company’s financial ratios and income statement evaluations are more balanced, earning a very favorable rating with a neutral global ratios opinion.
For investors prioritizing growth potential, Snowflake’s robust revenue expansion might appear attractive despite its profitability challenges and value destruction signals. Conversely, those seeking a company with improving profitability trends and steadier financial ratios may find Elastic’s profile more favorable. The choice could thus depend on an investor’s risk tolerance and strategy focus.
Disclaimer: Investment carries a risk of loss of initial capital. The past performance is not a reliable indicator of future results. Be sure to understand risks before making an investment decision.
Go Further
I encourage you to read the complete analyses of Snowflake Inc. and Elastic N.V. to enhance your investment decisions: