Home > Comparison > Communication Services > TWLO vs SNAP
The strategic rivalry between Twilio Inc. and Snap Inc. shapes the evolution of the communication services sector. Twilio operates a cloud communications platform focused on developer-driven customer engagement, while Snap excels as a camera-centric social media innovator with immersive advertising. This head-to-head pits scalable infrastructure against user-centric content creation. I will analyze which company’s operational model offers a superior risk-adjusted return for a diversified portfolio in this dynamic industry.
Table of contents
Companies Overview
Twilio and Snap dominate distinct niches in the digital communication landscape, driving innovation with unique user engagement models.
Twilio Inc.: The Cloud Communications Enabler
Twilio Inc. serves as a cloud communications platform powering developers to embed voice, messaging, video, and email into applications. Its core revenue stems from API usage fees that scale with customer engagement. In 2026, Twilio focuses on expanding its programmable communication suite and enhancing enterprise integration to capture broader market demand.
Snap Inc.: The Visual Communication Pioneer
Snap Inc. operates as a camera company delivering Snapchat and Spectacles, enabling visual messaging through short videos and images. Its revenue engine relies heavily on advertising products like AR and video ads. In 2026, Snap prioritizes innovation in AR advertising and immersive user experiences to maintain its lead in social visual engagement.
Strategic Collision: Similarities & Divergences
Twilio and Snap both leverage digital communication but diverge in approach—Twilio builds an open developer-centric platform, while Snap operates a closed, consumer-facing ecosystem. Their primary battleground lies in customer engagement tools, with Twilio targeting enterprises and Snap focusing on social users. These differences shape distinct investment profiles: Twilio as a scalable infrastructure play, Snap as an innovation-driven media company.
Income Statement Comparison
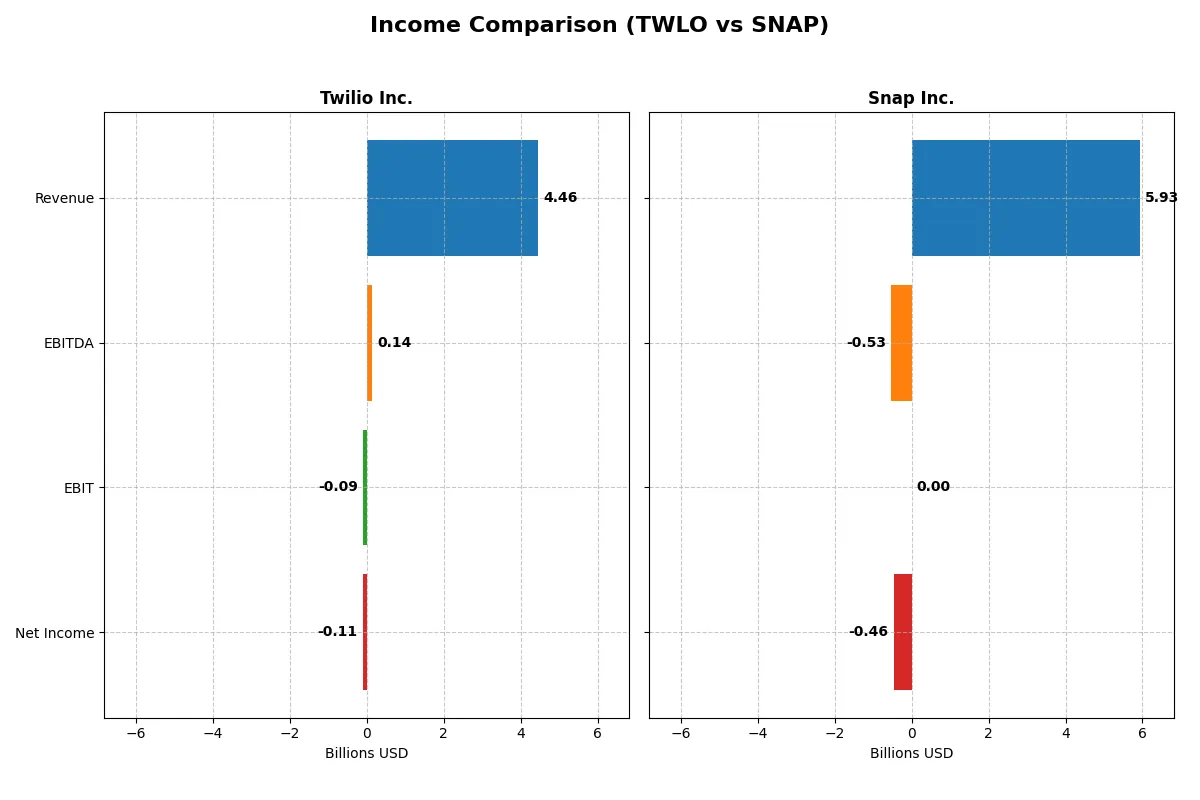
This data dissects the core profitability and scalability of both corporate engines to reveal who dominates the bottom line:
| Metric | Twilio Inc. (TWLO) | Snap Inc. (SNAP) |
|---|---|---|
| Revenue | 4.46B | 5.36B |
| Cost of Revenue | 2.23B | 2.47B |
| Operating Expenses | 2.27B | 3.67B |
| Gross Profit | 2.23B | 2.89B |
| EBITDA | 136M | -493M |
| EBIT | -89M | -651M |
| Interest Expense | 0 | 22M |
| Net Income | -109M | -698M |
| EPS | -0.66 | -0.42 |
| Fiscal Year | 2024 | 2024 |
Income Statement Analysis: The Bottom-Line Duel
This income statement comparison reveals the true efficiency and profitability dynamics of Twilio Inc. and Snap Inc. over recent years.
Twilio Inc. Analysis
Twilio’s revenue rose steadily from $1.76B in 2020 to $4.46B in 2024, reflecting robust top-line growth. Despite a favorable 50% gross margin, Twilio struggles with negative net income, narrowing losses to -$109M in 2024. Operating expenses remain high but show efficiency gains, supporting a notable 91% EBIT improvement year-over-year, signaling positive momentum.
Snap Inc. Analysis
Snap’s revenue grew from $4.12B in 2021 to $5.93B in 2025, outpacing Twilio’s scale. Its gross margin of 54.99% exceeds Twilio’s, yet Snap posts wider net losses of -$460M in 2025. Operating expenses track revenue growth closely, improving cost control. Snap’s EBIT turned less negative by 100% year-over-year, indicating improving operational leverage and growing efficiency.
Margin Strength vs. Revenue Expansion
Twilio shows stronger margin recovery and shrinking net losses relative to revenue, reflecting improving operational discipline. Snap delivers superior revenue scale and higher gross margins but remains challenged by larger absolute net losses. For investors, Twilio’s trajectory suggests a more disciplined path to profitability, while Snap appeals as a higher-growth, higher-burn profile in a competitive sector.
Financial Ratios Comparison
These vital ratios act as a diagnostic tool to expose the underlying fiscal health, valuation premiums, and capital efficiency of the companies compared below:
| Ratios | Twilio Inc. (TWLO) | Snap Inc. (SNAP) |
|---|---|---|
| ROE | -1.38% | -28.48% |
| ROIC | -0.45% | -11.66% |
| P/E | -163.9x | -25.6x |
| P/B | 2.25x | 7.29x |
| Current Ratio | 4.20 | 3.95 |
| Quick Ratio | 4.20 | 3.95 |
| D/E | 0.14 | 1.73 |
| Debt-to-Assets | 11.3% | 53.5% |
| Interest Coverage | 0 | -36.53x |
| Asset Turnover | 0.45 | 0.68 |
| Fixed Asset Turnover | 18.2 | 5.26 |
| Payout ratio | 0% | 0% |
| Dividend yield | 0% | 0% |
| Fiscal Year | 2024 | 2024 |
Efficiency & Valuation Duel: The Vital Signs
Financial ratios act as a company’s DNA, revealing hidden risks and operational strengths essential for investment analysis.
Twilio Inc.
Twilio displays weak profitability with negative ROE (-1.38%) and net margins (-2.45%), indicating operational challenges. Its valuation appears attractive with a favorable negative P/E ratio, but a neutral price-to-book at 2.25. The company pays no dividend, focusing capital on R&D, which consumes a significant portion of revenue, aiming for long-term growth.
Snap Inc.
Snap struggles with deeper profitability issues, marked by a steep negative ROE (-28.48%) and net margin (-13.02%), reflecting operational inefficiency. Valuation shows a favorable negative P/E but an expensive price-to-book ratio of 7.29. Snap also pays no dividends, heavily reinvesting in research and development, though with less favorable debt levels and asset turnover.
Valuation Appeal vs. Profitability Struggles
Twilio offers a better balance of valuation and operational metrics, with less debt and a stronger asset turnover than Snap. Snap’s higher leverage and weaker returns increase risk despite similar valuation appeal. Conservative investors may prefer Twilio’s profile, while risk-tolerant investors might consider Snap’s growth bets.
Which one offers the Superior Shareholder Reward?
Twilio and Snap both forgo dividends, reinvesting free cash flow into growth and innovation. Twilio’s free cash flow per share stands at $3.96 with a robust buyback capacity, while Snap’s FCF per share is $0.13, and it also lacks buyback intensity. Twilio’s capital expenditure coverage ratio of 12.18 signals strong cash generation supporting sustainable buybacks. Snap’s higher leverage (debt-to-equity 1.73 vs. Twilio’s 0.14) raises risk despite a healthier net profit margin. I judge Twilio’s shareholder reward superior due to its stronger free cash flow, prudent leverage, and sustainable capital allocation focused on buybacks over Snap’s riskier balance sheet and modest cash returns.
Comparative Score Analysis: The Strategic Profile
The radar chart reveals the fundamental DNA and trade-offs of Twilio Inc. and Snap Inc., highlighting their distinct financial strengths and weaknesses:
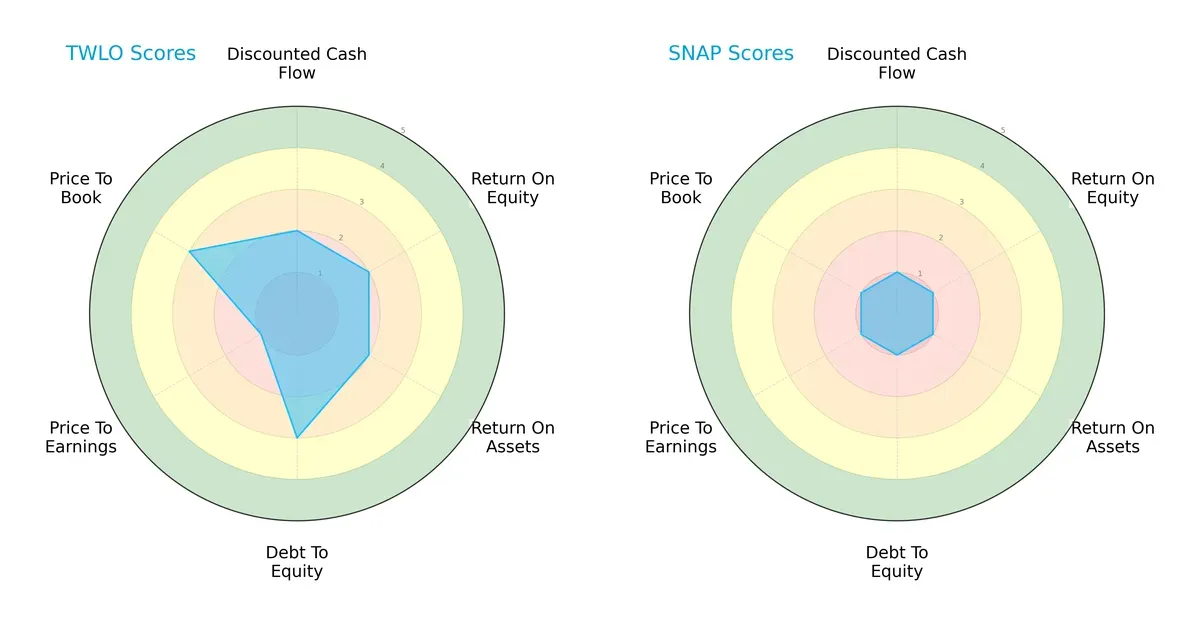
Twilio shows a more balanced profile with moderate scores in DCF, ROE, ROA, and Debt/Equity, but its valuation metrics signal caution. Snap relies heavily on a singular edge but scores very low across nearly all metrics, indicating weaker fundamentals and higher risk.
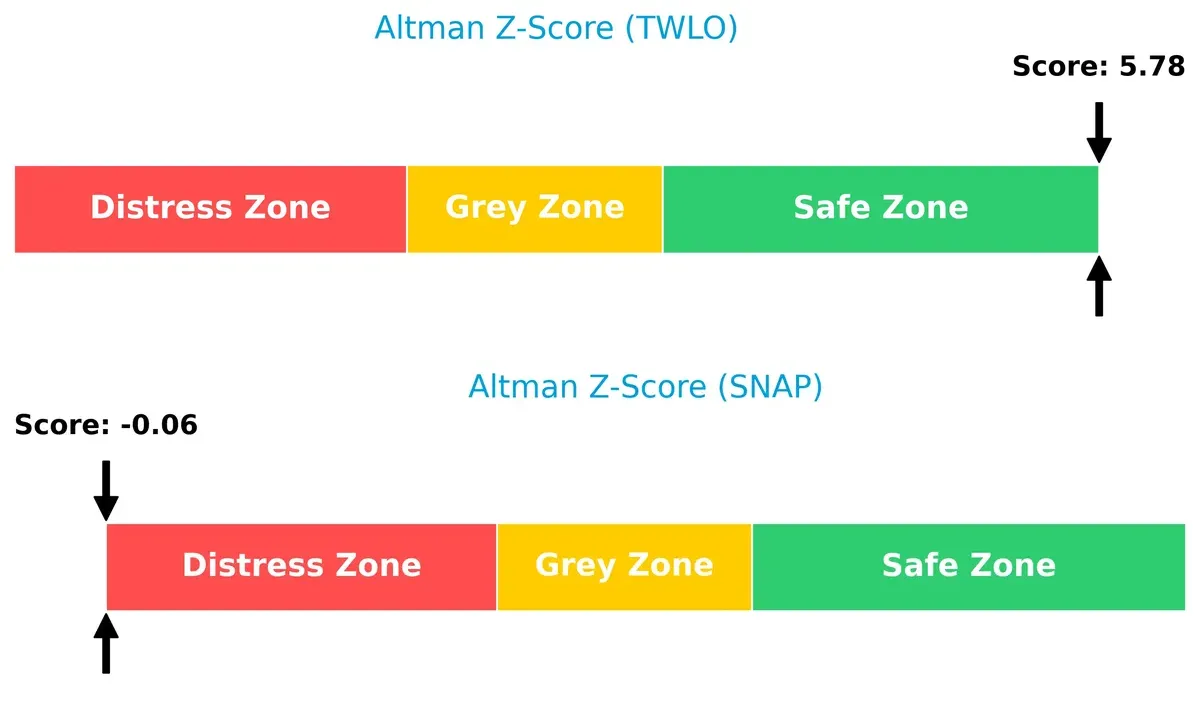
Bankruptcy Risk: Solvency Showdown
Twilio’s Altman Z-Score far exceeds Snap’s, placing it in a safe zone versus Snap’s distress zone, signaling Twilio’s more robust long-term survival prospects in this cycle:
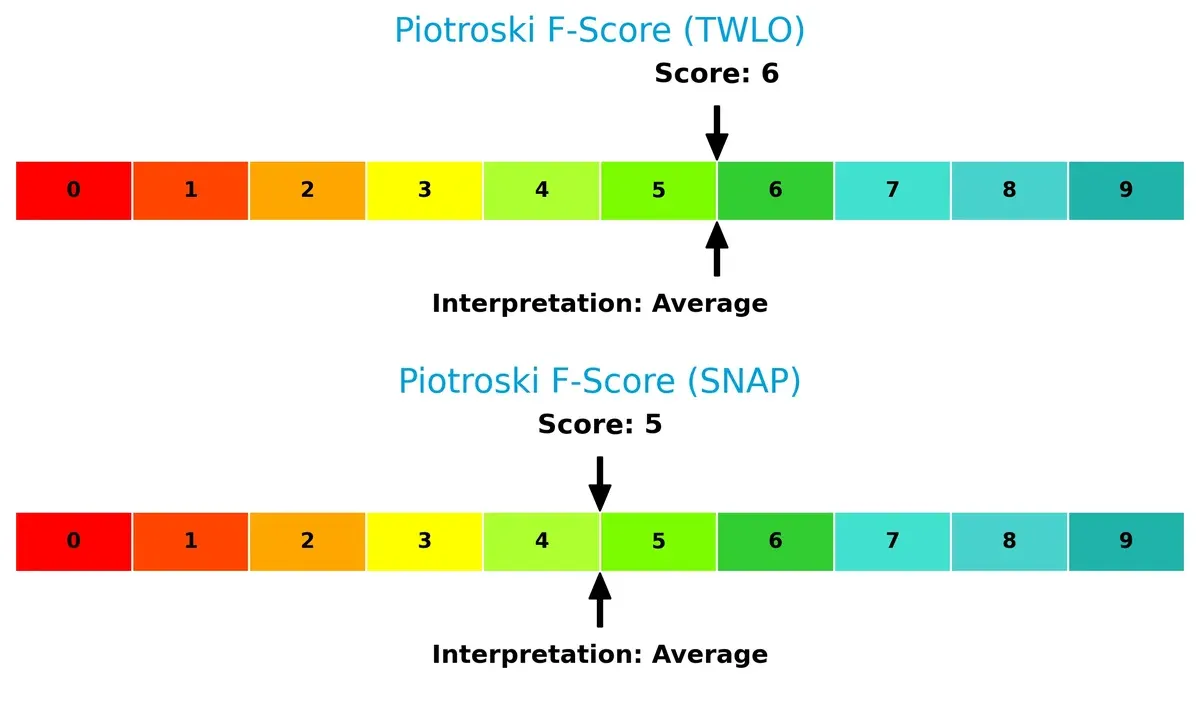
Financial Health: Quality of Operations
Both companies have average Piotroski F-Scores, but Twilio’s 6 edges Snap’s 5 slightly, suggesting marginally better operational quality without glaring red flags:
How are the two companies positioned?
This section dissects Twilio and Snap’s operational DNA by comparing revenue distribution and internal dynamics. The goal is to confront their economic moats to identify which model offers the most resilient competitive advantage today.
Revenue Segmentation: The Strategic Mix
The following visual comparison dissects how Twilio Inc. and Snap Inc. diversify their income streams and where their primary sector bets lie:
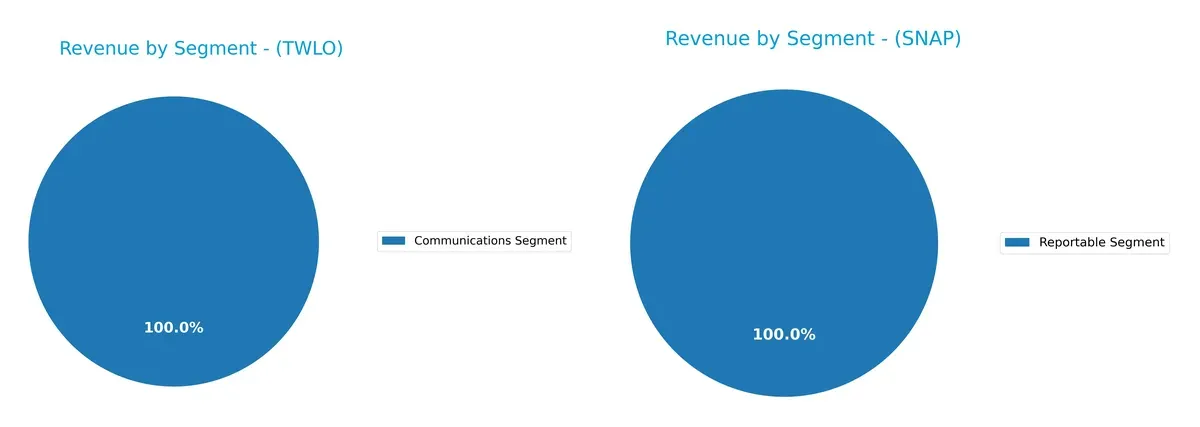
Twilio Inc. shows a concentration in its Communications Segment with $4.16B in 2024, reflecting a focused revenue base. Snap Inc.’s sole Reportable Segment of $5.36B suggests less granular public segmentation. Twilio’s narrower mix implies reliance on ecosystem lock-in within communications infrastructure, while Snap’s undifferentiated revenue hints at a singular strategic focus, exposing it to concentration risk despite its larger scale.
Strengths and Weaknesses Comparison
This table compares the Strengths and Weaknesses of Twilio Inc. and Snap Inc.:
Twilio Inc. Strengths
- Diverse product segments in communications and software
- Strong US and growing non-US revenue base
- Favorable quick ratio and low debt levels
- High fixed asset turnover indicates efficient asset use
Snap Inc. Strengths
- Large total revenue with strong North American market share
- Favorable quick ratio and fixed asset turnover
- Growing presence in Europe and Rest of World
- High price-to-earnings ratio despite losses
Twilio Inc. Weaknesses
- Negative net margin, ROE, and ROIC indicate poor profitability
- Unfavorable current ratio despite high quick ratio
- Zero interest coverage suggests financial stress
- Asset turnover below industry norms
- No dividend yield
Snap Inc. Weaknesses
- Substantial net losses with poor profitability metrics
- High debt-to-equity and debt-to-assets ratios raise leverage concerns
- Negative interest coverage ratio indicates weak financial health
- Elevated price-to-book ratio may imply overvaluation
- No dividend yield
Twilio shows operational efficiency and lower leverage but struggles with profitability and liquidity. Snap has a broader global footprint but faces more severe profitability and leverage challenges. Both companies need to address profitability to improve financial stability.
The Moat Duel: Analyzing Competitive Defensibility
A structural moat is the only thing protecting long-term profits from relentless competition erosion. Here’s how Twilio and Snap stack up:
Twilio Inc.: Developer Ecosystem and API Switching Costs
Twilio’s moat centers on high switching costs embedded in its developer platform and APIs. This drives stable margins despite negative net income. Expanding into new communication channels in 2026 could deepen this advantage.
Snap Inc.: Network Effects and User Engagement
Snap’s moat relies on strong network effects and user engagement through its camera and social apps. Unlike Twilio, Snap leverages a broad consumer base, driving robust revenue growth and margin expansion potential in emerging ad formats.
The Moat Battle: Switching Costs vs. Network Effects
Twilio’s moat is deep but currently eroding as ROIC lags WACC, signaling value destruction despite improving profitability. Snap’s growing ROIC trend and expansive user network suggest a more durable moat. Snap appears better positioned to defend and grow market share amid evolving industry dynamics.
Which stock offers better returns?
Over the past year, Twilio’s stock surged significantly before recent pullbacks, while Snap’s shares declined steadily with mild acceleration in selling pressure.
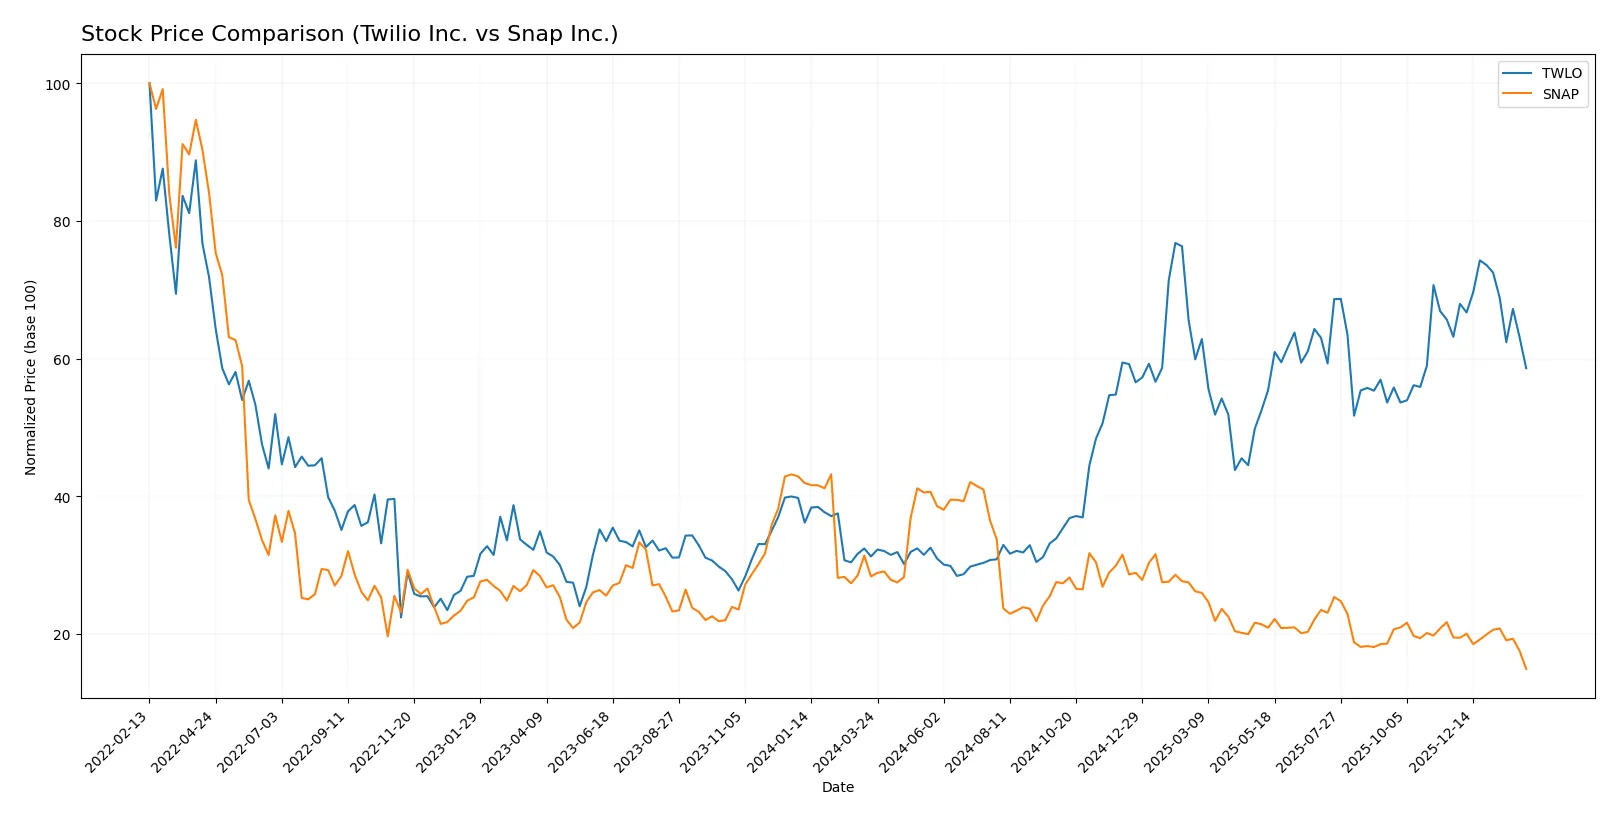
Trend Comparison
Twilio’s stock price increased 87.48% over the past 12 months, marking a bullish trend despite recent deceleration and a 7.23% drop in the last quarter. Snap’s stock fell 47.36% over the same period, reflecting a bearish trend with decelerating losses and a sharper 23.41% decline recently. Twilio outperformed Snap with a substantially higher overall return and stronger price momentum throughout the year.
Target Prices
Analysts present a cautiously optimistic consensus for Twilio Inc. and Snap Inc.
| Company | Target Low | Target High | Consensus |
|---|---|---|---|
| Twilio Inc. | 100 | 170 | 147.27 |
| Snap Inc. | 7 | 10 | 8.72 |
Twilio’s consensus target of 147.27 suggests a 32% upside from its 111.85 price, reflecting confidence in its cloud communications platform. Snap’s target of 8.72 indicates a 48% potential gain from 5.89, signaling strong growth expectations despite recent volatility.

Don’t Let Luck Decide Your Entry Point
Optimize your entry points with our advanced ProRealTime indicators. You’ll get efficient buy signals with precise price targets for maximum performance. Start outperforming now!
How do institutions grade them?
Twilio Inc. Grades
The following table summarizes recent grades issued by major financial institutions for Twilio Inc.:
| Grading Company | Action | New Grade | Date |
|---|---|---|---|
| Morgan Stanley | Maintain | Overweight | 2026-01-15 |
| Rosenblatt | Maintain | Buy | 2026-01-07 |
| Piper Sandler | Downgrade | Neutral | 2026-01-05 |
| RBC Capital | Maintain | Underperform | 2026-01-05 |
| Citizens | Maintain | Market Outperform | 2025-12-30 |
| Keybanc | Maintain | Overweight | 2025-10-31 |
| Piper Sandler | Maintain | Overweight | 2025-10-31 |
| B of A Securities | Maintain | Underperform | 2025-10-31 |
| Mizuho | Maintain | Outperform | 2025-10-31 |
| TD Cowen | Maintain | Hold | 2025-10-31 |
Snap Inc. Grades
The following table summarizes recent grades issued by major financial institutions for Snap Inc.:
| Grading Company | Action | New Grade | Date |
|---|---|---|---|
| Roth Capital | Maintain | Neutral | 2026-01-30 |
| UBS | Maintain | Neutral | 2026-01-20 |
| Morgan Stanley | Maintain | Equal Weight | 2026-01-13 |
| Goldman Sachs | Maintain | Neutral | 2026-01-13 |
| Guggenheim | Maintain | Neutral | 2025-12-19 |
| Citigroup | Maintain | Neutral | 2025-11-12 |
| Truist Securities | Maintain | Hold | 2025-11-07 |
| Wells Fargo | Maintain | Equal Weight | 2025-11-06 |
| BMO Capital | Maintain | Outperform | 2025-11-06 |
| UBS | Maintain | Neutral | 2025-11-06 |
Which company has the best grades?
Twilio Inc. holds a wider distribution of grades, including multiple Overweight and Buy ratings, suggesting stronger institutional support. Snap Inc.’s grades cluster around Neutral and Hold, indicating more cautious sentiment. Investors may interpret Twilio’s higher grades as a sign of greater confidence from analysts.
Risks specific to each company
The following categories identify the critical pressure points and systemic threats facing both firms in the 2026 market environment:
1. Market & Competition
Twilio Inc.
- Faces intense competition in cloud communications from established tech giants and niche API providers.
Snap Inc.
- Competes fiercely in social media and digital advertising with larger platforms and emerging apps.
2. Capital Structure & Debt
Twilio Inc.
- Maintains low debt levels (D/E 0.14) and manageable leverage, reducing financial risk.
Snap Inc.
- Carries high debt burden (D/E 1.73), increasing financial vulnerability amid earnings pressure.
3. Stock Volatility
Twilio Inc.
- Beta of 1.31 suggests above-market volatility but still within typical tech sector range.
Snap Inc.
- Beta of 0.80 indicates lower volatility but with significant volume spikes, reflecting speculative trading.
4. Regulatory & Legal
Twilio Inc.
- Subject to data privacy and telecom regulations in multiple jurisdictions, with compliance costs rising.
Snap Inc.
- Faces scrutiny over user privacy, content moderation, and advertising practices globally.
5. Supply Chain & Operations
Twilio Inc.
- Relies on robust cloud infrastructure partners but vulnerable to service interruptions and cost inflation.
Snap Inc.
- Dependent on hardware manufacturing for Spectacles and steady ad platform operations, exposed to supply delays.
6. ESG & Climate Transition
Twilio Inc.
- Increasing pressure to reduce carbon footprint from extensive data centers and cloud usage.
Snap Inc.
- Faces challenges integrating ESG into product lifecycle and advertising ethics amid growing investor demands.
7. Geopolitical Exposure
Twilio Inc.
- Global customer base exposes it to trade tensions and regulatory shifts, especially US-China tech rivalry.
Snap Inc.
- International user base subjects it to varying censorship laws and geopolitical risks in key markets.
Which company shows a better risk-adjusted profile?
Twilio’s most impactful risk lies in intense competition eroding pricing power. Snap’s greatest risk is its high leverage amid persistent losses. Twilio’s stronger balance sheet and safe-zone Altman Z-score reflect a comparatively better risk-adjusted profile. Snap’s distress-zone Z-score and heavy debt amplify vulnerability, raising my caution despite its lower beta.
Final Verdict: Which stock to choose?
Twilio Inc. stands out for its unmatched operational efficiency and steadily improving profitability, hinting at a maturing business model. Its key point of vigilance remains the negative returns on invested capital, signaling ongoing value destruction despite growth. It fits well in an aggressive growth portfolio willing to tolerate some risk for potential future payoff.
Snap Inc. offers a strategic moat through its dominant presence in social media innovation and strong revenue growth momentum. However, its high leverage and weaker financial stability relative to Twilio raise caution flags. Snap suits investors seeking growth at a reasonable price (GARP) who prefer a dynamic but riskier profile.
If you prioritize operational efficiency and improving profitability, Twilio is the compelling choice due to its cash flow strength and solid balance sheet. However, if you seek innovation-driven growth with a tolerance for financial risk, Snap offers superior market presence and revenue expansion potential. Both require careful risk management given their fundamental challenges.
Disclaimer: Investment carries a risk of loss of initial capital. The past performance is not a reliable indicator of future results. Be sure to understand risks before making an investment decision.
Go Further
I encourage you to read the complete analyses of Twilio Inc. and Snap Inc. to enhance your investment decisions: