Home > Comparison > Industrials > SNA vs SWK
The strategic rivalry between Snap-on Incorporated and Stanley Black & Decker defines the current trajectory of the tools and accessories manufacturing sector. Snap-on operates as a specialized, high-precision tool and diagnostic solutions provider, while Stanley Black & Decker commands a diversified portfolio spanning professional and consumer power tools alongside industrial equipment. This analysis explores their contrasting operational models to identify which offers superior risk-adjusted returns for a diversified portfolio in the evolving industrial landscape.

Table of contents
Companies Overview
Snap-on Incorporated and Stanley Black & Decker, Inc. both command significant influence in the global tools and accessories manufacturing industry.
Snap-on Incorporated: Precision Tools for Professionals
Snap-on stands as a leading provider of professional tools and diagnostic systems. Its revenue stems primarily from selling hand and power tools, diagnostic products, and repair information systems. In 2026, the company strategically focuses on expanding service solutions and financing programs targeting specialized industrial and vehicle service sectors.
Stanley Black & Decker, Inc.: Diverse Industrial Powerhouse
Stanley Black & Decker operates as a broad-based manufacturer of professional and consumer tools alongside industrial fastening and pipeline equipment. Its core income derives from power tools, storage products, and engineered fastening systems. The 2026 strategy emphasizes growth across professional and consumer segments with industrial solutions for energy and construction markets.
Strategic Collision: Similarities & Divergences
Both companies leverage manufacturing strength in tools and accessories but pursue different philosophies. Snap-on targets niche professional users with integrated service offerings, while Stanley Black & Decker embraces a broader market including consumer power tools and industrial equipment. Their primary battleground lies in professional tools market share. Investors encounter distinct profiles: Snap-on as a specialized, service-driven player versus Stanley Black & Decker’s diversified industrial conglomerate.
Income Statement Comparison
This data dissects the core profitability and scalability of both corporate engines to reveal who dominates the bottom line:
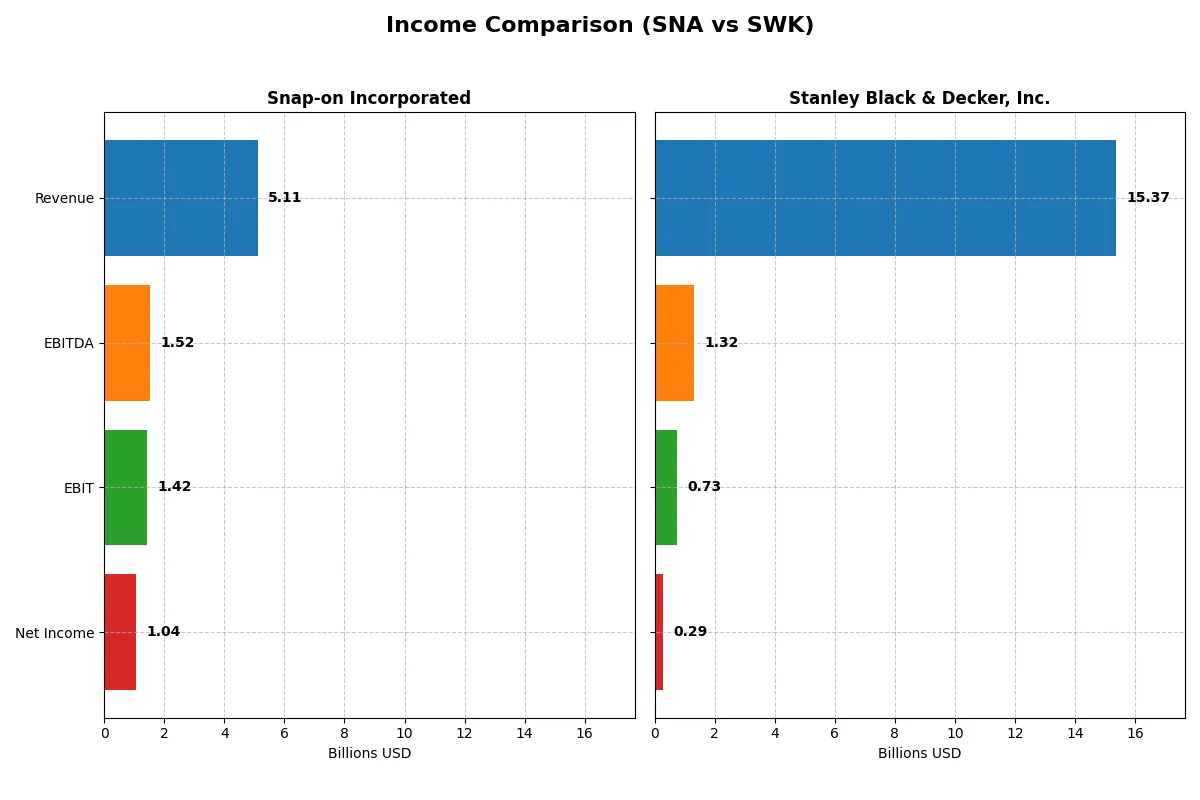
| Metric | Snap-on Incorporated (SNA) | Stanley Black & Decker, Inc. (SWK) |
|---|---|---|
| Revenue | 5.11B | 15.37B |
| Cost of Revenue | 2.45B | 10.76B |
| Operating Expenses | 1.31B | 3.25B |
| Gross Profit | 2.65B | 4.60B |
| EBITDA | 1.52B | 1.32B |
| EBIT | 1.42B | 0.73B |
| Interest Expense | 49.6M | 498.6M |
| Net Income | 1.04B | 286.3M |
| EPS | 19.85 | 1.96 |
| Fiscal Year | 2024 | 2024 |
Income Statement Analysis: The Bottom-Line Duel
This income statement comparison reveals how efficiently each company converts sales into profits and controls expenses over time.
Snap-on Incorporated Analysis
Snap-on’s revenue rose steadily from 3.6B in 2020 to 5.1B in 2024, with net income growing from 627M to 1.04B. Gross margin holds strong near 52%, while net margin improved to 20.4%. In 2024, Snap-on’s disciplined cost control and rising EPS reflect solid operational momentum and margin expansion.
Stanley Black & Decker, Inc. Analysis
Stanley Black & Decker’s revenue peaked at 17B in 2022 but declined to 15.4B in 2024. Net income plunged from 1.21B in 2020 to 286M in 2024, with net margin barely above 1.8%. Despite a recent surge in EBIT and net margin growth, persistent revenue decline and volatile profitability mark a challenging profit landscape.
Margin Strength vs. Revenue Scale
Snap-on demonstrates superior margin health and consistent net income growth, reflecting operational efficiency and profitability resilience. Stanley Black & Decker commands larger revenue but faces margin compression and earnings volatility. For investors, Snap-on’s stable margin profile offers a clearer path to sustainable returns compared to Stanley’s scale-driven but uneven earnings.
Financial Ratios Comparison
These vital ratios act as a diagnostic tool to expose the underlying fiscal health, valuation premiums, and capital efficiency of the companies analyzed:
| Ratios | Snap-on Incorporated (SNA) | Stanley Black & Decker, Inc. (SWK) |
|---|---|---|
| ROE | 19.4% | 3.3% |
| ROIC | 15.0% | 7.7% |
| P/E | 17.3 | 42.4 |
| P/B | 3.35 | 1.39 |
| Current Ratio | 4.15 | 1.30 |
| Quick Ratio | 3.17 | 0.37 |
| D/E | 0.24 | 0.76 |
| Debt-to-Assets | 16.4% | 30.2% |
| Interest Coverage | 27.1 | 2.7 |
| Asset Turnover | 0.65 | 0.70 |
| Fixed Asset Turnover | 8.08 | 7.55 |
| Payout Ratio | 39% | 172% |
| Dividend Yield | 2.25% | 4.05% |
| Fiscal Year | 2024 | 2024 |
Efficiency & Valuation Duel: The Vital Signs
Financial ratios act as a company’s DNA, uncovering hidden risks, operational strengths, and valuation truths beneath surface numbers.
Snap-on Incorporated
Snap-on delivers strong profitability with a 19.35% ROE and a robust 20.43% net margin, signaling operational excellence. Its P/E ratio of 17.31 remains reasonable, though a 3.35 PB ratio appears stretched. The company returns value through a 2.25% dividend yield, balancing shareholder rewards with steady capital discipline.
Stanley Black & Decker, Inc.
Stanley Black & Decker struggles with a low 3.28% ROE and a thin 1.86% net margin, reflecting weak profitability. A high P/E of 42.35 marks the stock as expensive despite a favorable 1.39 PB ratio. It offers a 4.05% dividend yield, but concerning interest coverage and liquidity ratios signal financial strain.
Premium Valuation vs. Operational Safety
Snap-on offers better profitability and valuation balance, with strong returns and manageable debt, while Stanley Black & Decker carries higher risk and stretched valuation. Risk-tolerant income seekers may prefer Stanley, but cautious investors favor Snap-on’s operational resilience.
Which one offers the Superior Shareholder Reward?
Snap-on Incorporated (SNA) pays a steady dividend yield around 2.3%, with a moderate payout ratio near 39%, well-covered by strong free cash flow (FCF). Its buyback program is consistent, enhancing total shareholder return sustainably. Stanley Black & Decker, Inc. (SWK) offers a higher dividend yield near 4%, but with payout ratios exceeding 100%, signaling unsustainable dividends. SWK’s buybacks are modest and cash flow coverage weak, raising red flags. I believe SNA’s balanced distribution and cash flow management provide a superior, more reliable total return profile in 2026.
Comparative Score Analysis: The Strategic Profile
The radar chart reveals the fundamental DNA and trade-offs of Snap-on Incorporated and Stanley Black & Decker, Inc., highlighting their core financial strengths and vulnerabilities:
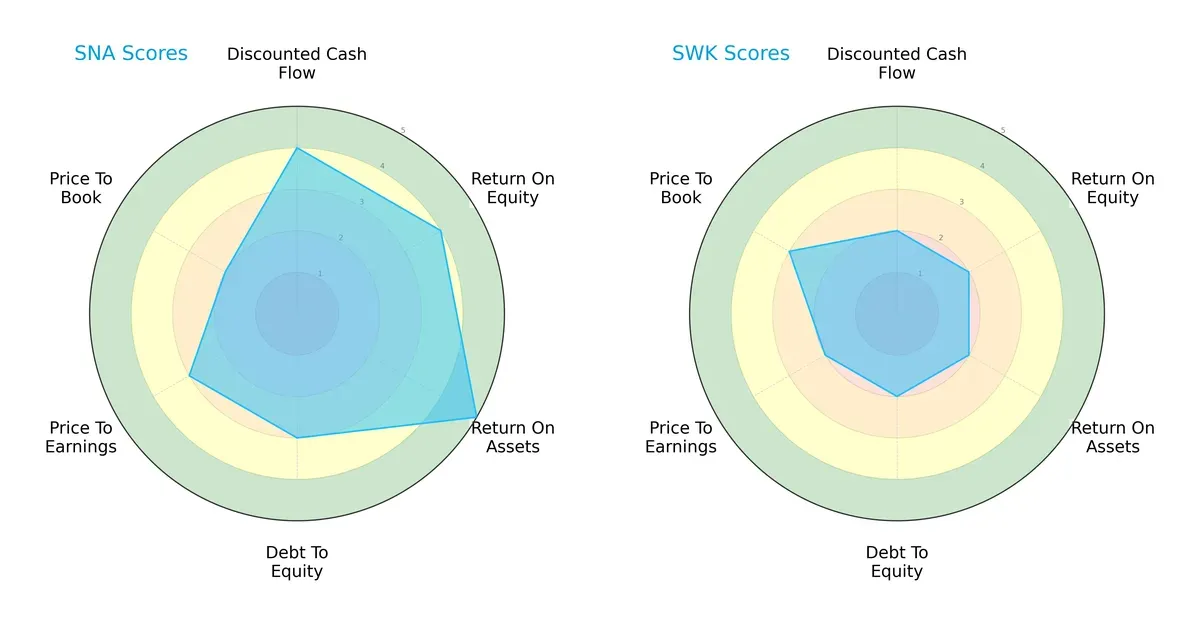
Snap-on exhibits a more balanced profile with strong DCF (4), ROE (4), and ROA (5) scores, indicating high profitability and asset efficiency. Its moderate debt-to-equity (3) and valuation scores (P/E 3, P/B 2) suggest prudent leverage and reasonable pricing. Stanley Black & Decker relies on a weaker edge with uniformly moderate scores around 2 to 3, showing less financial robustness and efficiency. Snap-on’s superior return metrics and cash flow projections make it the stronger all-around performer.
Bankruptcy Risk: Solvency Showdown
The Altman Z-Score difference signals Snap-on’s superior long-term solvency safety compared to Stanley Black & Decker:
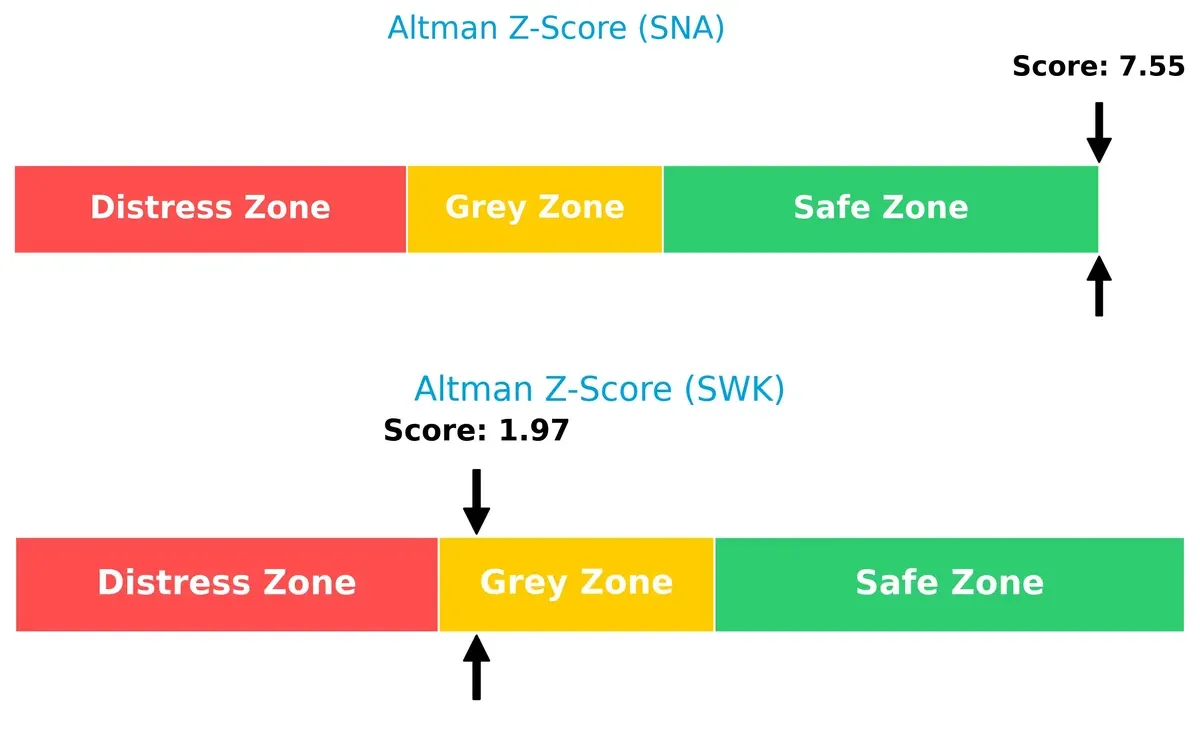
Snap-on’s Z-Score of 7.55 places it well within the safe zone, reflecting strong financial stability and low bankruptcy risk. Stanley Black & Decker’s 1.97 score lands in the grey zone, indicating moderate distress risk amid market volatility. This gap underscores Snap-on’s resilience in economic cycles and Stanley’s vulnerability to financial shocks.
Financial Health: Quality of Operations
Piotroski F-Scores reveal operational quality and internal financial health differences between the two firms:
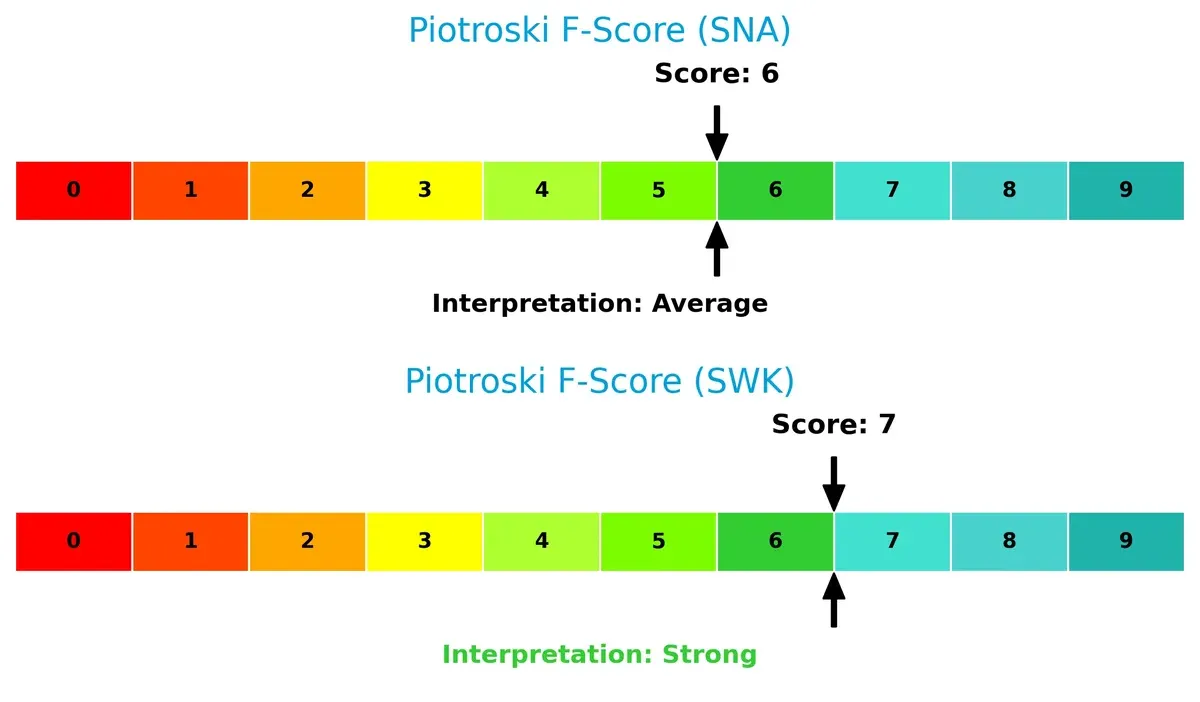
Stanley Black & Decker scores 7, indicating strong internal financial metrics and operational efficiency. Snap-on’s 6, while average, suggests some caution is warranted as it may face minor red flags in profitability or liquidity. Despite Snap-on’s superior strategic profile, Stanley’s higher Piotroski score shows better recent financial health on a granular level.
How are the two companies positioned?
This section dissects the operational DNA of Snap-on and Stanley Black & Decker by comparing their revenue distribution and internal dynamics. The goal is to confront their economic moats and identify which model offers the most resilient competitive advantage today.
Revenue Segmentation: The Strategic Mix
This comparison dissects how Snap-on Incorporated and Stanley Black & Decker, Inc. diversify their income streams and where their primary sector bets lie:
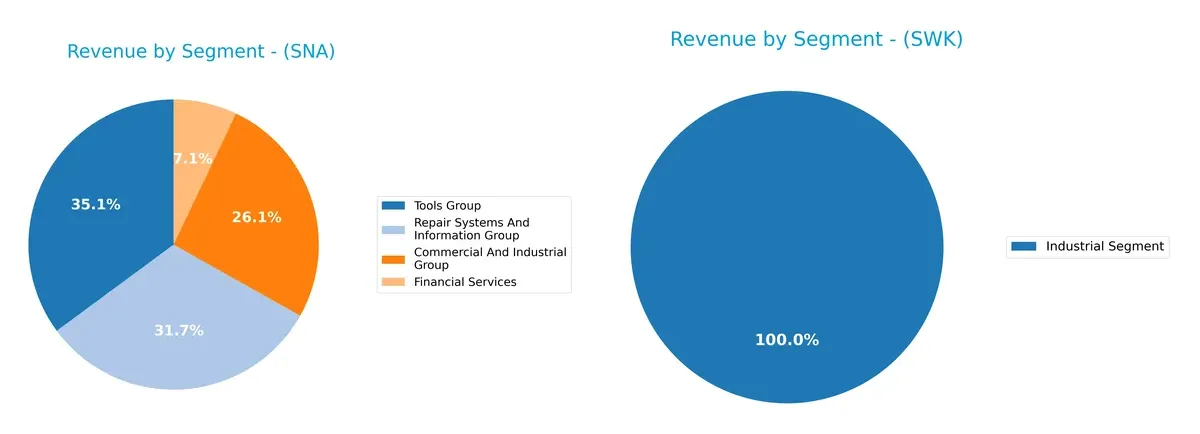
Snap-on shows a balanced revenue mix with Tools Group at $1.99B, Repair Systems at $1.80B, and Commercial & Industrial at $1.48B, plus $401M from Financial Services. Stanley Black & Decker pivots heavily on Construction and DIY, with over $12.8B in 2021, dwarfs its $2.06B Industrial segment in 2024. Snap-on’s diversification reduces concentration risk, while Stanley’s reliance on a dominant segment suggests strong ecosystem lock-in but vulnerability to construction cycles.
Strengths and Weaknesses Comparison
This table compares the Strengths and Weaknesses of Snap-on Incorporated and Stanley Black & Decker, Inc.:
Snap-on Incorporated Strengths
- High profitability with 20.43% net margin and 19.35% ROE
- Strong capital efficiency with 15.02% ROIC well above 7.27% WACC
- Robust liquidity shown by 3.17 quick ratio
- Low leverage with 0.24 debt-to-equity ratio and 16.37% debt-to-assets
- Diversified revenue streams across tools, repair, commercial, and financial services
- Solid global presence focused on North America and Europe
Stanley Black & Decker Strengths
- Favorable price-to-book ratio at 1.39 indicates undervaluation relative to book value
- Higher dividend yield at 4.05% appeals to income investors
- Favorable fixed asset turnover at 7.55 supports efficient asset use
- Large global footprint including significant U.S., European, and Asian markets
- Diversification into industrial and construction segments
Snap-on Incorporated Weaknesses
- Unfavorable current ratio at 4.15 may indicate inefficient working capital management
- Unfavorable price-to-book ratio of 3.35 suggests possible overvaluation
- Neutral asset turnover of 0.65 implies moderate operational efficiency
Stanley Black & Decker Weaknesses
- Low profitability with 1.86% net margin and 3.28% ROE
- Weak liquidity with 0.37 quick ratio and 1.47 interest coverage ratio
- Higher leverage at 0.76 debt-to-equity ratio and 30.18% debt-to-assets
- Elevated price-to-earnings ratio of 42.35 raises valuation concerns
- Neutral ROIC of 7.69% barely exceeds WACC of 8.21%, indicating limited value creation
Overall, Snap-on demonstrates strong profitability and conservative leverage, supporting its diversified product mix and stable global presence. Stanley Black & Decker offers broad geographic reach and income appeal but faces challenges in profitability and financial leverage. These factors shape each company’s strategic focus on operational efficiency versus market expansion.
The Moat Duel: Analyzing Competitive Defensibility
A structural moat shields long-term profits from relentless competitive pressure and market disruption. Here’s how Snap-on and Stanley Black & Decker compare:
Snap-on Incorporated: Intangible Assets and Customer Loyalty Fortress
Snap-on’s moat centers on strong intangible assets and high switching costs. Its 28% EBIT margin and steadily rising ROIC reveal durable profitability. New diagnostic tech in 2026 could deepen this moat.
Stanley Black & Decker, Inc.: Scale and Diversified Industrial Ecosystem
Stanley Black & Decker relies on scale and diversified product lines. Its lower 5% EBIT margin and declining ROIC expose vulnerability. Yet, industrial automation expansion offers upside, albeit with competitive risks.
Profitability Precision vs. Scale Ambition
Snap-on’s deeper moat stems from superior ROIC (+7.75% over WACC) and margin stability. Stanley Black & Decker’s shrinking ROIC and margin erosion signal weakening defensibility. Snap-on stands better poised to defend its market share through focused innovation and customer retention.
Which stock offers better returns?
Over the past year, Snap-on Incorporated’s stock surged 32.4%, showing accelerating bullish momentum, while Stanley Black & Decker, Inc. declined 3.99%, reflecting accelerating bearish pressure.
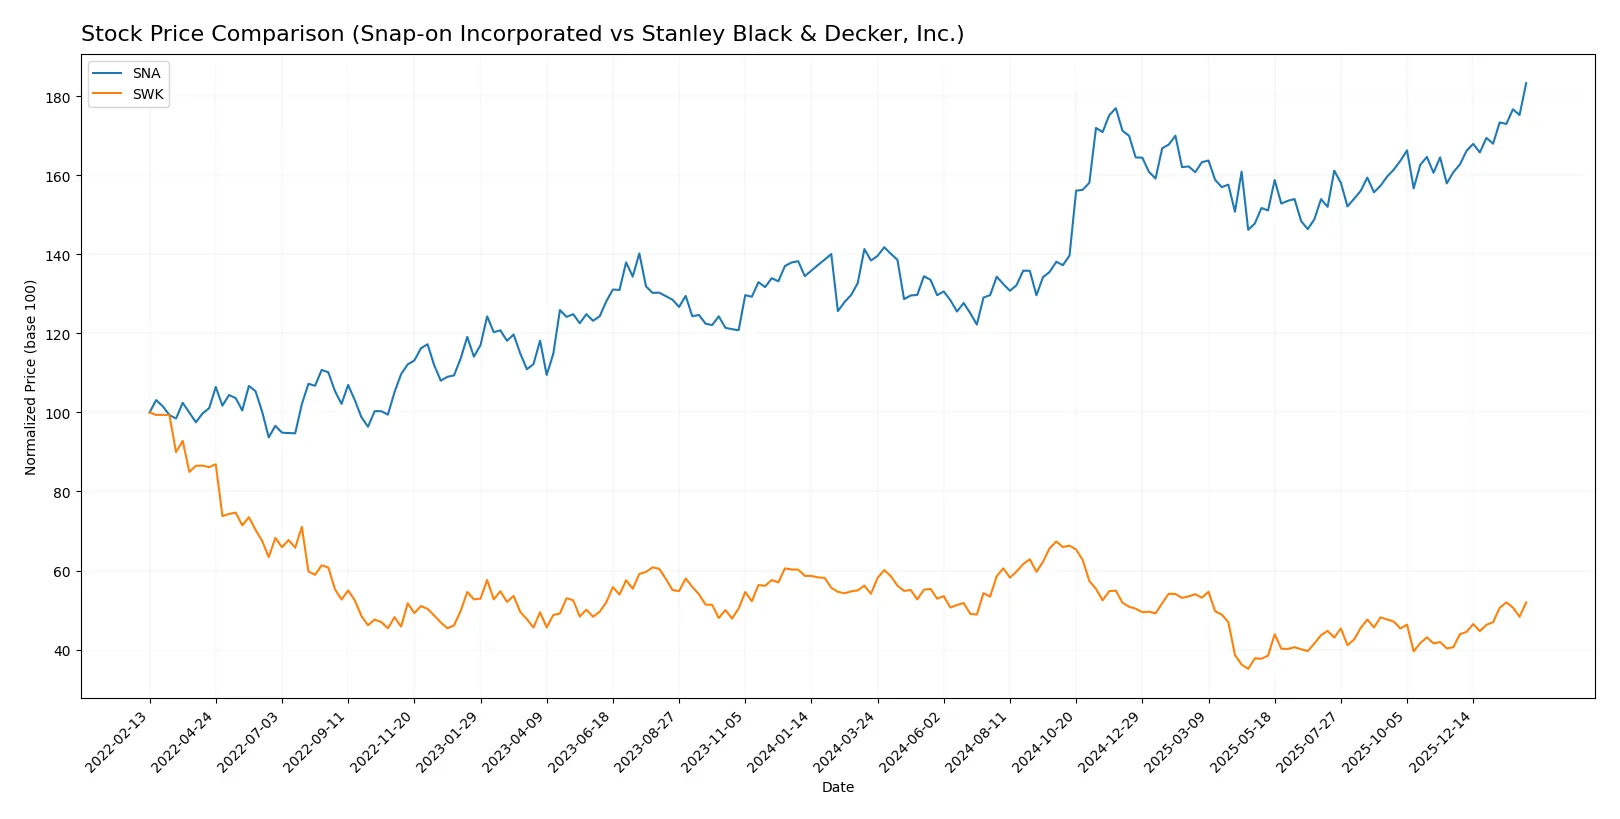
Trend Comparison
Snap-on’s stock gained 32.4% over 12 months, confirming a bullish trend with accelerating price momentum and a high volatility of 31.4. Its price range spans from 255.35 to 382.91.
Stanley Black & Decker’s stock fell 3.99% over the same period, marking a bearish trend that also accelerated. Volatility is lower at 12.3, with prices ranging between 57.21 and 109.72.
Snap-on outperformed Stanley Black & Decker by a wide margin, delivering the highest market return and sustained bullish acceleration.
Target Prices
Analysts present a clear target price consensus for Snap-on Incorporated and Stanley Black & Decker, reflecting cautious optimism.
| Company | Target Low | Target High | Consensus |
|---|---|---|---|
| Snap-on Incorporated | 370 | 405 | 386.67 |
| Stanley Black & Decker, Inc. | 82 | 98 | 87.8 |
The target consensus for Snap-on at 386.67 slightly exceeds its current price of 382.91, suggesting modest upside potential. Stanley Black & Decker’s consensus target of 87.8 stands above its 84.63 price, indicating moderate expected appreciation.

Don’t Let Luck Decide Your Entry Point
Optimize your entry points with our advanced ProRealTime indicators. You’ll get efficient buy signals with precise price targets for maximum performance. Start outperforming now!
How do institutions grade them?
Here is a summary of recent institutional grades for Snap-on Incorporated and Stanley Black & Decker, Inc.:
Snap-on Incorporated Grades
The following table shows recent grades assigned by reputable grading companies to Snap-on Incorporated:
| Grading Company | Action | New Grade | Date |
|---|---|---|---|
| Tigress Financial | Maintain | Buy | 2025-10-21 |
| Baird | Maintain | Neutral | 2025-10-17 |
| Barrington Research | Maintain | Outperform | 2025-10-15 |
| Barrington Research | Maintain | Outperform | 2025-09-23 |
| Tigress Financial | Maintain | Buy | 2025-08-29 |
| Barrington Research | Maintain | Outperform | 2025-07-18 |
| B of A Securities | Maintain | Underperform | 2025-07-18 |
| Baird | Maintain | Neutral | 2025-07-18 |
| Barrington Research | Maintain | Outperform | 2025-07-17 |
| Barrington Research | Maintain | Outperform | 2025-07-15 |
Stanley Black & Decker, Inc. Grades
The following table shows recent grades assigned by reputable grading companies to Stanley Black & Decker, Inc.:
| Grading Company | Action | New Grade | Date |
|---|---|---|---|
| Wells Fargo | Maintain | Equal Weight | 2026-01-14 |
| UBS | Maintain | Buy | 2026-01-05 |
| Baird | Maintain | Neutral | 2025-12-23 |
| UBS | Maintain | Buy | 2025-11-06 |
| Wells Fargo | Maintain | Equal Weight | 2025-11-05 |
| Wells Fargo | Maintain | Equal Weight | 2025-10-06 |
| Wells Fargo | Maintain | Equal Weight | 2025-07-30 |
| Barclays | Maintain | Overweight | 2025-07-30 |
| Baird | Maintain | Neutral | 2025-07-22 |
| Wolfe Research | Upgrade | Peer Perform | 2025-07-08 |
Which company has the best grades?
Snap-on Incorporated generally receives stronger grades, with multiple “Outperform” and “Buy” ratings from respected firms. Stanley Black & Decker mostly holds “Equal Weight” and “Neutral” ratings, with some “Buy” and “Overweight” exceptions. Investors may view Snap-on’s grades as signaling greater confidence from analysts.
Risks specific to each company
The following categories identify the critical pressure points and systemic threats facing both firms in the 2026 market environment:
1. Market & Competition
Snap-on Incorporated
- Strong niche in professional tools with solid margins but faces intense competition in diagnostics and aftermarket services.
Stanley Black & Decker, Inc.
- Broader product range with exposure to consumer markets increases competitive pressure and margin compression risks.
2. Capital Structure & Debt
Snap-on Incorporated
- Low debt-to-equity (0.24) and high interest coverage (28.7) indicate conservative leverage and strong debt service capacity.
Stanley Black & Decker, Inc.
- Higher leverage (D/E 0.76) and weak interest coverage (1.47) raise concerns over financial flexibility and refinancing risk.
3. Stock Volatility
Snap-on Incorporated
- Beta of 0.79 suggests relatively low stock volatility, appealing for risk-averse investors.
Stanley Black & Decker, Inc.
- Beta of 1.20 signals above-market volatility, increasing risk during economic downturns.
4. Regulatory & Legal
Snap-on Incorporated
- Risks stem mainly from international trade policies affecting industrial sectors and product certifications.
Stanley Black & Decker, Inc.
- Broader global footprint exposes the firm to varied regulatory regimes and potential legal complexities.
5. Supply Chain & Operations
Snap-on Incorporated
- Efficient asset turnover and focused supply chain reduce operational risks.
Stanley Black & Decker, Inc.
- Complex supply chain across multiple product lines heightens vulnerability to disruptions and cost inflation.
6. ESG & Climate Transition
Snap-on Incorporated
- Moderate exposure with ongoing investments in sustainable products and operational improvements.
Stanley Black & Decker, Inc.
- Faces pressure to enhance ESG disclosures and reduce carbon footprint, especially in industrial segments.
7. Geopolitical Exposure
Snap-on Incorporated
- Primarily US-based with limited geopolitical risk but some exposure to global markets.
Stanley Black & Decker, Inc.
- Significant international operations increase risks from trade tensions and geopolitical instability.
Which company shows a better risk-adjusted profile?
Snap-on’s strongest risk is its market niche’s vulnerability to technological disruption in diagnostics. Stanley Black & Decker’s greatest risk is its elevated leverage and weak interest coverage, raising financial distress concerns. Snap-on’s conservative capital structure and lower stock volatility give it a superior risk-adjusted profile. Recent data shows Snap-on’s Altman Z-Score of 7.55 places it safely above distress zones, unlike Stanley’s borderline 1.97 score, underscoring the latter’s financial fragility.
Final Verdict: Which stock to choose?
Snap-on Incorporated stands out as a powerhouse of operational efficiency and capital discipline. Its ability to generate returns well above its cost of capital signals a durable competitive edge and consistent value creation. A point of vigilance remains its elevated current ratio, which might indicate excess working capital tied up. This stock suits portfolios focused on aggressive growth with a margin of safety.
Stanley Black & Decker offers a strategic moat through its entrenched market presence and recurring revenue streams. While its profitability metrics lag behind Snap-on’s, it presents a more conservative valuation and a stronger dividend yield, appealing to income-focused investors. Its safety profile is moderate but fits well within GARP (Growth at a Reasonable Price) strategies seeking stability and income.
If you prioritize sustainable value creation and operational excellence, Snap-on outshines due to its superior ROIC and financial resilience. However, if your strategy leans toward income and moderate growth with a focus on valuation, Stanley Black & Decker offers better stability and a compelling dividend profile despite its challenges. Both scenarios demand careful risk assessment aligned with your investment goals.
Disclaimer: Investment carries a risk of loss of initial capital. The past performance is not a reliable indicator of future results. Be sure to understand risks before making an investment decision.
Go Further
I encourage you to read the complete analyses of Snap-on Incorporated and Stanley Black & Decker, Inc. to enhance your investment decisions: