Home > Comparison > Energy > SLB vs FTI
The strategic rivalry between SLB N.V. and TechnipFMC plc shapes the Oil & Gas Equipment & Services sector’s future. SLB operates as a global technology leader with diversified energy services and digital integration. In contrast, TechnipFMC focuses on subsea and surface technologies, emphasizing engineering and installation. This analysis pits SLB’s broad innovation against TechnipFMC’s specialized execution to identify which path offers superior risk-adjusted returns for a diversified portfolio.
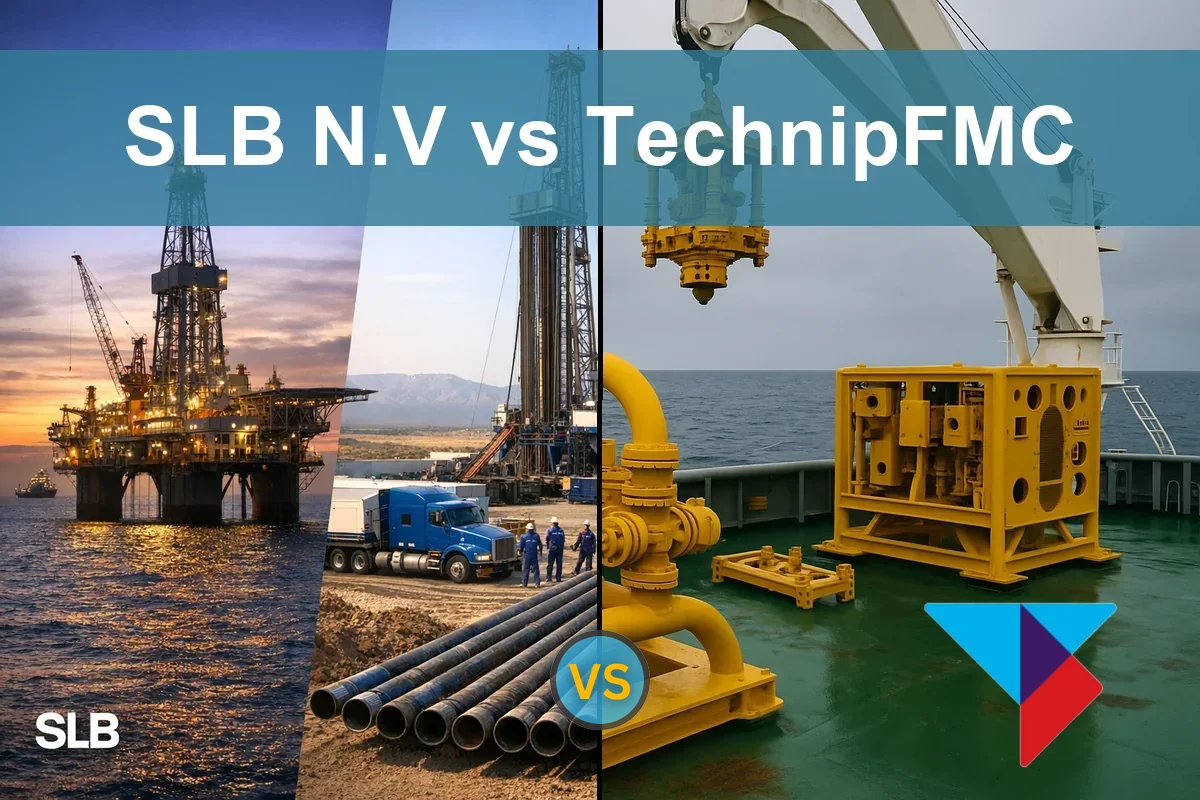
Table of contents
Companies Overview
SLB N.V. and TechnipFMC plc are heavyweight competitors shaping the global oilfield services landscape.
SLB N.V.: Global Energy Technology Leader
SLB dominates the Oil & Gas Equipment & Services sector through advanced technology solutions. Its core revenues stem from integrated services across drilling, production, and reservoir management. In 2026, SLB emphasizes digital integration and carbon management, reinforcing its position in energy transition technologies while maintaining strong operational depth globally.
TechnipFMC plc: Innovation in Subsea and Surface Technologies
TechnipFMC operates as a key player in subsea systems and surface technologies for oil and gas production. Revenue primarily comes from engineering, procurement, and life-of-field services for subsea infrastructure and surface equipment. The 2026 strategic focus highlights partnerships in carbon capture and storage, reflecting a pivot toward sustainable energy solutions amid traditional project delivery.
Strategic Collision: Similarities & Divergences
Both firms pursue cutting-edge technology in oilfield services but diverge in scope: SLB offers a broader integrated portfolio, while TechnipFMC specializes in subsea and surface segments. Their primary battleground is offshore energy infrastructure, where innovation and project execution determine market share. SLB’s vast scale contrasts with TechnipFMC’s niche expertise, defining distinct risk and growth profiles for investors.
Income Statement Comparison
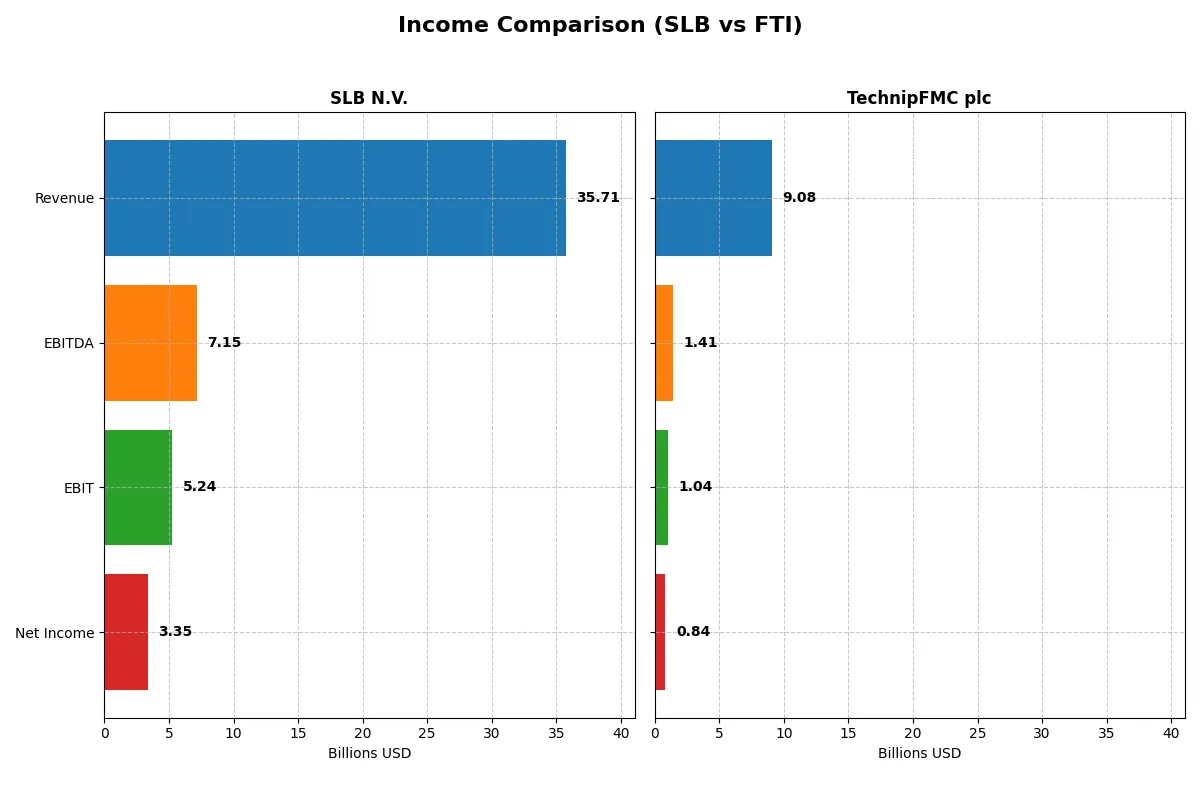
This data dissects the core profitability and scalability of both corporate engines to reveal who dominates the bottom line:
| Metric | SLB N.V. (SLB) | TechnipFMC plc (FTI) |
|---|---|---|
| Revenue | 35.7B | 9.08B |
| Cost of Revenue | 29.2B | 7.37B |
| Operating Expenses | 1.05B | 741M |
| Gross Profit | 6.50B | 1.71B |
| EBITDA | 7.15B | 1.41B |
| EBIT | 5.24B | 1.04B |
| Interest Expense | 557M | 97.4M |
| Net Income | 3.35B | 843M |
| EPS | 2.38 | 1.96 |
| Fiscal Year | 2025 | 2024 |
Income Statement Analysis: The Bottom-Line Duel
This income statement comparison exposes which company runs its financial engine with greater efficiency and momentum over recent years.
SLB N.V. Analysis
SLB’s revenue grew 56% over five years but dipped 1.6% in 2025 to $35.7B. Net income climbed 78% overall but fell 24% last year to $3.35B. The gross margin stayed stable near 18%, while the net margin of 9.4% remains healthy. Despite last year’s earnings decline, SLB sustains strong operating efficiency and solid margin control.
TechnipFMC plc Analysis
TechnipFMC raised revenue 39% over five years, hitting $9.1B in 2024 with a 16% one-year jump. Net income surged from a loss in 2022 to $843M in 2024, a 125% increase overall and a spectacular 3,072% one-year net margin growth. Margins hover near 19% gross and 9.3% net, reflecting rapid profitability recovery and accelerating operational momentum.
Growth Surge vs. Established Scale
TechnipFMC displays sharper growth and margin expansion, improving from losses to strong profitability with robust momentum. SLB delivers steadier, more substantial scale and consistent margins but faces recent earnings softness. Investors seeking rapid turnaround and growth may favor TechnipFMC’s trajectory, while those valuing stable scale and margin durability might prefer SLB’s established profile.
Financial Ratios Comparison
These vital ratios act as a diagnostic tool to expose the underlying fiscal health, valuation premiums, and capital efficiency of each company:
| Ratios | SLB N.V. (SLB) | TechnipFMC plc (FTI) |
|---|---|---|
| ROE | 12.8% | 27.2% |
| ROIC | 10.3% | 16.1% |
| P/E | 16.9 | 14.7 |
| P/B | 2.16 | 4.01 |
| Current Ratio | 1.33 | 1.12 |
| Quick Ratio | 0.98 | 0.88 |
| D/E | 0.47 | 0.58 |
| Debt-to-Assets | 22.4% | 18.2% |
| Interest Coverage | 9.80 | 9.94 |
| Asset Turnover | 0.65 | 0.92 |
| Fixed Asset Turnover | 4.07 | 3.07 |
| Payout Ratio | 47.8% | 10.2% |
| Dividend Yield | 2.84% | 0.69% |
| Fiscal Year | 2025 | 2024 |
Efficiency & Valuation Duel: The Vital Signs
Financial ratios serve as a company’s DNA, revealing hidden risks and operational excellence through precise financial signals.
SLB N.V.
SLB posts a moderate 12.8% ROE and a neutral 9.4% net margin, signaling steady profitability. Its P/E of 16.85 suggests a fairly valued stock, neither cheap nor stretched. SLB supports shareholders with a solid 2.84% dividend yield, reflecting disciplined capital allocation and consistent returns.
TechnipFMC plc
TechnipFMC delivers a robust 27.2% ROE and a solid 9.3% net margin, indicating strong operational efficiency. A lower P/E of 14.73 signals reasonable valuation, though a high 4.01 PB ratio marks some premium on book value. Dividend yield at 0.69% is low, implying reinvestment into growth and R&D.
Balanced Profitability Meets Valuation Discipline
SLB offers a steady yield and balanced valuation with neutral profitability, while TechnipFMC impresses with higher returns but a pricier book value and modest payouts. Investors seeking income may prefer SLB’s dividends; growth-focused profiles might favor TechnipFMC’s reinvestment strategy.
Which one offers the Superior Shareholder Reward?
I compare SLB N.V. and TechnipFMC plc on dividend yield, payout, and buyback intensity. SLB yields ~2.8% with a moderate 48% payout, well-covered by free cash flow (FCF). TechnipFMC yields under 0.7%, with a low 10% payout, reflecting a cautious distribution. SLB’s robust buybacks complement dividends, signaling strong capital return. TechnipFMC’s buybacks are lighter but supported by reinvestment in growth. SLB’s model balances yield and buybacks sustainably, offering superior total return potential in 2026. I favor SLB for its proven shareholder reward and capital allocation discipline.
Comparative Score Analysis: The Strategic Profile
The radar chart reveals the fundamental DNA and trade-offs of SLB N.V. and TechnipFMC plc, illustrating each firm’s financial strengths and valuation nuances:
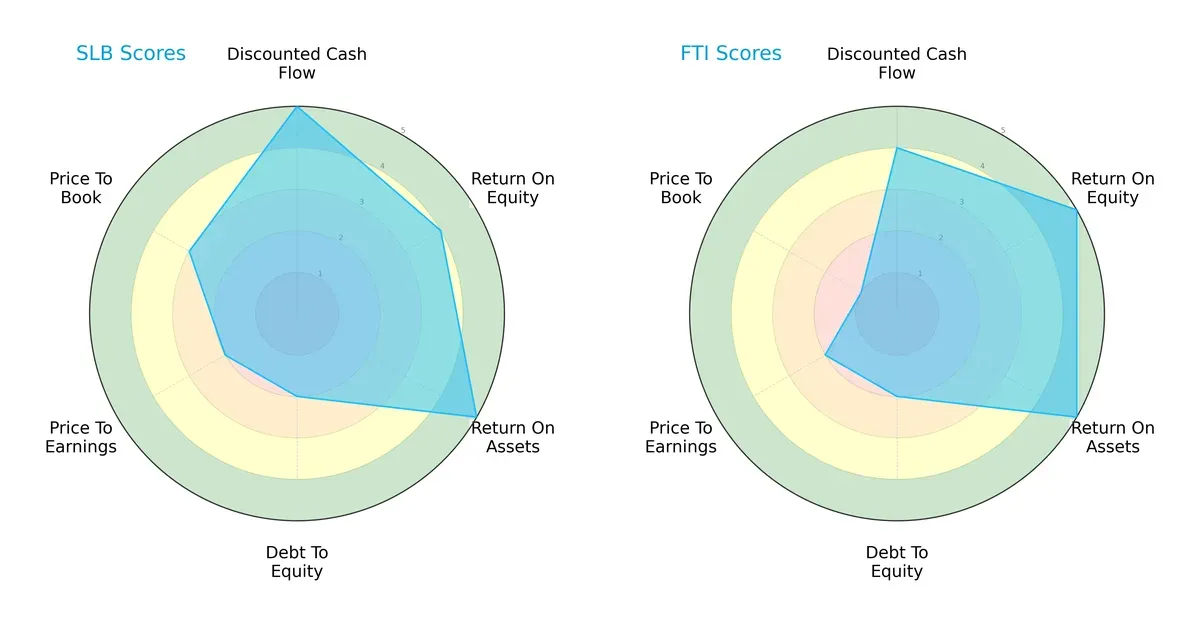
SLB shows a more balanced profile with very favorable DCF (5) and ROA (5) scores, but moderate debt and valuation metrics. TechnipFMC leverages a superior ROE (5) and ROA (5), yet suffers from a very unfavorable Price-to-Book score (1), signaling valuation risk. SLB’s well-rounded metrics suggest steadier capital allocation, while TechnipFMC relies heavily on operational efficiency.
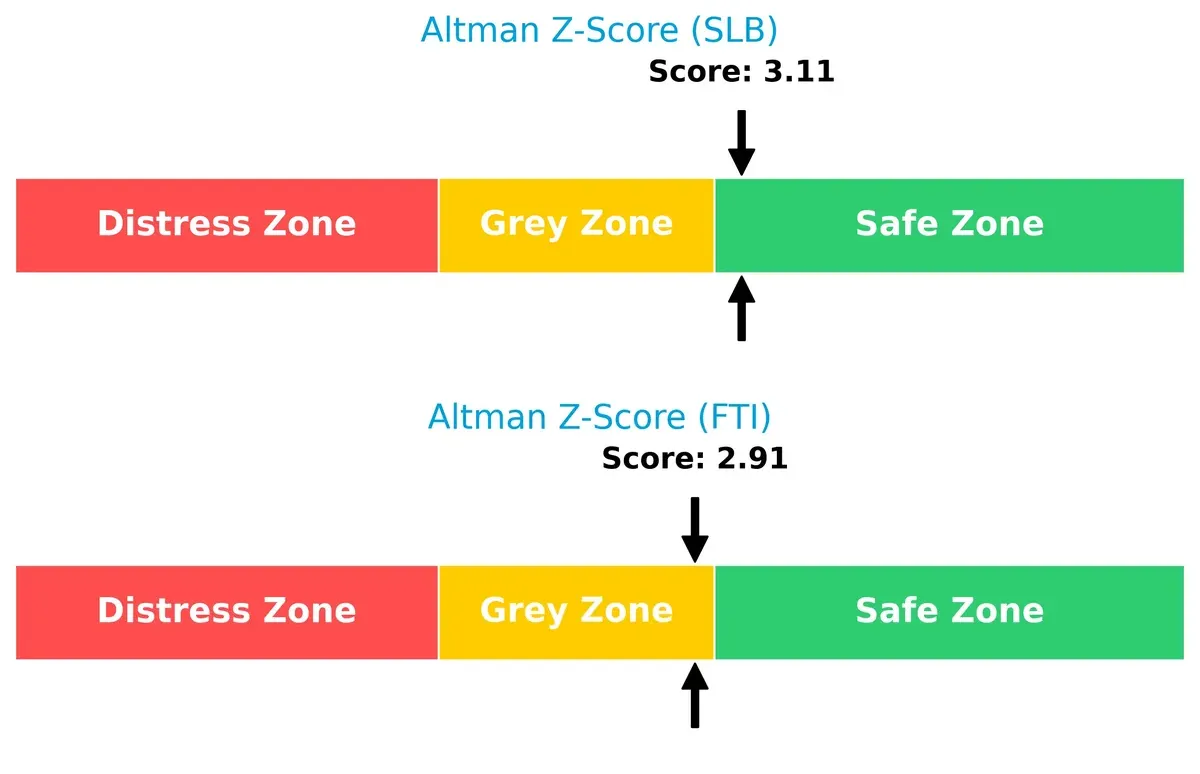
Bankruptcy Risk: Solvency Showdown
SLB’s Altman Z-Score of 3.11 places it securely in the safe zone, while TechnipFMC’s 2.91 sits in the grey zone. This implies SLB has a stronger buffer against bankruptcy risk in the current volatile cycle:
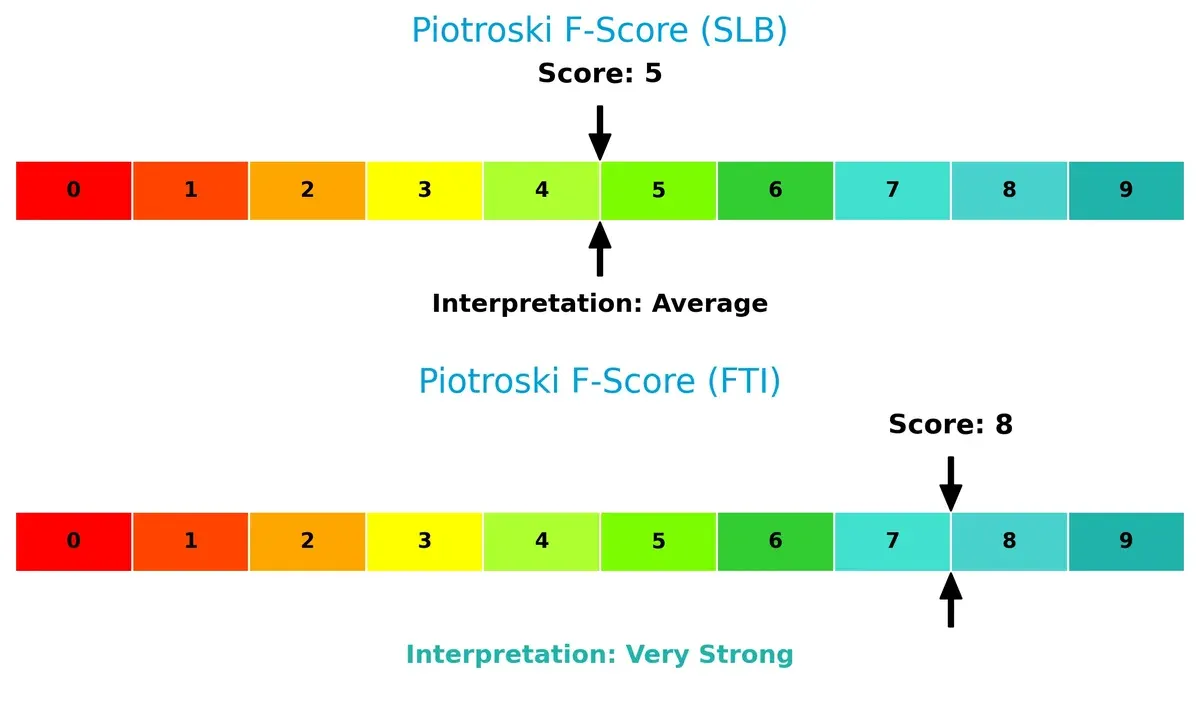
Financial Health: Quality of Operations
TechnipFMC’s Piotroski F-Score of 8 signals peak financial health, outperforming SLB’s average score of 5. This suggests TechnipFMC excels in profitability, liquidity, and operational efficiency, while SLB shows some red flags in internal metrics:
How are the two companies positioned?
This section dissects the operational DNA of SLB and FTI by comparing revenue distribution and internal dynamics. The goal is to confront their economic moats to reveal which model offers more resilient competitive advantage today.
Revenue Segmentation: The Strategic Mix
This visual comparison dissects how SLB N.V. and TechnipFMC plc diversify their income streams and highlights their primary sector bets:
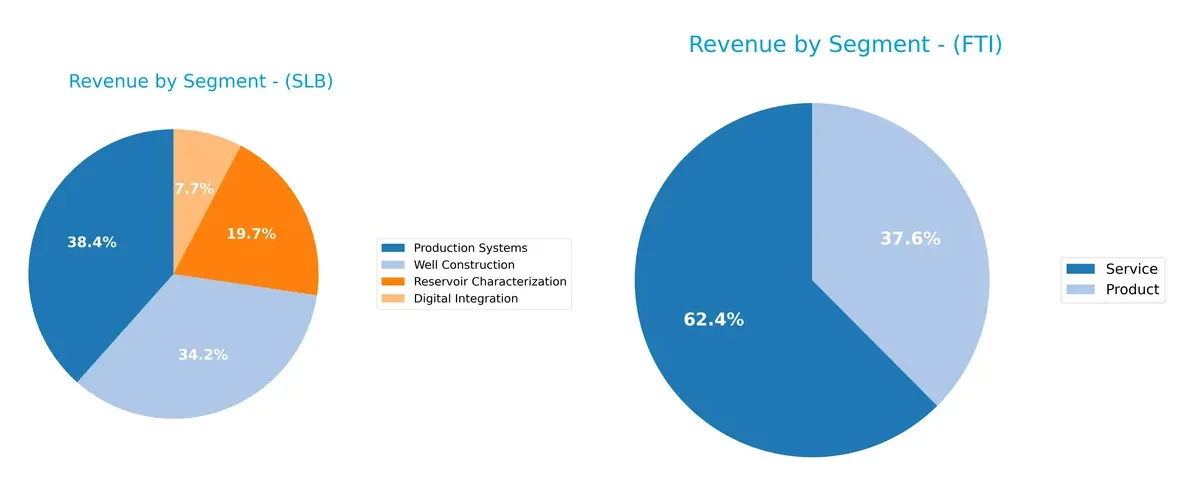
SLB’s revenue anchors heavily in Well Construction ($11.9B) and Production Systems ($13.3B), showing a strong focus on core upstream solutions. TechnipFMC splits between Services ($5.5B) and Products ($3.3B), reflecting a more balanced portfolio. SLB’s concentration suggests infrastructure dominance but higher segment risk. TechnipFMC’s diversification across product and service lines reduces exposure but limits scale advantages seen in SLB’s ecosystem.
Strengths and Weaknesses Comparison
This table compares the Strengths and Weaknesses of SLB N.V. and TechnipFMC plc based on diversification, profitability, financial statements, innovation, global presence, and market share:
SLB Strengths
- Broad product segmentation including Digital Integration and Well Construction
- Favorable ROIC vs. WACC indicates efficient capital allocation
- Strong geographic presence across Middle East and Europe CIS Africa
- Favorable debt ratios and interest coverage support financial stability
FTI Strengths
- Higher ROE and ROIC demonstrate superior profitability
- Favorable P/E suggests market values growth potential
- Favorable debt-to-assets ratio with strong interest coverage
- Diverse geographic revenue including U.S., Brazil, and Norway
SLB Weaknesses
- Neutral net margin and ROE indicate moderate profitability
- Neutral current and quick ratios reflect average liquidity
- Higher P/B ratio could signal less market undervaluation
- Asset turnover is neutral, suggesting moderate operational efficiency
FTI Weaknesses
- Unfavorable P/B ratio indicates potential overvaluation risk
- Lower dividend yield may reduce income appeal
- Neutral debt-to-equity ratio points to moderate financial leverage
- Neutral liquidity ratios could constrain flexibility
SLB shows a balanced financial profile with strengths in capital efficiency and geographic reach. FTI excels in profitability metrics but faces challenges in valuation and dividend yield, highlighting different strategic financial priorities.
The Moat Duel: Analyzing Competitive Defensibility
A structural moat is the only shield protecting long-term profits from relentless competition erosion. Here’s how SLB and TechnipFMC defend their turf:
SLB N.V.: Technological Integration Moat
SLB’s primary moat is its technology-driven integration across energy services. This manifests in a solid ROIC 3.7% above WACC and stable 14.7% EBIT margins. New digital and carbon management products could deepen its moat in 2026 but margin pressures remain a caution.
TechnipFMC plc: Operational Efficiency Moat
TechnipFMC relies on operational efficiency and subsea systems expertise, boasting a ROIC nearly 9.5% above WACC. Its faster ROIC growth and 11.4% EBIT margin confirm a dynamic moat. Expansion into carbon capture partnerships offers promising upside in 2026.
Technological Integration vs. Operational Efficiency
TechnipFMC’s moat is wider and growing faster, with superior ROIC gains signaling robust value creation. SLB’s broader service scope provides a durable edge but faces margin headwinds. Overall, TechnipFMC appears better positioned to defend and expand market share.
Which stock offers better returns?
The past year revealed contrasting dynamics: SLB N.V. experienced an accelerating bearish trend, while TechnipFMC plc surged with strong bullish momentum.
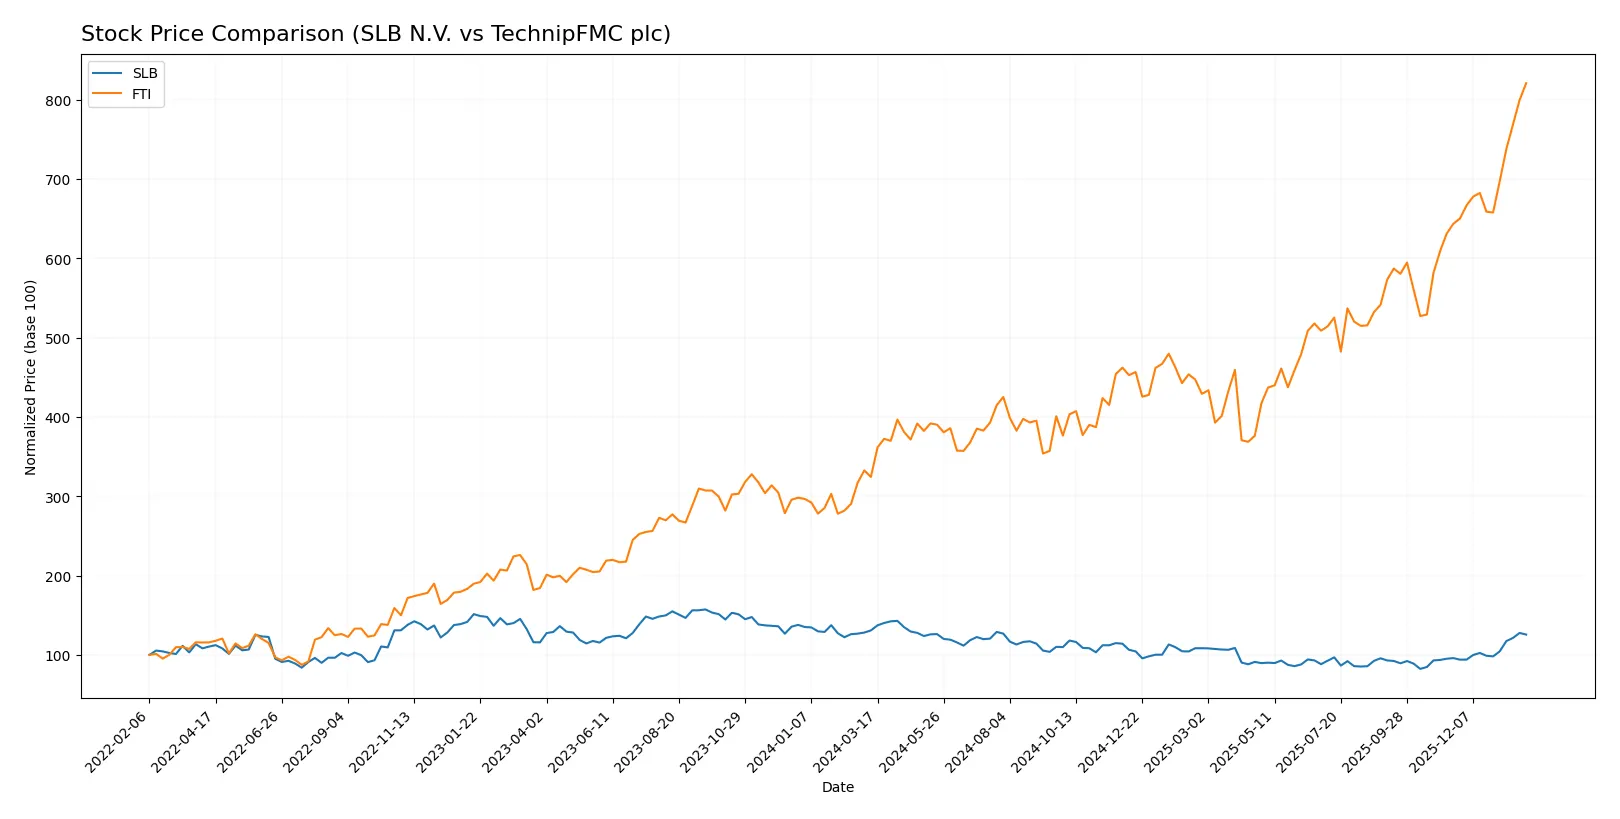
Trend Comparison
SLB N.V.’s stock declined 4.01% over the last 12 months, marking a bearish trend with accelerating downward momentum. It traded between 31.72 and 55.03, showing notable volatility (std dev 5.73).
TechnipFMC plc posted a 153.04% gain over the same period, reflecting a bullish trend with accelerating price appreciation. The stock fluctuated from 22.02 to 55.72, exhibiting higher volatility (std dev 7.43).
TechnipFMC’s stock clearly outperformed SLB with substantially stronger returns and a pronounced bullish trend over the past year.
Target Prices
Analysts present a cautiously optimistic consensus on SLB N.V. and TechnipFMC plc, reflecting moderate upside potential.
| Company | Target Low | Target High | Consensus |
|---|---|---|---|
| SLB N.V. | 45 | 61 | 52.95 |
| TechnipFMC plc | 47 | 56 | 49.83 |
SLB’s consensus target sits about 9% above its current price of 48.38 USD, suggesting moderate growth. TechnipFMC trades near 55.72 USD, slightly above its 49.83 USD target consensus, signaling limited upside.

Don’t Let Luck Decide Your Entry Point
Optimize your entry points with our advanced ProRealTime indicators. You’ll get efficient buy signals with precise price targets for maximum performance. Start outperforming now!
How do institutions grade them?
SLB N.V. Grades
The following table shows the latest grades from key financial institutions for SLB N.V.:
| Grading Company | Action | New Grade | Date |
|---|---|---|---|
| JP Morgan | maintain | Overweight | 2026-01-26 |
| Citigroup | maintain | Buy | 2026-01-26 |
| Barclays | maintain | Overweight | 2026-01-26 |
| RBC Capital | maintain | Outperform | 2026-01-26 |
| B of A Securities | maintain | Buy | 2026-01-26 |
| Susquehanna | maintain | Positive | 2026-01-26 |
| BMO Capital | maintain | Outperform | 2026-01-26 |
| Stifel | maintain | Buy | 2026-01-21 |
| Susquehanna | maintain | Positive | 2026-01-07 |
| Freedom Capital Markets | downgrade | Hold | 2026-01-06 |
TechnipFMC plc Grades
Below are the recent grades from reputable financial firms for TechnipFMC plc:
| Grading Company | Action | New Grade | Date |
|---|---|---|---|
| TD Cowen | maintain | Buy | 2026-01-07 |
| Susquehanna | maintain | Positive | 2026-01-07 |
| Piper Sandler | maintain | Overweight | 2025-12-18 |
| Jefferies | maintain | Buy | 2025-11-03 |
| Citigroup | maintain | Buy | 2025-10-29 |
| RBC Capital | maintain | Outperform | 2025-10-28 |
| Barclays | maintain | Overweight | 2025-10-27 |
| Piper Sandler | maintain | Overweight | 2025-10-24 |
| JP Morgan | maintain | Overweight | 2025-10-02 |
| Barclays | maintain | Overweight | 2025-07-25 |
Which company has the best grades?
SLB N.V. consistently receives strong buy-side ratings with multiple “Buy,” “Outperform,” and “Overweight” grades. TechnipFMC plc also commands positive ratings but has fewer buy confirmations and older dates. Investors may view SLB’s more recent and broadly bullish institutional grades as a sign of stronger confidence.
Risks specific to each company
The following categories identify the critical pressure points and systemic threats facing SLB N.V. and TechnipFMC plc in the 2026 market environment:
1. Market & Competition
SLB N.V.
- Dominates with broad global tech portfolio and 110K employees, but faces intense innovation demands.
TechnipFMC plc
- Smaller scale with 21K employees, strong in subsea and surface tech, but niche focus limits diversification.
2. Capital Structure & Debt
SLB N.V.
- Strong balance sheet with favorable debt-to-assets (22.4%) and debt/equity (0.47) ratios.
TechnipFMC plc
- Slightly higher leverage with debt/equity at 0.58; debt-to-assets lower at 18.2%, moderate risk.
3. Stock Volatility
SLB N.V.
- Beta of 0.72 indicates moderate volatility below market average, suggesting defensive qualities.
TechnipFMC plc
- Lower beta at 0.66 reflects less sensitivity to market swings, appealing for risk-averse investors.
4. Regulatory & Legal
SLB N.V.
- US-based, exposed to stringent environmental and energy regulations, plus carbon management compliance.
TechnipFMC plc
- UK-based, facing evolving EU and UK energy regulations; also active in carbon capture alliances.
5. Supply Chain & Operations
SLB N.V.
- Extensive global operations create complexity; operational scale offers resilience but risks supply chain disruption.
TechnipFMC plc
- More focused supply chain in subsea and surface tech; smaller scale may limit flexibility under stress.
6. ESG & Climate Transition
SLB N.V.
- Actively integrating carbon management solutions, aligning with energy transition trends.
TechnipFMC plc
- Strategic alliance with Talos Energy targets Carbon Capture and Storage, showing ESG commitment.
7. Geopolitical Exposure
SLB N.V.
- US base exposes it to trade tensions and sanctions affecting global energy markets.
TechnipFMC plc
- UK headquarters face Brexit-related trade uncertainties and global energy geopolitics.
Which company shows a better risk-adjusted profile?
SLB’s most impactful risk is operational complexity amid global supply chain pressures. TechnipFMC’s key risk lies in its higher leverage and concentrated market niche. Despite SLB’s scale risks, its stronger balance sheet and broader diversification provide a better risk-adjusted profile. The recent Altman Z-Score puts SLB safely above distress, while TechnipFMC remains in a grey zone, underscoring SLB’s relative financial stability.
Final Verdict: Which stock to choose?
SLB N.V. wields a robust economic moat, driven by disciplined capital allocation and a steadily growing ROIC well above its WACC. Its superpower lies in generating consistent value through operational efficiency. The key point of vigilance is its recent revenue softness, which could pressure near-term earnings. SLB fits an Aggressive Growth portfolio seeking durable industry leaders.
TechnipFMC plc’s strategic moat emerges from its high ROE and accelerating profitability, boosted by operational agility and a leaner asset base. It offers a safety profile marked by stronger free cash flow to equity and less leverage relative to SLB. This makes FTI appealing for GARP investors who want growth tempered by reasonable valuation.
If you prioritize long-term value creation and operational resilience, SLB outshines due to its proven ability to sustain excess returns. However, if you seek high growth momentum with better near-term financial stability, FTI offers superior earnings acceleration and a compelling growth trajectory. Both present slightly favorable fundamentals, but the choice hinges on your appetite for cyclical risk versus growth consistency.
Disclaimer: Investment carries a risk of loss of initial capital. The past performance is not a reliable indicator of future results. Be sure to understand risks before making an investment decision.
Go Further
I encourage you to read the complete analyses of SLB N.V. and TechnipFMC plc to enhance your investment decisions: