Home > Comparison > Technology > TXN vs SWKS
The strategic rivalry between Texas Instruments Incorporated and Skyworks Solutions, Inc. defines the current trajectory of the semiconductor industry. Texas Instruments operates as a capital-intensive giant, focusing on analog and embedded processing solutions. In contrast, Skyworks Solutions pursues a specialized model, emphasizing proprietary wireless semiconductor products. This analysis pits scale against specialization to identify which corporate path delivers the superior risk-adjusted return for a diversified portfolio.
Table of contents
Companies Overview
Texas Instruments and Skyworks Solutions each hold significant positions in the semiconductor sector, shaping global electronics markets.
Texas Instruments Incorporated: Analog and Embedded Processing Leader
Texas Instruments dominates as a semiconductor giant, generating revenue primarily through its Analog and Embedded Processing segments. It excels in power management and microcontrollers, serving diverse markets from industrial to automotive. In 2026, its strategic focus lies in optimizing product innovation and expanding its footprint in industrial and automotive electronics, reinforcing its competitive advantage in analog technology.
Skyworks Solutions, Inc.: Wireless Connectivity Specialist
Skyworks Solutions specializes in proprietary semiconductor products that support wireless connectivity across smartphones, automotive, and broadband sectors. Its revenue stems from a diverse product portfolio including amplifiers, filters, and front-end modules. The company’s 2026 strategy emphasizes innovation in wireless analog systems and strengthening supply chain resilience to sustain growth in rapidly evolving wireless communications.
Strategic Collision: Similarities & Divergences
Both companies prioritize semiconductor innovation but diverge in focus: Texas Instruments leads with analog and embedded solutions, while Skyworks targets wireless connectivity components. They compete primarily in industrial and automotive electronics but address different technical niches. This divergence creates distinct investment profiles—Texas Instruments offers stability through broad industrial applications, whereas Skyworks presents growth potential tied closely to wireless technology trends.
Income Statement Comparison
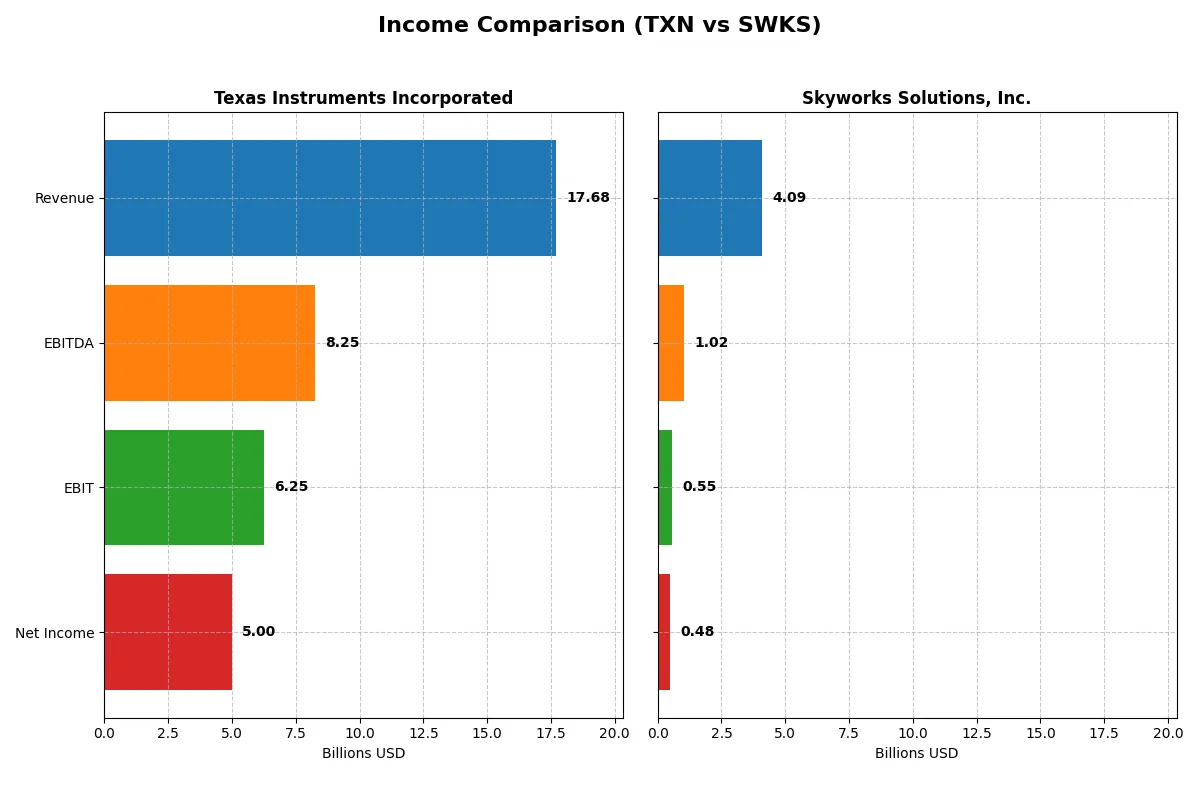
This data dissects the core profitability and scalability of both corporate engines to reveal who dominates the bottom line:
| Metric | Texas Instruments Incorporated (TXN) | Skyworks Solutions, Inc. (SWKS) |
|---|---|---|
| Revenue | 17.7B | 4.09B |
| Cost of Revenue | 7.6B | 2.4B |
| Operating Expenses | 4.06B | 1.18B |
| Gross Profit | 10.1B | 1.68B |
| EBITDA | 8.25B | 1.02B |
| EBIT | 6.25B | 554M |
| Interest Expense | 543M | 27M |
| Net Income | 5.0B | 477M |
| EPS | 5.45 | 3.09 |
| Fiscal Year | 2025 | 2025 |
Income Statement Analysis: The Bottom-Line Duel
This income statement comparison reveals the underlying efficiency and profitability dynamics of two major semiconductor players over recent years.
Texas Instruments Incorporated Analysis
Texas Instruments shows a generally declining revenue trend from 2021 to 2025 but maintains strong gross and net margins around 57% and 28%, respectively. The 2025 fiscal year saw revenue rise 13% year-over-year to $17.7B, with net income at $5B despite a slight net margin dip. TI’s operating efficiency remains robust, supported by favorable interest expense ratios and steady R&D investment.
Skyworks Solutions, Inc. Analysis
Skyworks exhibits a revenue contraction over the period, with 2025 revenue at $4.1B, down 2.2% year-over-year. Its gross margin at 41% and net margin at 12% lag behind TI’s, and the net income declined sharply to $477M in 2025. The company faces deteriorating profitability with significant drops in EBIT and EPS, signaling weakened operational momentum and margin pressure.
Verdict: Margin Strength vs. Revenue Resilience
Texas Instruments decisively outperforms Skyworks in both scale and profitability, boasting superior margins and healthier earnings growth despite modest revenue decline. Skyworks’ sharper revenue and income contractions, combined with lower margin profiles, suggest greater operational challenges. For investors prioritizing stable margin power and efficient capital use, Texas Instruments presents the more compelling fundamental profile.
Financial Ratios Comparison
These vital ratios act as a diagnostic tool to expose the underlying fiscal health, valuation premiums, and capital efficiency of each company:
| Ratios | Texas Instruments (TXN) | Skyworks Solutions (SWKS) |
|---|---|---|
| ROE | 30.7% | 8.3% |
| ROIC | 16.5% | 6.4% |
| P/E | 31.5 | 25.0 |
| P/B | 9.7 | 2.1 |
| Current Ratio | 4.35 | 2.33 |
| Quick Ratio | 2.83 | 1.76 |
| D/E | 0.86 | 0.21 |
| Debt-to-Assets | 40.6% | 15.2% |
| Interest Coverage | 11.1 | 18.5 |
| Asset Turnover | 0.51 | 0.52 |
| Fixed Asset Turnover | 1.44 | 2.95 |
| Payout Ratio | 100.0% | 90.7% |
| Dividend Yield | 3.17% | 3.63% |
| Fiscal Year | 2025 | 2025 |
Efficiency & Valuation Duel: The Vital Signs
Financial ratios act as a company’s DNA, unveiling hidden risks and highlighting operational strengths crucial for investment decisions.
Texas Instruments Incorporated
Texas Instruments delivers a robust 30.7% ROE and a strong 28.3% net margin, signaling high profitability. Its valuation appears stretched with a P/E of 31.5 and P/B near 9.7, above typical sector averages. The company rewards shareholders with a 3.17% dividend yield, reflecting solid capital allocation towards steady income.
Skyworks Solutions, Inc.
Skyworks shows more modest profitability, with an 8.3% ROE and an 11.7% net margin. Its valuation is reasonable: a P/E of 24.9 and P/B of 2.07 suggest fair pricing. Skyworks maintains a 3.63% dividend yield, supported by a conservative debt profile, indicating prudent shareholder returns and operational efficiency.
Premium Valuation vs. Operational Safety
Texas Instruments offers superior profitability but trades at a premium valuation, increasing risk. Skyworks balances modest returns with lower valuation and stronger balance sheet metrics. Investors seeking growth with lower risk may prefer Skyworks, while those betting on high profitability might lean toward Texas Instruments.
Which one offers the Superior Shareholder Reward?
Texas Instruments (TXN) and Skyworks Solutions (SWKS) both distribute value through dividends and buybacks, but their approaches differ sharply. TXN yields ~3.17% with a near 100% payout ratio, signaling mature, stable cash returns, yet free cash flow coverage is thin at 0.75x, raising sustainability concerns. Buybacks have been moderate but consistent, reinforcing shareholder value. SWKS pays a higher yield (~3.63%) with a lower payout ratio (~90%), supported by robust free cash flow coverage above 2.0x, indicating a more sustainable dividend. Its aggressive buyback program, combined with reinvestment in growth, delivers a balanced total return. I conclude SWKS offers a superior, more sustainable shareholder reward in 2026 due to stronger cash flow coverage and a disciplined capital allocation mix.
Comparative Score Analysis: The Strategic Profile
The radar chart reveals the fundamental DNA and trade-offs of Texas Instruments and Skyworks Solutions, highlighting their core financial strengths and valuation differences:
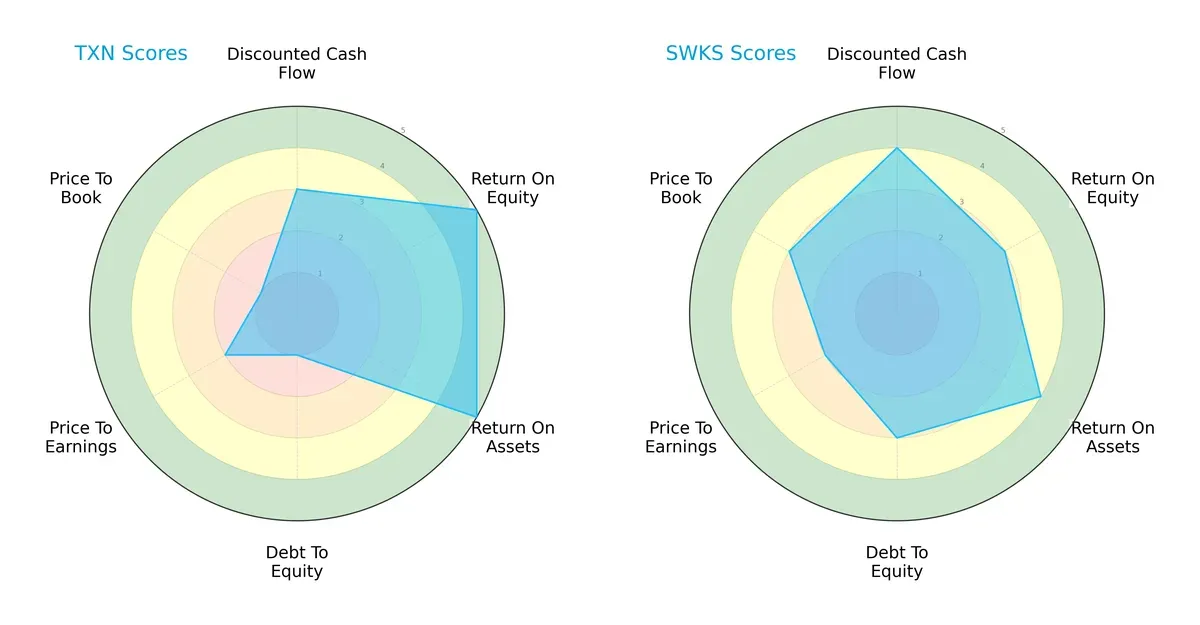
Texas Instruments excels in profitability metrics, scoring 5 in ROE and ROA, but its balance sheet is stretched with a very unfavorable debt-to-equity score of 1 and weak valuation scores. Skyworks Solutions shows a more balanced profile with favorable DCF (4) and asset returns (4), plus moderate leverage and valuation scores. Texas Instruments relies heavily on operational efficiency, while Skyworks offers steadier financial stability and valuation discipline.
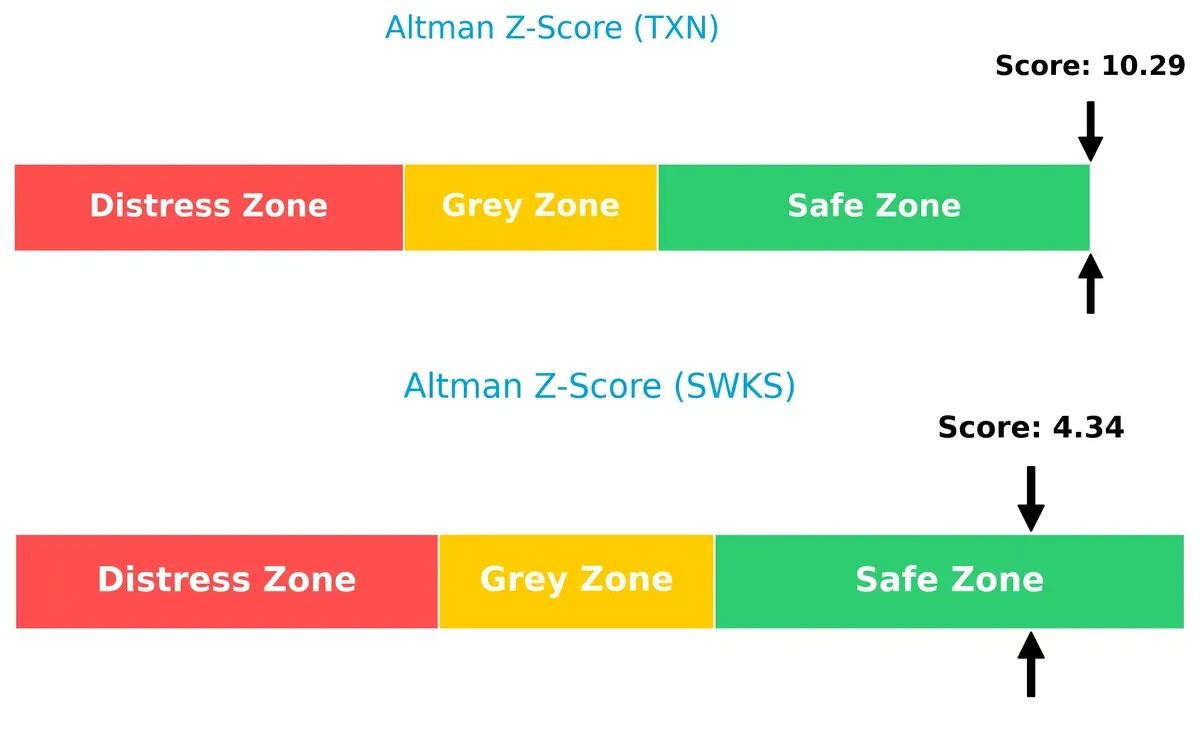
Bankruptcy Risk: Solvency Showdown
Texas Instruments’ Altman Z-Score of 10.3 far exceeds Skyworks’ 4.3, indicating a stronger margin of safety and lower bankruptcy risk in this economic cycle:
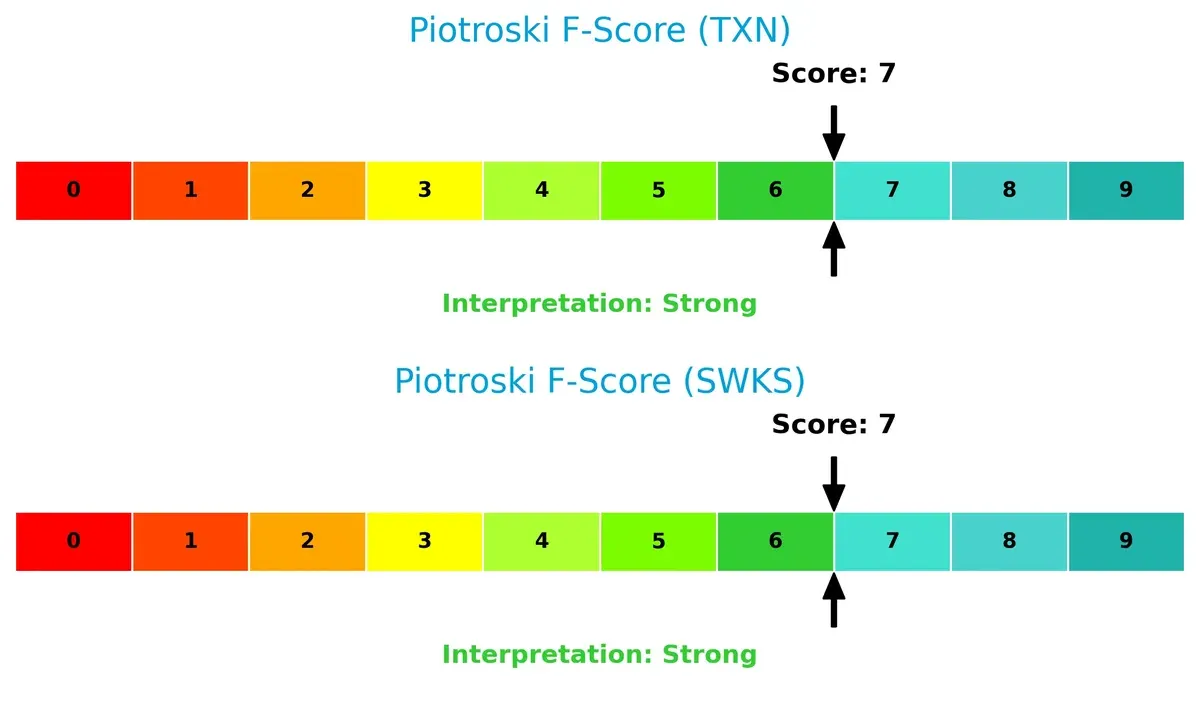
Financial Health: Quality of Operations
Both firms score a strong 7 on the Piotroski F-Score, signaling robust financial health and solid internal metrics without glaring red flags:
How are the two companies positioned?
This section dissects TXN and SWKS’s operational DNA by comparing revenue distribution and internal strengths and weaknesses. The goal is to confront their economic moats to reveal the most resilient competitive advantage today.
Revenue Segmentation: The Strategic Mix
This visual comparison dissects how Texas Instruments and Skyworks Solutions diversify their income streams and where their primary sector bets lie:
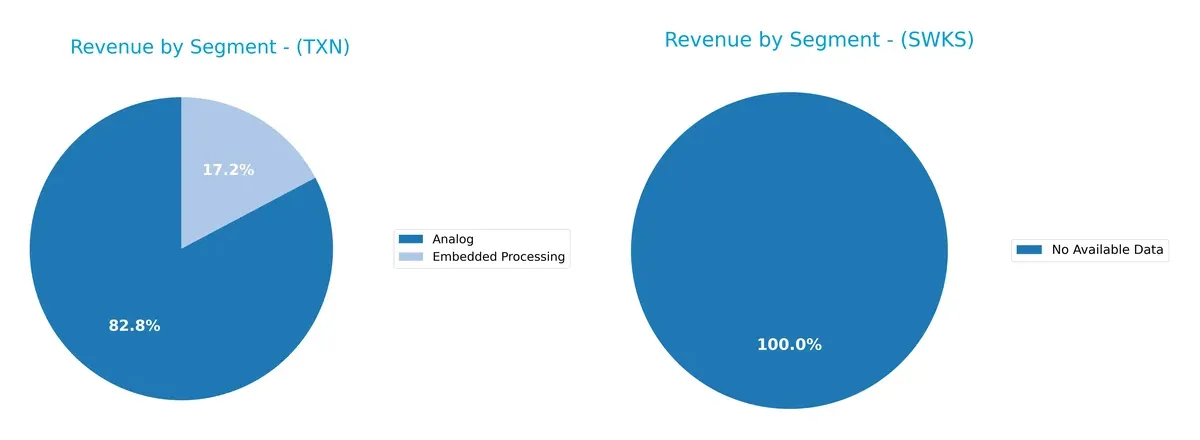
Texas Instruments anchors its revenue with a dominant Analog segment at $12.2B in 2024, dwarfing Embedded Processing at $2.5B. Skyworks Solutions lacks available data for segmentation. TI’s concentration in Analog signals a strong moat built on infrastructure dominance but also exposes it to concentration risk. The smaller Embedded Processing segment offers some diversification, cushioning cyclicality in Analog markets.
Strengths and Weaknesses Comparison
This table compares the Strengths and Weaknesses of Texas Instruments Incorporated and Skyworks Solutions, Inc.:
Texas Instruments Strengths
- High net margin at 28.28%
- Strong ROE of 30.73%
- Favorable quick ratio of 2.83
- Significant global presence, especially in the US and Asia
- Diverse product segments including Analog and Embedded Processing
Skyworks Solutions Strengths
- Favorable net margin at 11.67%
- Strong interest coverage ratio of 20.44
- Low debt-to-assets at 15.2%
- Favorable current and quick ratios
- Solid market presence in the US and Asia
Texas Instruments Weaknesses
- High P/E ratio at 31.53, considered unfavorable
- Elevated P/B ratio at 9.69
- Unfavorable current ratio at 4.35
- Moderate debt-to-equity ratio of 0.86
- Asset turnover ratio only neutral at 0.51
Skyworks Solutions Weaknesses
- Low ROE at 8.29%, marked unfavorable
- Moderate ROIC at 6.35%, neutral
- Neutral P/E and P/B ratios
- Limited product diversification data available
- Smaller revenue scale compared to Texas Instruments
Texas Instruments shows strong profitability and product diversification but carries valuation risks and liquidity concerns. Skyworks Solutions exhibits better leverage management and liquidity but faces challenges in profitability and scale. These contrasts highlight differing strategic focuses and financial profiles.
The Moat Duel: Analyzing Competitive Defensibility
A structural moat is the only true shield protecting long-term profits from relentless competitive erosion. Let’s dissect the moats of Texas Instruments and Skyworks Solutions:
Texas Instruments Incorporated: Durable Cost and Scale Advantage
Texas Instruments leverages a powerful cost advantage and broad scale in analog semiconductors. This manifests in a robust 35% EBIT margin and a ROIC comfortably above WACC, signaling value creation despite a recent decline. New industrial and automotive markets could deepen this moat in 2026.
Skyworks Solutions, Inc.: Specialized Niche with Eroding Returns
Skyworks relies on specialized RF solutions, a narrower moat compared to Texas Instruments’ broad analog portfolio. Its ROIC falls below WACC, indicating value destruction and margin pressure. Without significant innovation or market expansion, its competitive position weakens further in 2026.
Cost Leadership vs. Specialized RF: The Moat Face-off
Texas Instruments holds the wider, more sustainable moat, creating value with scale and cost leadership. Skyworks faces a shrinking moat, struggling with profitability and market pressures. Texas Instruments is better positioned to defend and grow its market share.
Which stock offers better returns?
The past year shows Texas Instruments’ stock rising sharply with accelerating gains, while Skyworks Solutions faces a sustained decline and weakening momentum.
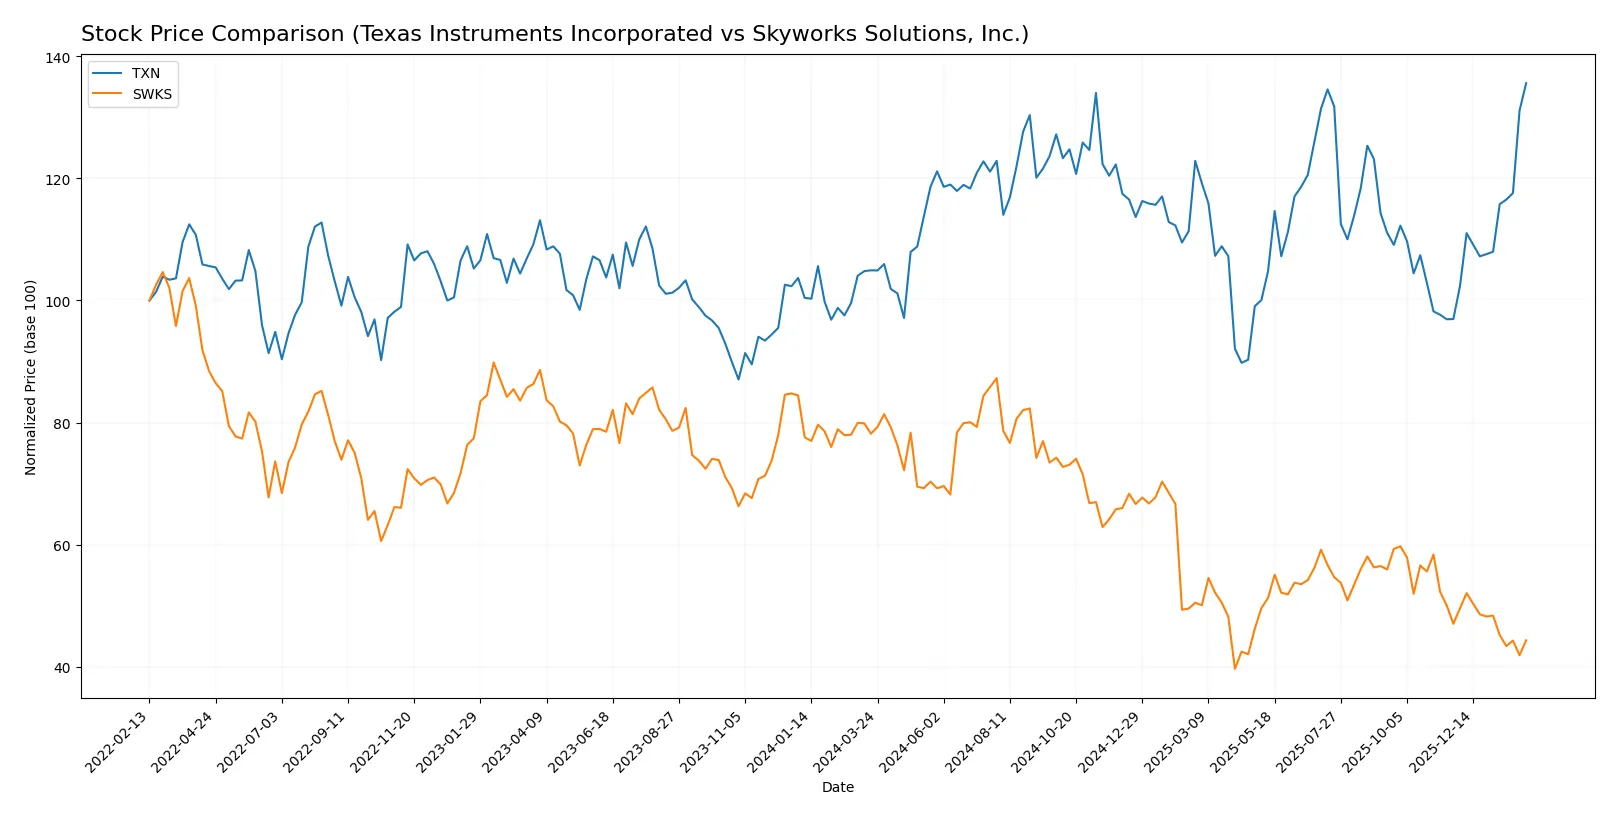
Trend Comparison
Texas Instruments’ stock rose 29.21% over the past 12 months, marking a bullish trend with accelerating momentum and a high near 223. Volatility remains moderate at 16.23.
Skyworks Solutions’ stock fell 43.31% over the same period, indicating a bearish trend with decelerating losses and a low near 53. Its volatility is slightly higher at 16.49.
Texas Instruments outperformed Skyworks Solutions by delivering significant positive returns, while Skyworks experienced a steep decline and weaker buyer interest.
Target Prices
Analysts present mixed expectations for Texas Instruments and Skyworks Solutions based on current consensus targets.
| Company | Target Low | Target High | Consensus |
|---|---|---|---|
| Texas Instruments Incorporated | 160 | 260 | 204.64 |
| Skyworks Solutions, Inc. | 58 | 140 | 77.36 |
Texas Instruments’ consensus target at 204.64 is below its current 222.92 price, suggesting limited upside. Skyworks’ consensus target of 77.36 implies substantial growth from the 59 current price.

Don’t Let Luck Decide Your Entry Point
Optimize your entry points with our advanced ProRealTime indicators. You’ll get efficient buy signals with precise price targets for maximum performance. Start outperforming now!
How do institutions grade them?
The following tables summarize recent institutional grades for Texas Instruments Incorporated and Skyworks Solutions, Inc.:
Texas Instruments Incorporated Grades
This table shows the latest grades from respected financial institutions for Texas Instruments Incorporated.
| Grading Company | Action | New Grade | Date |
|---|---|---|---|
| Jefferies | Maintain | Hold | 2026-01-28 |
| Cantor Fitzgerald | Maintain | Neutral | 2026-01-28 |
| Goldman Sachs | Maintain | Sell | 2026-01-28 |
| Truist Securities | Maintain | Hold | 2026-01-28 |
| Deutsche Bank | Maintain | Hold | 2026-01-28 |
| Stifel | Maintain | Hold | 2026-01-28 |
| UBS | Maintain | Buy | 2026-01-28 |
| B of A Securities | Upgrade | Neutral | 2026-01-28 |
| Wells Fargo | Maintain | Equal Weight | 2026-01-28 |
| JP Morgan | Maintain | Overweight | 2026-01-28 |
Skyworks Solutions, Inc. Grades
This table presents recent grading actions by major firms for Skyworks Solutions, Inc.
| Grading Company | Action | New Grade | Date |
|---|---|---|---|
| Citigroup | Maintain | Neutral | 2026-02-04 |
| Stifel | Maintain | Hold | 2026-02-04 |
| Benchmark | Maintain | Hold | 2026-02-04 |
| Keybanc | Maintain | Overweight | 2026-02-04 |
| JP Morgan | Maintain | Neutral | 2026-02-04 |
| Morgan Stanley | Maintain | Equal Weight | 2026-02-02 |
| B. Riley Securities | Maintain | Neutral | 2026-01-26 |
| Mizuho | Maintain | Neutral | 2026-01-26 |
| Susquehanna | Maintain | Neutral | 2026-01-22 |
| UBS | Maintain | Neutral | 2026-01-20 |
Which company has the best grades?
Texas Instruments holds a broader range of ratings, including buy and overweight grades, while Skyworks mostly receives neutral or hold ratings. This divergence may affect investor sentiment and portfolio positioning.
Risks specific to each company
The following categories identify the critical pressure points and systemic threats facing Texas Instruments Incorporated and Skyworks Solutions, Inc. in the 2026 market environment:
1. Market & Competition
Texas Instruments Incorporated
- Dominates in analog and embedded processing with diversified end markets; faces intense semiconductor sector rivalry.
Skyworks Solutions, Inc.
- Specializes in proprietary semiconductor products; competes in niche markets like connected home and automotive.
2. Capital Structure & Debt
Texas Instruments Incorporated
- Debt-to-equity ratio of 0.86; moderate leverage with neutral rating but weak debt-to-equity score signals some financial risk.
Skyworks Solutions, Inc.
- Low debt-to-equity ratio of 0.21; strong balance sheet with favorable debt metrics reducing financial risk.
3. Stock Volatility
Texas Instruments Incorporated
- Beta near 1 (0.995), indicating market-level volatility; relatively stable stock price range.
Skyworks Solutions, Inc.
- Higher beta at 1.317, suggesting greater price swings and increased market sensitivity.
4. Regulatory & Legal
Texas Instruments Incorporated
- Operates globally with exposure to semiconductor regulations; no major legal flags reported.
Skyworks Solutions, Inc.
- Also global, including China and Asia-Pacific; regulatory risks heightened by geopolitical tensions.
5. Supply Chain & Operations
Texas Instruments Incorporated
- Large scale manufacturing with robust supply chain; semiconductor cyclical risks apply.
Skyworks Solutions, Inc.
- Complex global supply chain with exposure to disruptions in Asia-Pacific, especially given geopolitical risks.
6. ESG & Climate Transition
Texas Instruments Incorporated
- Increasing focus on power efficiency in products supports climate transition; ESG disclosure improving.
Skyworks Solutions, Inc.
- Faces ESG challenges tied to global manufacturing footprint; advancing sustainability efforts amid investor pressure.
7. Geopolitical Exposure
Texas Instruments Incorporated
- US-based with global sales; sensitive to trade tensions but diversified end markets mitigate risk.
Skyworks Solutions, Inc.
- Significant exposure to China and Asia-Pacific markets, heightening geopolitical risk amid US-China tensions.
Which company shows a better risk-adjusted profile?
Texas Instruments faces the single most impactful risk in its moderate leverage and elevated debt-to-equity ratio. Skyworks’ greatest risk arises from its higher stock volatility and geopolitical exposure in Asia-Pacific. Despite TXN’s leverage concerns, its stable market position and safe Altman Z-Score contrast with SWKS’s higher beta and regional risks. I see TXN offering a better risk-adjusted profile, bolstered by a strong Piotroski score and broader market diversification evident in its 2026 financial data.
Final Verdict: Which stock to choose?
Texas Instruments dominates with a robust capital allocation and a durable economic moat. Its superpower lies in efficient value creation, underpinning strong returns on invested capital despite a recent decline. The point of vigilance remains its stretched valuation and weakening profitability trends. It fits well in an Aggressive Growth portfolio seeking quality with some risk tolerance.
Skyworks Solutions offers a strategic moat through its recurring revenue model and low leverage. It provides a safer financial profile with solid free cash flow yields and less balance sheet risk than Texas Instruments. However, its declining profitability and weaker growth trajectory temper enthusiasm. It suits a GARP (Growth at a Reasonable Price) portfolio prioritizing stability over outsized returns.
If you prioritize high-quality capital efficiency and can accept valuation risks, Texas Instruments is the compelling choice due to its superior value creation and market leadership. However, if you seek better financial stability with moderate growth, Skyworks offers a more conservative profile, albeit with less upside potential. Both present analytical scenarios worth considering based on your risk appetite and investment horizon.
Disclaimer: Investment carries a risk of loss of initial capital. The past performance is not a reliable indicator of future results. Be sure to understand risks before making an investment decision.
Go Further
I encourage you to read the complete analyses of Texas Instruments Incorporated and Skyworks Solutions, Inc. to enhance your investment decisions: