Home > Comparison > Technology > TER vs SWKS
The strategic rivalry between Teradyne, Inc. and Skyworks Solutions, Inc. shapes the semiconductor industry’s evolution. Teradyne operates as a capital-intensive test equipment and automation provider, while Skyworks focuses on designing and marketing high-margin proprietary semiconductor products. This head-to-head pits advanced manufacturing solutions against integrated chip innovation. This analysis aims to identify which company offers superior risk-adjusted returns for a diversified portfolio amid ongoing technological advancements and market shifts.
Table of contents
Companies Overview
Teradyne and Skyworks Solutions both occupy critical positions in the semiconductor industry, shaping technology infrastructure worldwide.
Teradyne, Inc.: Leader in Automated Test Equipment
Teradyne dominates the automated test equipment market with a diversified portfolio spanning semiconductor, system, industrial automation, and wireless test segments. Its core revenue stems from testing solutions for automotive, consumer electronics, and cloud computing devices. In 2026, Teradyne focuses on expanding its industrial automation robotics and advanced wireless test platforms, underscoring a push into manufacturing efficiency and 5G technology validation.
Skyworks Solutions, Inc.: Semiconductor Component Innovator
Skyworks specializes in designing and manufacturing proprietary semiconductor components used across aerospace, automotive, broadband, and smartphone markets. Its revenue engine relies on a broad range of analog and mixed-signal chips, including amplifiers and front-end modules. The company’s 2026 strategy centers on enhancing product innovation and expanding its footprint in connected home and wearable device markets, reflecting a shift toward integrated wireless solutions.
Strategic Collision: Similarities & Divergences
Teradyne and Skyworks both serve the semiconductor ecosystem but follow divergent paths: Teradyne leverages a test and automation platform model, while Skyworks builds proprietary semiconductor components. Their primary battleground is wireless technology, where Teradyne tests and validates devices, and Skyworks supplies critical chipsets. These distinctions create contrasting investment profiles—Teradyne’s growth hinges on capital equipment sales, whereas Skyworks depends on volume semiconductor chip demand.
Income Statement Comparison
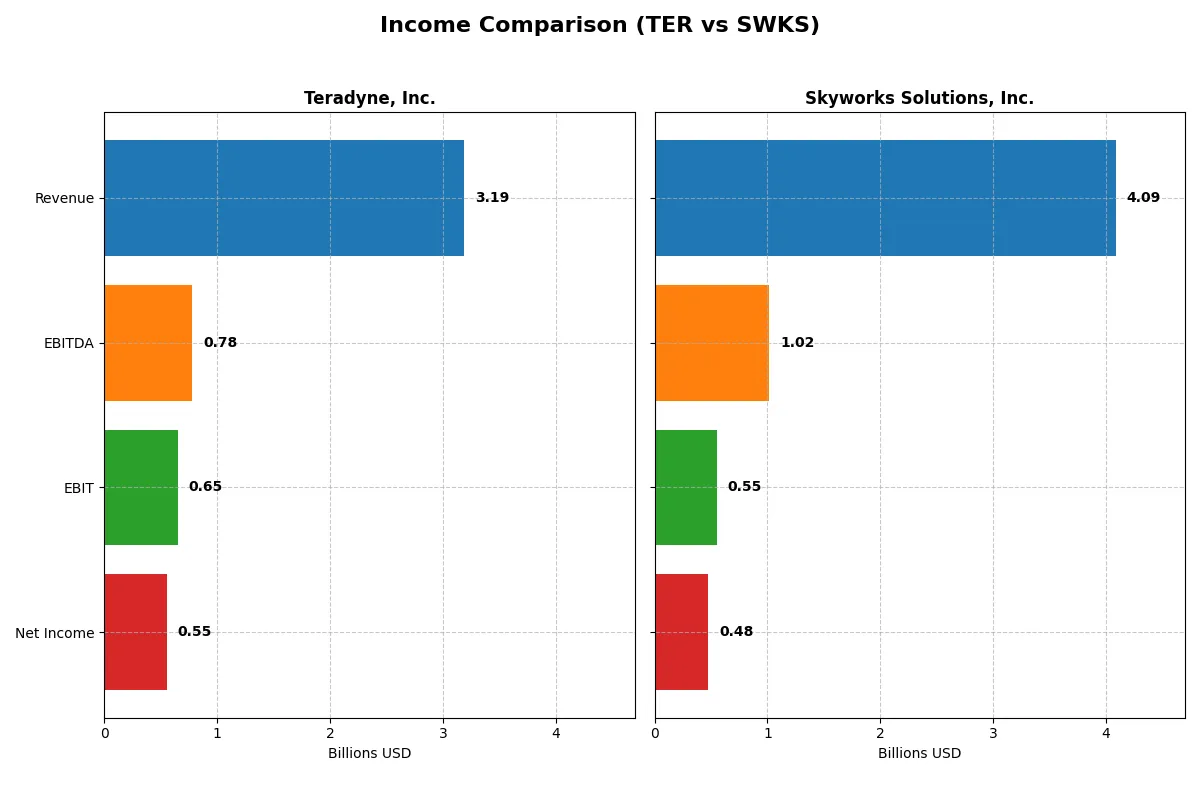
This data dissects the core profitability and scalability of both corporate engines to reveal who dominates the bottom line:
| Metric | Teradyne, Inc. (TER) | Skyworks Solutions, Inc. (SWKS) |
|---|---|---|
| Revenue | 3.19B | 4.09B |
| Cost of Revenue | 1.32B | 2.40B |
| Operating Expenses | 1.17B | 1.18B |
| Gross Profit | 1.87B | 1.68B |
| EBITDA | 780M | 1.02B |
| EBIT | 653M | 554M |
| Interest Expense | 8.02M | 27.1M |
| Net Income | 554M | 477M |
| EPS | 3.49 | 3.09 |
| Fiscal Year | 2025 | 2025 |
Income Statement Analysis: The Bottom-Line Duel
This income statement comparison reveals each company’s operational efficiency and profitability momentum across recent years.
Teradyne, Inc. Analysis
Teradyne’s revenue climbed from $2.68B in 2023 to $3.19B in 2025, showing steady growth. Net income followed suit, rising from $449M to $554M, although net margin dipped slightly. Gross margin remains robust near 58.5%, signaling strong cost control. In 2025, Teradyne sustained favorable EBIT and net margin levels, demonstrating solid operational efficiency despite modest margin pressure.
Skyworks Solutions, Inc. Analysis
Skyworks’ revenue declined from $4.77B in 2023 to $4.09B in 2025, reflecting top-line contraction. Net income dropped sharply from $983M to $477M, with net margin sliding to 11.7%. Gross margin at 41.2% and EBIT margin at 13.6% indicate thinner profitability compared to Teradyne. The latest year’s results highlight weakening momentum, with declines in revenue, earnings, and margins signaling operational challenges.
Margin Strength vs. Revenue Contraction
Teradyne outperforms Skyworks with superior margin profiles and consistent revenue growth. Teradyne’s 58.5% gross margin and 17.4% net margin beat Skyworks’ 41.2% and 11.7%, respectively. While both firms face net income declines over five years, Teradyne’s more resilient margins and positive recent growth present a stronger fundamental case. Investors seeking efficiency and stability may find Teradyne’s profile more compelling.
Financial Ratios Comparison
These vital ratios act as a diagnostic tool to expose underlying fiscal health, valuation premiums, and capital efficiency across companies:
| Ratios | Teradyne, Inc. (TER) | Skyworks Solutions, Inc. (SWKS) |
|---|---|---|
| ROE | 19.8% | 8.3% |
| ROIC | 18.4% | 6.4% |
| P/E | 54.6 | 24.9 |
| P/B | 10.8 | 2.1 |
| Current Ratio | 1.76 | 2.33 |
| Quick Ratio | 1.41 | 1.76 |
| D/E | 0.12 | 0.21 |
| Debt-to-Assets | 8.3% | 15.2% |
| Interest Coverage | 86.4 | 18.5 |
| Asset Turnover | 0.76 | 0.52 |
| Fixed Asset Turnover | 4.99 | 2.95 |
| Payout ratio | 13.8% | 90.7% |
| Dividend yield | 0.25% | 3.63% |
| Fiscal Year | 2025 | 2025 |
Efficiency & Valuation Duel: The Vital Signs
Ratios act as a company’s DNA, revealing hidden risks, operational excellence, and potential for shareholder returns with clear, quantifiable metrics.
Teradyne, Inc.
Teradyne boasts a strong 19.8% ROE and 17.4% net margin, signaling robust profitability. Its valuation appears stretched with a high P/E of 54.6 and P/B of 10.8. The company maintains a low dividend yield of 0.25%, favoring reinvestment in R&D to drive future growth and operational efficiency.
Skyworks Solutions, Inc.
Skyworks posts a modest 8.3% ROE and an 11.7% net margin, reflecting moderate profitability. Its valuation is more reasonable, with a P/E near 25 and P/B of 2.1. It rewards shareholders with a healthy 3.63% dividend yield, balancing income with steady cash flow supported by solid current and quick ratios.
Premium Valuation vs. Operational Safety
Teradyne’s superior profitability contrasts with a stretched valuation, exposing risk despite R&D focus. Skyworks offers a safer valuation and attractive dividend yield but lags in returns. Growth-oriented investors may prefer Teradyne’s profile, while income-focused investors might favor Skyworks’ balance of risk and reward.
Which one offers the Superior Shareholder Reward?
Teradyne, Inc. (TER) and Skyworks Solutions, Inc. (SWKS) both return capital through dividends and buybacks but with distinct approaches. TER yields around 0.38% with a conservative 14% payout ratio, preserving strong free cash flow coverage (~2.2x). Its buyback activity remains modest but consistent, prioritizing sustainability. SWKS offers a compelling 3.63% dividend yield but with a high 91% payout ratio, signaling less dividend safety. However, its robust share repurchases amplify total returns. I observe TER’s balanced distribution model as more durable for long-term value, while SWKS targets immediate income. For 2026, I favor TER for superior total return sustainability despite a lower yield.
Comparative Score Analysis: The Strategic Profile
The radar chart reveals the fundamental DNA and trade-offs of Teradyne, Inc. and Skyworks Solutions, Inc., highlighting their core financial strengths and weaknesses:
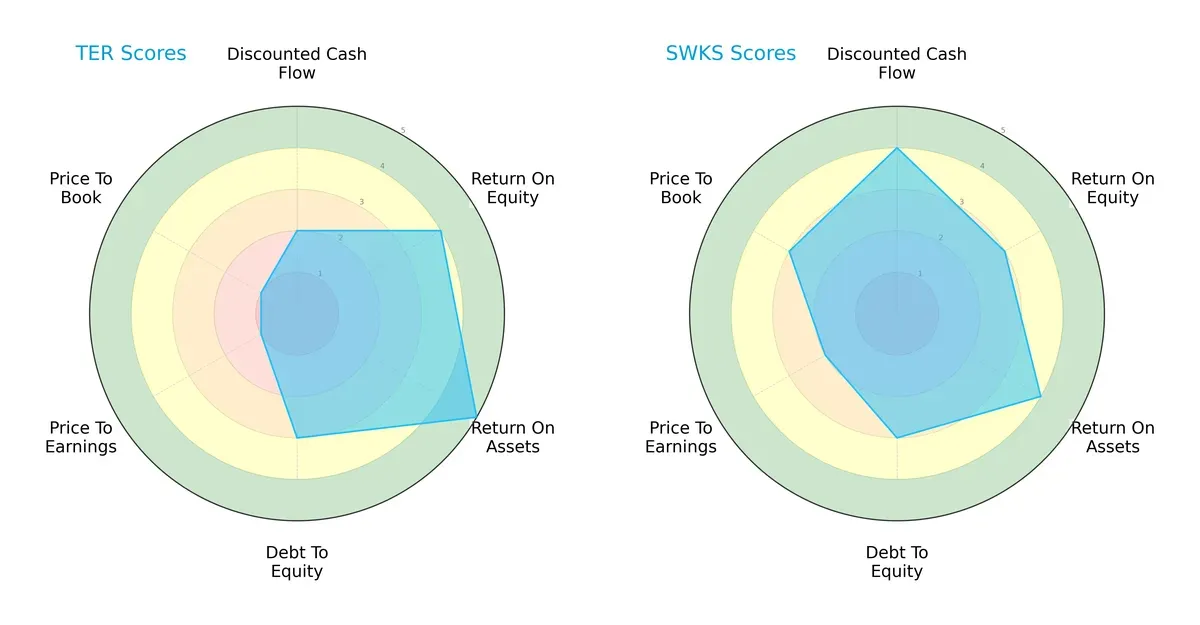
Teradyne excels in asset efficiency (ROA 5 vs. 4) and profitability (ROE 4 vs. 3) but suffers from poor valuation metrics (P/E and P/B at 1). Skyworks shows a more balanced profile with stronger discounted cash flow (DCF 4 vs. 2) and better valuation scores (P/E 2, P/B 3). Teradyne relies heavily on operational efficiency, while Skyworks offers a more diversified financial foundation.
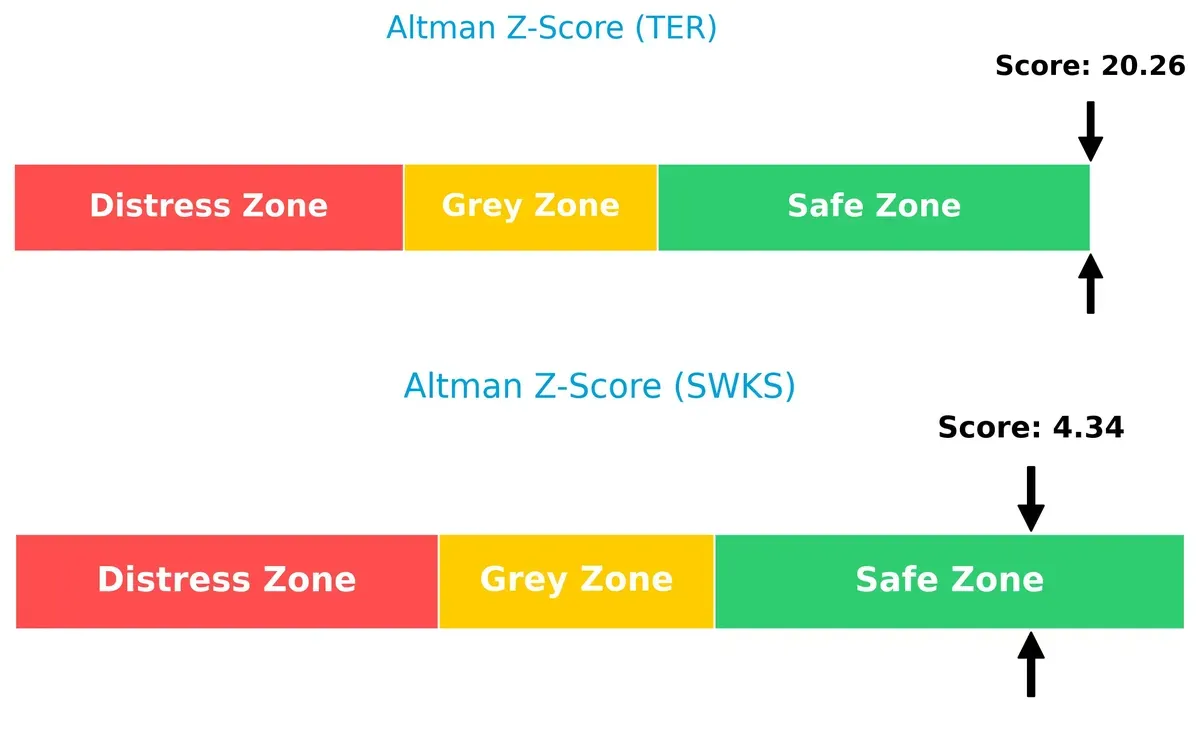
Bankruptcy Risk: Solvency Showdown
Teradyne’s Altman Z-Score of 20.3 far exceeds Skyworks’ 4.3, signaling a significantly stronger buffer against bankruptcy in this cycle:
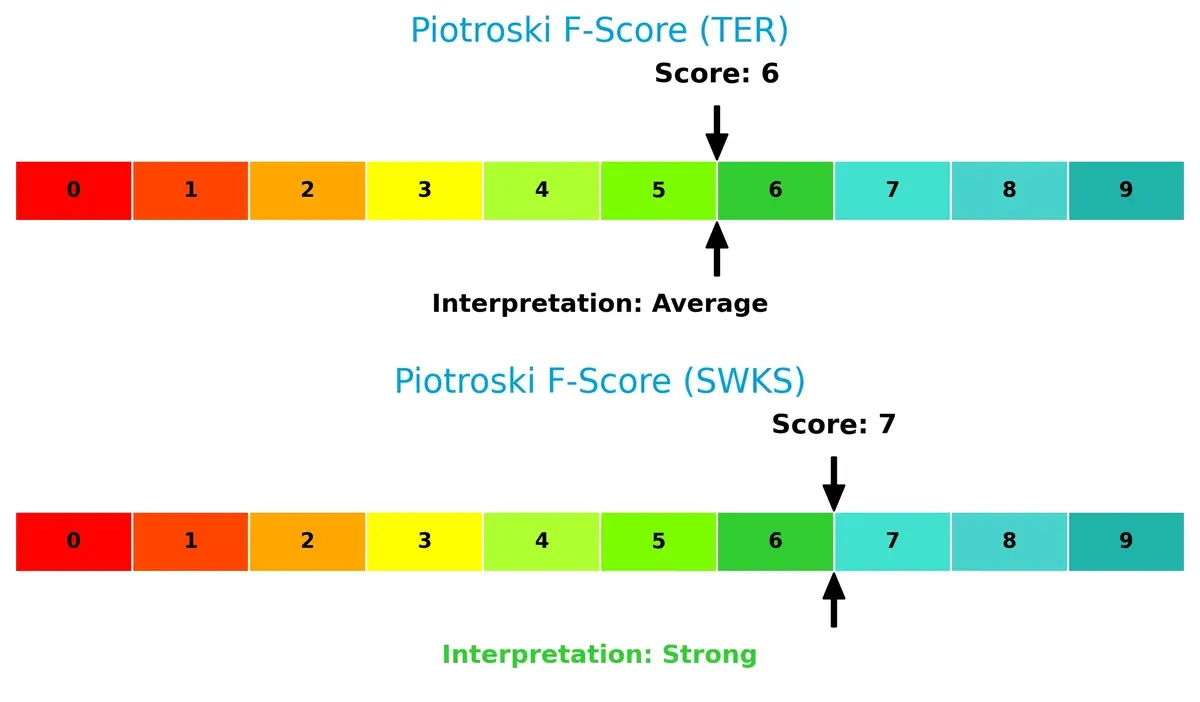
Financial Health: Quality of Operations
Skyworks scores a 7 on the Piotroski scale, indicating strong internal financial health, while Teradyne’s 6 suggests average robustness with some minor red flags:
How are the two companies positioned?
This section dissects the operational DNA of Teradyne and Skyworks by comparing revenue distribution and internal dynamics. The goal is to confront their economic moats and reveal the most resilient, sustainable competitive advantage today.
Revenue Segmentation: The Strategic Mix
This visual comparison dissects how Teradyne, Inc. and Skyworks Solutions, Inc. diversify their income streams and where their primary sector bets lie:
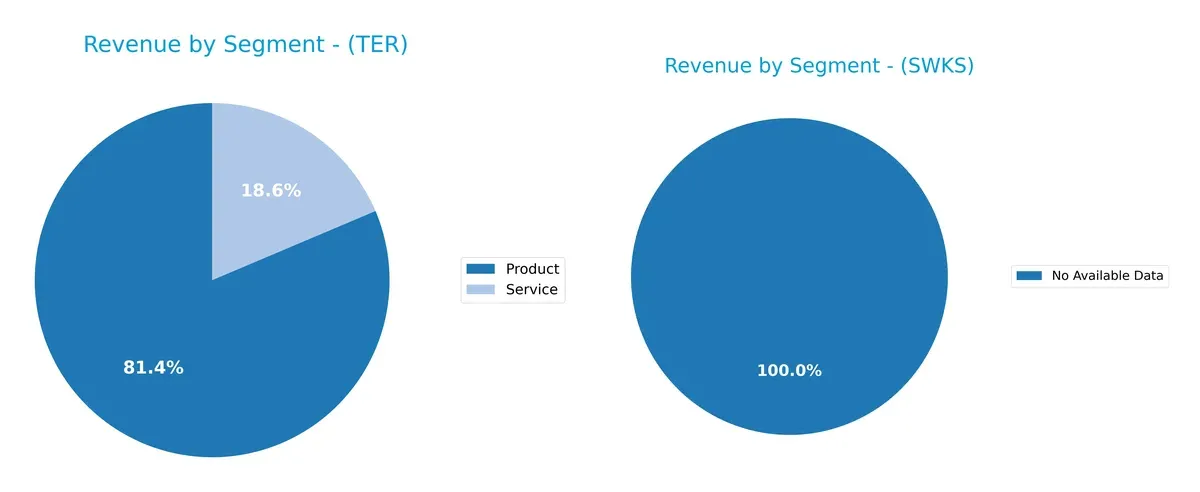
Teradyne leans heavily on its Product segment, generating $2.3B in 2024, which dwarfs its Service revenue of $525M. This concentration signals a strong focus on product innovation and infrastructure dominance. Skyworks Solutions lacks available segmentation data, making Teradyne’s diversified mix within its segments critical for assessing concentration risk and ecosystem lock-in. Teradyne’s reliance on one dominant segment may pose risks but also reflects strategic clarity.
Strengths and Weaknesses Comparison
This table compares the Strengths and Weaknesses of Teradyne and Skyworks Solutions:
Teradyne Strengths
- Strong profitability with 17.37% net margin
- High ROE at 19.82%
- Favorable liquidity ratios (current 1.76, quick 1.41)
- Low debt ratios (DE 0.12, debt/assets 8.32%)
- High interest coverage (81.43)
- Significant global sales diversification
Skyworks Strengths
- Solid net margin at 11.67%
- Favorable liquidity (current 2.33, quick 1.76)
- Moderate debt levels with favorable coverage
- Higher dividend yield at 3.63%
- Large US market presence with $3.16B revenue
- Diverse geographic reach across Asia and EMEA
Teradyne Weaknesses
- High valuation multiples (PE 54.64, PB 10.83)
- Weighted average cost of capital (WACC) at 12.35% exceeds ROIC
- Dividend yield very low at 0.25%
- Moderate asset turnover (0.76)
- Exposure to cyclical product revenue swings
Skyworks Weaknesses
- Lower ROE at 8.29%
- ROIC only slightly above WACC (6.35% vs. 9.28%)
- Neutral asset turnover (0.52)
- Less profitability relative to Teradyne
- Heavy reliance on US market, less balanced product mix
Teradyne exhibits strong profitability and conservative leverage, but faces valuation and capital cost concerns. Skyworks offers better liquidity and dividend yield, yet profitability and return metrics lag. Both companies show global presence but differ in geographic revenue concentration and operational efficiency. These factors shape their strategic positioning within their sectors.
The Moat Duel: Analyzing Competitive Defensibility
A structural moat alone shields long-term profits from competitive erosion. Let’s dissect how Teradyne and Skyworks defend their turf:
Teradyne, Inc.: Diversified Technological Moat
Teradyne’s moat stems from advanced test equipment and industrial automation, reflected in a strong 6.1% ROIC premium over WACC. Despite a declining ROIC trend, its broad segment exposure and innovation pipeline support moat resilience in 2026.
Skyworks Solutions, Inc.: Narrow Semiconductor Specialization
Skyworks relies on proprietary semiconductor IP but suffers a negative ROIC spread of -2.9%, signaling value destruction. Its focused product line contrasts Teradyne’s diversity. Skyworks faces steep headwinds but could rebound via expansion in 5G and IoT markets.
Verdict: Broad Innovation vs. Specialized Struggles
Teradyne holds a wider, more sustainable moat with consistent value creation despite profitability pressure. Skyworks’ shrinking ROIC and narrower niche leave it less equipped to defend market share in 2026.
Which stock offers better returns?
Over the past year, Teradyne, Inc. surged sharply, while Skyworks Solutions, Inc. faced a notable decline with contrasting trading dynamics and volume patterns.
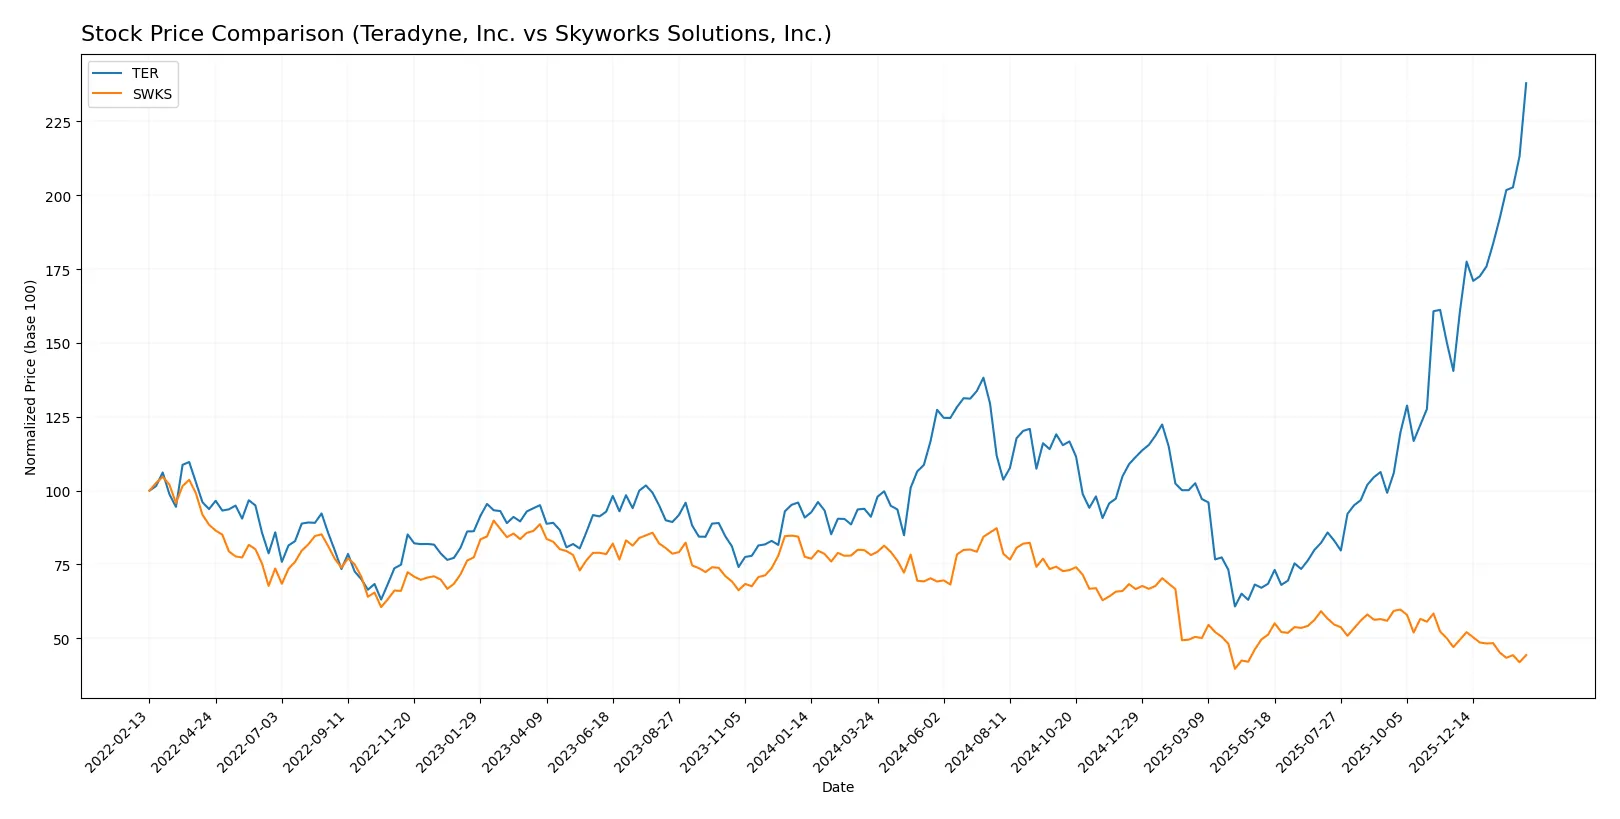
Trend Comparison
Teradyne’s stock rose 161.08% over 12 months, showing a bullish trend with accelerating momentum and high volatility. It reached a high of 269.07 and a low of 68.72.
Skyworks experienced a 43.31% drop in the same period, reflecting a bearish trend with decelerating losses and moderate volatility. Its price ranged from 52.78 to 116.18.
Teradyne delivered superior market performance with strong upward momentum, while Skyworks declined steadily under seller dominance.
Target Prices
Analyst consensus on target prices shows mixed upside potential across these semiconductor players.
| Company | Target Low | Target High | Consensus |
|---|---|---|---|
| Teradyne, Inc. | 175 | 335 | 276.08 |
| Skyworks Solutions, Inc. | 58 | 140 | 77.36 |
Teradyne’s consensus target of 276.08 slightly exceeds its current price of 269.07, signaling modest upside. Skyworks’ consensus target of 77.36 is well above its current 59, indicating stronger growth expectations.

Don’t Let Luck Decide Your Entry Point
Optimize your entry points with our advanced ProRealTime indicators. You’ll get efficient buy signals with precise price targets for maximum performance. Start outperforming now!
How do institutions grade them?
The following tables summarize recent grades from reputable institutions for both companies:
Teradyne, Inc. Grades
Below is a summary of Teradyne’s most recent grades from leading analysts.
| Grading Company | Action | New Grade | Date |
|---|---|---|---|
| Cantor Fitzgerald | Maintain | Overweight | 2026-02-04 |
| Goldman Sachs | Maintain | Buy | 2026-02-04 |
| Stifel | Maintain | Buy | 2026-02-04 |
| Evercore ISI Group | Maintain | Outperform | 2026-02-04 |
| Citigroup | Maintain | Buy | 2026-02-04 |
| Evercore ISI Group | Maintain | Outperform | 2026-02-03 |
| Cantor Fitzgerald | Maintain | Overweight | 2026-02-02 |
| Stifel | Maintain | Buy | 2026-01-30 |
| UBS | Maintain | Buy | 2026-01-26 |
| B of A Securities | Maintain | Buy | 2026-01-22 |
Skyworks Solutions, Inc. Grades
Below is a summary of Skyworks Solutions’ most recent grades from leading analysts.
| Grading Company | Action | New Grade | Date |
|---|---|---|---|
| Citigroup | Maintain | Neutral | 2026-02-04 |
| Stifel | Maintain | Hold | 2026-02-04 |
| Benchmark | Maintain | Hold | 2026-02-04 |
| Keybanc | Maintain | Overweight | 2026-02-04 |
| JP Morgan | Maintain | Neutral | 2026-02-04 |
| Morgan Stanley | Maintain | Equal Weight | 2026-02-02 |
| B. Riley Securities | Maintain | Neutral | 2026-01-26 |
| Mizuho | Maintain | Neutral | 2026-01-26 |
| Susquehanna | Maintain | Neutral | 2026-01-22 |
| UBS | Maintain | Neutral | 2026-01-20 |
Which company has the best grades?
Teradyne consistently receives Buy or Outperform ratings from multiple top-tier firms. Skyworks mostly garners Neutral or Hold grades, with few Overweight ratings. This disparity might influence investors’ confidence and perceived upside potential.
Risks specific to each company
The following categories identify the critical pressure points and systemic threats facing both firms in the 2026 market environment:
1. Market & Competition
Teradyne, Inc.
- Operates in diverse semiconductor test and automation segments, facing intense competition from specialized test equipment makers.
Skyworks Solutions, Inc.
- Focuses on proprietary semiconductor components amid fierce competition from global analog and mixed-signal chip manufacturers.
2. Capital Structure & Debt
Teradyne, Inc.
- Low debt-to-equity (0.12) and strong interest coverage (81.43) indicate solid financial stability with minimal leverage risk.
Skyworks Solutions, Inc.
- Moderate leverage (debt-to-equity 0.21) with adequate interest coverage (20.44) presents manageable but higher financial risk.
3. Stock Volatility
Teradyne, Inc.
- High beta of 1.82 signals elevated stock price volatility relative to the market, increasing investment risk.
Skyworks Solutions, Inc.
- Lower beta of 1.32 suggests more moderate volatility and comparatively steadier stock price behavior.
4. Regulatory & Legal
Teradyne, Inc.
- Exposure to export controls and compliance in defense and wireless test sectors creates regulatory complexity.
Skyworks Solutions, Inc.
- Global operations, especially in Asia, expose it to evolving regulatory and trade restrictions impacting semiconductor sales.
5. Supply Chain & Operations
Teradyne, Inc.
- Relies on semiconductor foundries and contract manufacturers; supply chain disruptions may delay product delivery.
Skyworks Solutions, Inc.
- Faces supply chain risks due to dependence on raw materials and manufacturing facilities across multiple countries.
6. ESG & Climate Transition
Teradyne, Inc.
- Industrial automation focus supports energy-efficient manufacturing but requires ongoing investment to meet ESG goals.
Skyworks Solutions, Inc.
- ESG initiatives are critical amid growing investor scrutiny and regulatory demands on semiconductor environmental impact.
7. Geopolitical Exposure
Teradyne, Inc.
- Moderate geopolitical risk due to U.S.-China tensions affecting semiconductor testing and industrial automation markets.
Skyworks Solutions, Inc.
- Significant exposure to Asia-Pacific geopolitical risks, including supply chain and market access uncertainties.
Which company shows a better risk-adjusted profile?
Teradyne faces its greatest risk from high stock volatility, posing investor uncertainty despite strong financials. Skyworks’ key risk lies in geopolitical exposure due to its Asia operations. Overall, Teradyne’s robust balance sheet and superior interest coverage offer a better risk-adjusted profile. Skyworks’ stronger Piotroski score signals financial health, but greater geopolitical and regulatory challenges temper upside. The widening valuation gap—Teradyne’s rich P/E at 54.6 versus Skyworks’ 25—reflects market caution on Teradyne’s price volatility.
Final Verdict: Which stock to choose?
Teradyne, Inc. (TER) stands out as a powerhouse of operational efficiency and value creation, boasting a robust moat with returns well above its cost of capital. Its main point of vigilance is a sharply declining ROIC trend, signaling potential future margin pressure. TER suits aggressive growth portfolios seeking premium exposure in automation and test equipment.
Skyworks Solutions, Inc. (SWKS) offers a strategic moat rooted in resilient recurring revenue and solid cash flow generation, with a safety profile superior to TER’s given its lower leverage and higher dividend yield. However, its value destruction trend and weakening profitability warrant caution. SWKS fits growth-at-a-reasonable-price (GARP) investors who prioritize income with moderate risk.
If you prioritize aggressive capital appreciation and can tolerate valuation premiums, Teradyne outshines due to its superior operational leverage and industry positioning. However, if you seek better stability with income potential and less valuation risk, Skyworks offers a safer haven despite its profitability challenges. Each scenario reflects distinct investor appetites and risk tolerances.
Disclaimer: Investment carries a risk of loss of initial capital. The past performance is not a reliable indicator of future results. Be sure to understand risks before making an investment decision.
Go Further
I encourage you to read the complete analyses of Teradyne, Inc. and Skyworks Solutions, Inc. to enhance your investment decisions: