Home > Comparison > Technology > TXN vs SKYT
The strategic rivalry between Texas Instruments Incorporated and SkyWater Technology, Inc. shapes the semiconductor sector’s evolution. Texas Instruments operates as a diversified analog and embedded processing powerhouse with a vast global footprint. In contrast, SkyWater Technology focuses on niche semiconductor manufacturing and development services with a leaner operational model. This analysis will evaluate which company’s strategic path delivers the superior risk-adjusted return potential for a diversified portfolio amid ongoing technological advances.

Table of contents
Companies Overview
Texas Instruments Incorporated and SkyWater Technology, Inc. represent two distinct forces in the semiconductor industry.
Texas Instruments Incorporated: Semiconductor Powerhouse
Texas Instruments dominates the semiconductor space by designing and selling analog and embedded processing chips. Its core revenue derives from power management products and microcontrollers serving industrial, automotive, and personal electronics markets. In 2026, TI’s strategic focus remains on innovation in analog solutions and expanding embedded processing capabilities to reinforce its broad market leadership.
SkyWater Technology, Inc.: Specialized Semiconductor Manufacturer
SkyWater Technology specializes in semiconductor development and manufacturing services. Its business model centers on co-creating custom technologies and producing advanced silicon-based chips for aerospace, defense, automotive, and IoT sectors. In 2026, SkyWater prioritizes deepening customer partnerships and scaling manufacturing capacity within niche high-tech applications to capture growth in specialized markets.
Strategic Collision: Similarities & Divergences
Texas Instruments builds on a vertically integrated model with a wide product portfolio, while SkyWater leans on a collaborative, client-focused service approach. Their competition unfolds primarily in analog and mixed-signal semiconductor markets. TI’s scale and market position contrast sharply with SkyWater’s nimble, innovation-driven profile, offering investors distinct exposure to semiconductor sector dynamics.
Income Statement Comparison
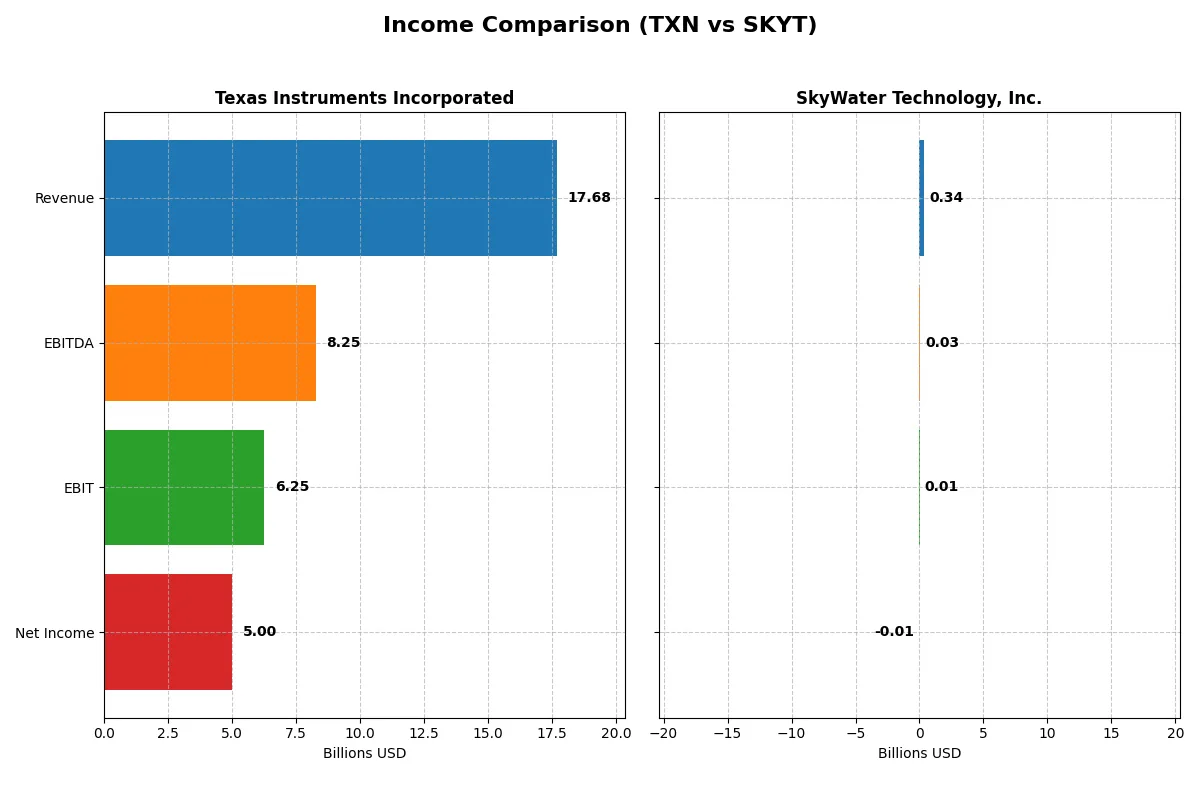
This data dissects the core profitability and scalability of both corporate engines to reveal who dominates the bottom line:
| Metric | Texas Instruments Incorporated (TXN) | SkyWater Technology, Inc. (SKYT) |
|---|---|---|
| Revenue | 17.7B | 342M |
| Cost of Revenue | 7.6B | 273M |
| Operating Expenses | 4.1B | 63M |
| Gross Profit | 10.1B | 70M |
| EBITDA | 8.3B | 25M |
| EBIT | 6.3B | 7M |
| Interest Expense | 543M | 9M |
| Net Income | 5.0B | -7M |
| EPS | 5.45 | -0.14 |
| Fiscal Year | 2025 | 2024 |
Income Statement Analysis: The Bottom-Line Duel
This income statement comparison exposes the true efficiency of Texas Instruments and SkyWater’s corporate engines through revenue and profitability metrics.
Texas Instruments Incorporated Analysis
Texas Instruments posts a large-scale revenue of $17.7B in 2025, up 13% from the prior year, but down 3.6% over five years. Net income stands at $5B, reflecting a 28.3% net margin, which I find consistently strong. Gross margin remains robust at 57%, signaling efficient cost control, though net margin dipped slightly last year. The company shows steady momentum with favorable operating income and EPS growth.
SkyWater Technology, Inc. Analysis
SkyWater’s revenue rose 19.4% to $342M in 2024, marking a 144% surge over five years. Despite this growth, net income stays negative at -$6.8M with a weak net margin of -2%. The gross margin at 20.3% is modest but improving, and EBIT turned positive after years of losses. I observe strong upward momentum, though profitability remains elusive for now.
Verdict: Scale and Stability vs. Growth and Turnaround
Texas Instruments dominates in scale, profitability, and margin consistency, delivering reliable cash flows with a solid 28% net margin. SkyWater impresses with rapid revenue and margin expansion but still faces losses. For investors seeking stable earnings and proven efficiency, Texas Instruments leads. SkyWater’s profile suits those focused on growth potential amid ongoing operational challenges.
Financial Ratios Comparison
These vital ratios act as a diagnostic tool to expose the underlying fiscal health, valuation premiums, and capital efficiency of the companies compared below:
| Ratios | Texas Instruments (TXN) | SkyWater Technology (SKYT) |
|---|---|---|
| ROE | 30.7% | -11.8% |
| ROIC | 16.5% | 3.4% |
| P/E | 31.5 | -100.3 |
| P/B | 9.7 | 11.8 |
| Current Ratio | 4.35 | 0.86 |
| Quick Ratio | 2.83 | 0.76 |
| D/E (Debt-to-Equity) | 0.86 | 1.33 |
| Debt-to-Assets | 40.6% | 24.5% |
| Interest Coverage | 11.1 | 0.74 |
| Asset Turnover | 0.51 | 1.09 |
| Fixed Asset Turnover | 1.44 | 2.07 |
| Payout Ratio | 100.0% | 0% |
| Dividend Yield | 3.2% | 0% |
| Fiscal Year | 2025 | 2024 |
Efficiency & Valuation Duel: The Vital Signs
Financial ratios act as a company’s DNA, revealing hidden risks and operational strengths that shape investment outcomes.
Texas Instruments Incorporated
Texas Instruments displays robust profitability with a 30.7% ROE and a strong 28.3% net margin, signaling operational efficiency. However, its valuation appears stretched, with a high P/E of 31.5 and a P/B near 9.7. The company supports shareholders through a 3.17% dividend yield, balancing returns with reinvestment in R&D.
SkyWater Technology, Inc.
SkyWater struggles with negative net margin (-1.98%) and ROE (-11.8%), reflecting operational challenges. Its P/E is negative but flagged favorable due to losses, while the P/B of 11.8 signals high book value expectations. The firm pays no dividend, channeling resources into growth amid unfavorable liquidity and leverage metrics.
Premium Profitability vs. Distressed Growth Profile
Texas Instruments offers a superior balance of profitability and shareholder returns despite a premium valuation. SkyWater’s weak profitability and financial health pose risk, fitting higher-risk investors seeking potential turnaround plays. I see Texas Instruments as the safer, more consistent choice.
Which one offers the Superior Shareholder Reward?
I observe Texas Instruments (TXN) delivers consistent dividends with a 3.17% yield and nearly 100% payout ratio, backed by solid free cash flow (2.9B/share in 2025). TXN also executes steady buybacks, reinforcing shareholder returns. SkyWater Technology (SKYT) pays no dividends and suffers net losses, relying on reinvestment to fuel growth. Its weak operating cash flow and high leverage raise sustainability concerns. TXN’s mature, balanced approach offers a more attractive, sustainable total return profile for investors in 2026.
Comparative Score Analysis: The Strategic Profile
The radar chart reveals the fundamental DNA and trade-offs of Texas Instruments and SkyWater Technology, highlighting their core financial strengths and weaknesses:
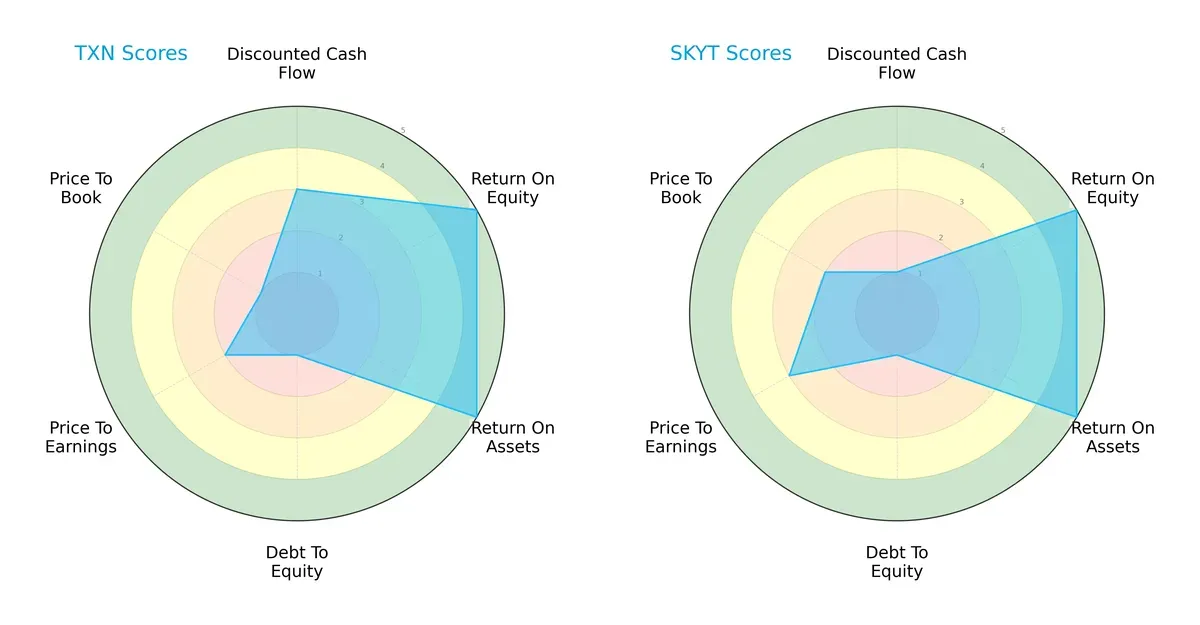
Texas Instruments shows balanced strength in profitability with very favorable ROE and ROA scores (5 each), while SkyWater matches these but lags significantly in discounted cash flow (DCF) with a very unfavorable score of 1. Both firms struggle with debt-to-equity, scoring a weak 1, signaling high leverage risk. SkyWater’s valuation scores (P/E 3, P/B 2) slightly outperform Texas Instruments (P/E 2, P/B 1), indicating a relatively fairer market pricing. Overall, Texas Instruments presents a more balanced profile, leveraging operational efficiency, whereas SkyWater relies more on market valuation metrics.
Bankruptcy Risk: Solvency Showdown
Texas Instruments’ Altman Z-Score is a robust 10.3, firmly in the safe zone, while SkyWater’s 2.35 places it in the grey zone, implying moderate bankruptcy risk in this cycle:
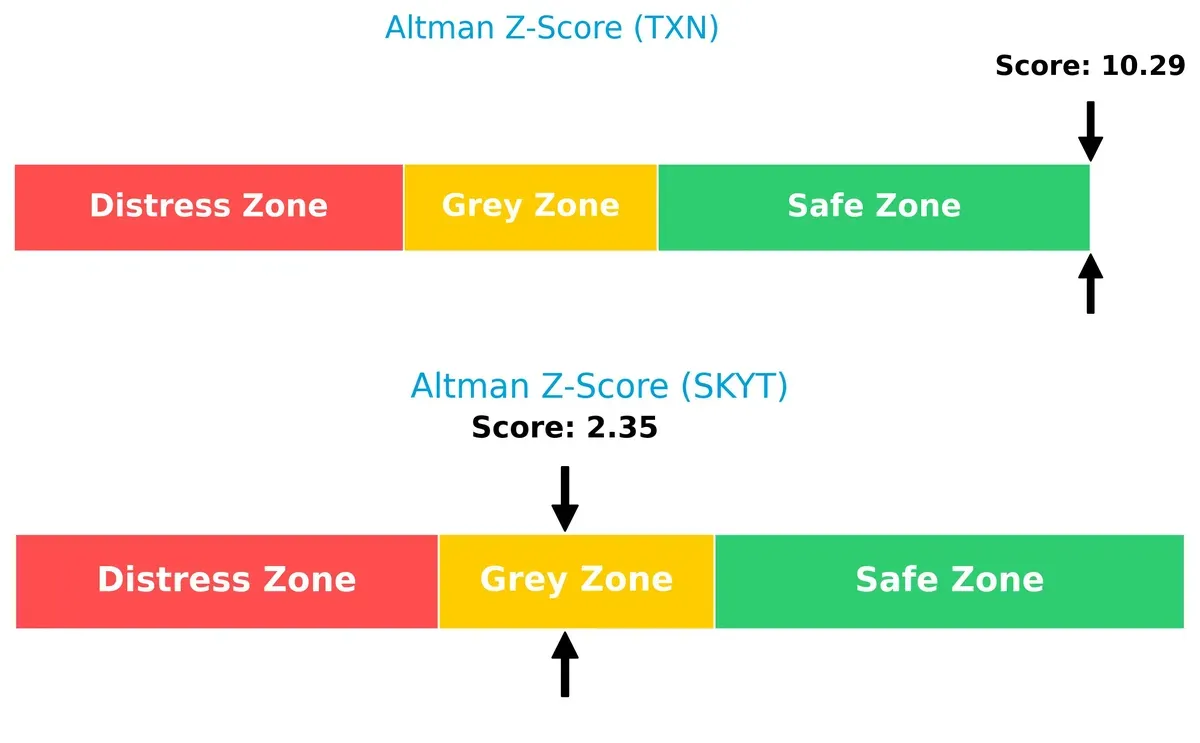
This wide gap reflects Texas Instruments’ superior financial stability and resilience. SkyWater’s score warns investors to monitor solvency closely, especially given industry cyclicality and capital intensity.
Financial Health: Quality of Operations
Texas Instruments achieves a strong Piotroski F-Score of 7, signaling solid financial health, while SkyWater’s average 5 score suggests moderate operational quality with some red flags:
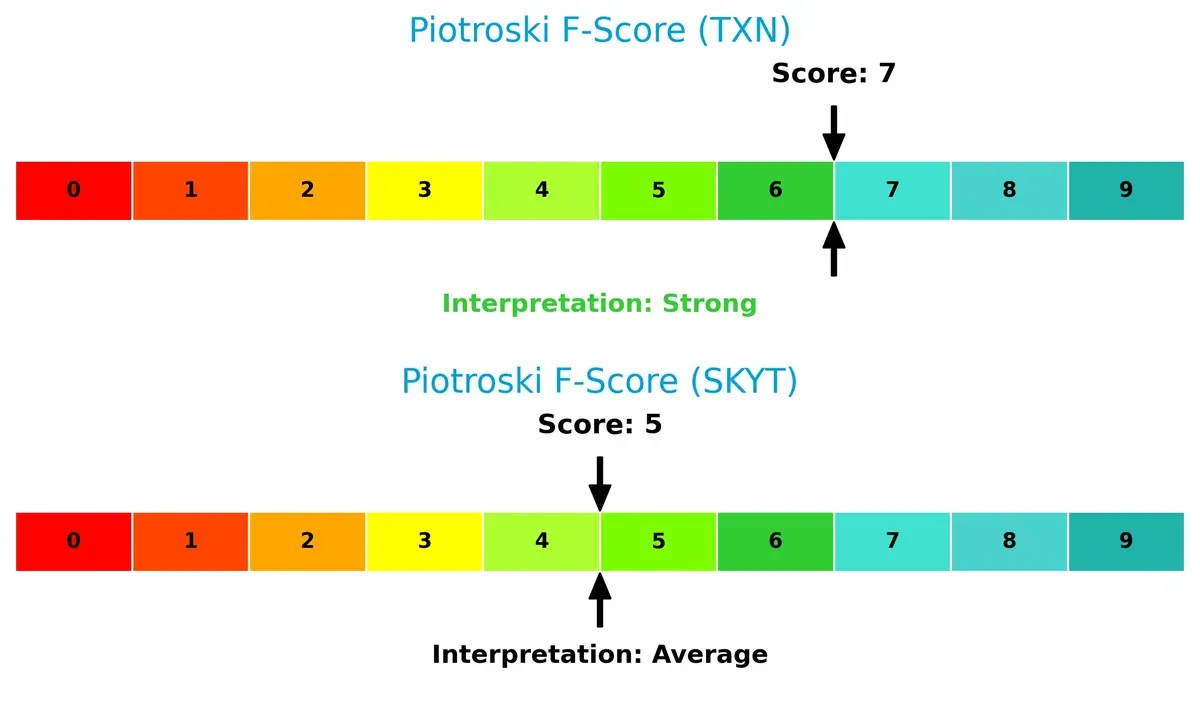
Texas Instruments demonstrates better internal financial discipline and profitability metrics. SkyWater’s middling score advises caution on operational efficiency and earnings quality relative to its peer.
How are the two companies positioned?
This section dissects the operational DNA of Texas Instruments and SkyWater by comparing their revenue distribution and internal dynamics. The goal is to confront their economic moats to identify which model delivers the most resilient competitive advantage today.
Revenue Segmentation: The Strategic Mix
This visual comparison dissects how Texas Instruments Incorporated and SkyWater Technology, Inc. diversify their income streams and reveals where their primary sector bets lie:
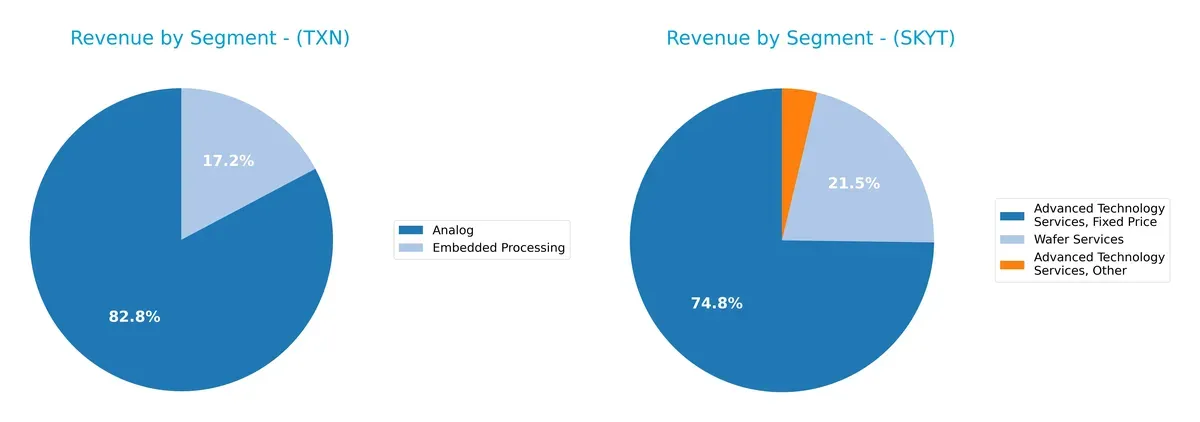
Texas Instruments anchors its revenue in Analog, generating $12.2B in 2024, with Embedded Processing at $2.5B, showing a strong but somewhat concentrated portfolio. SkyWater relies heavily on Advanced Technology Services, with $93M fixed price plus other related services, and $27M from Wafer Services. TXN’s focus on Analog signals infrastructure dominance, while SKYT’s split among service types suggests broader diversification within a niche market but at a far smaller scale.
Strengths and Weaknesses Comparison
This table compares the Strengths and Weaknesses of Texas Instruments Incorporated and SkyWater Technology, Inc.:
Texas Instruments Incorporated Strengths
- High net margin at 28.28%
- Strong ROE of 30.73%
- Favorable ROIC of 16.52%
- Diverse revenue streams from Analog and Embedded Processing
- Significant global presence across Asia, EMEA, and the US
- Solid interest coverage ratio at 11.52
SkyWater Technology, Inc. Strengths
- Favorable price-to-earnings despite negative net margin
- Low debt-to-assets at 24.46%
- Strong asset turnover at 1.09
- Growing Advanced Technology Services revenue
- Focused US and Canada market presence
- Neutral fixed asset turnover of 2.07
Texas Instruments Incorporated Weaknesses
- Unfavorable P/E at 31.53 and high P/B at 9.69
- Unfavorable current ratio of 4.35 suggests excess liquidity
- Moderate debt-to-equity at 0.86
- Neutral asset and fixed asset turnover
- Limited growth in some segments recently
- High valuation multiples may pressure returns
SkyWater Technology, Inc. Weaknesses
- Negative net margin and ROE indicate unprofitability
- High WACC at 19.95% increases capital costs
- Unfavorable liquidity ratios: current 0.86, quick 0.76
- Weak interest coverage at 0.74
- High debt-to-equity at 1.33
- No dividend yield limits income for investors
Texas Instruments combines strong profitability and global diversification but carries valuation and liquidity concerns. SkyWater faces profitability and liquidity challenges but benefits from low leverage and operational efficiency, reflecting different strategic and financial profiles.
The Moat Duel: Analyzing Competitive Defensibility
A structural moat is the only reliable barrier protecting long-term profits from relentless competition erosion. Let’s dissect the competitive moats of two semiconductor firms:
Texas Instruments Incorporated: Intangible Assets & Cost Advantage
Texas Instruments leverages strong intangible assets and scale-driven cost advantages. Its high ROIC and stable margins reflect efficient capital use. In 2026, new analog and embedded processing products could deepen this moat but face geopolitical risks in Asia.
SkyWater Technology, Inc.: Growth-Driven Engineering Niche
SkyWater’s moat centers on specialized engineering services and process development, contrasting Texas Instruments’ broad scale. Despite current negative ROIC, its rapid profitability growth signals improving efficiency and niche expansion potential, especially in aerospace and defense markets.
Scale & Intangibles vs. Engineering Growth: The Moat Verdict
Texas Instruments holds a wider moat through consistent value creation and scale, though its ROIC trend is declining. SkyWater’s moat is narrower but deepening with accelerating profitability. Texas Instruments remains better equipped to defend market share in a competitive semiconductor landscape.
Which stock offers better returns?
The past year shows strong price gains for both Texas Instruments and SkyWater Technology, with notable acceleration in recent months and increasing trading volumes highlighting active investor interest.
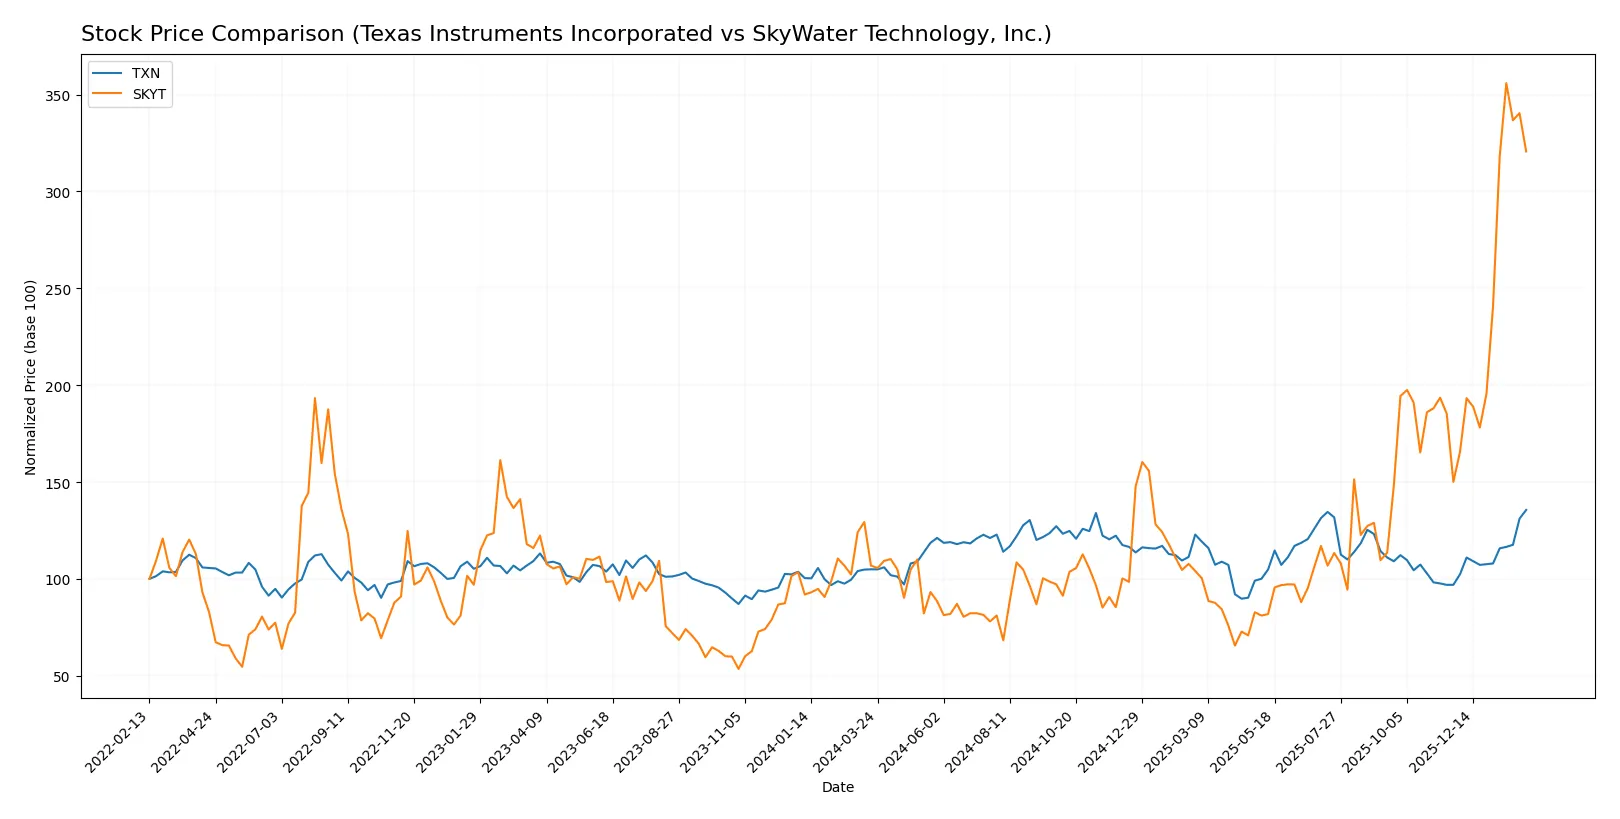
Trend Comparison
Texas Instruments’ stock rose 29.21% over the last 12 months, reflecting a bullish trend with accelerating momentum and high volatility indicated by a 16.23 standard deviation.
SkyWater Technology’s stock surged 200% in the same period, signaling a strong bullish trend with acceleration and comparatively lower volatility at a 5.6 standard deviation.
SkyWater Technology outperformed Texas Instruments, delivering significantly higher returns and sustained acceleration throughout the past year.
Target Prices
Analysts present a mixed but clear consensus on target prices for Texas Instruments and SkyWater Technology.
| Company | Target Low | Target High | Consensus |
|---|---|---|---|
| Texas Instruments Incorporated | 160 | 260 | 204.64 |
| SkyWater Technology, Inc. | 35 | 35 | 35 |
Texas Instruments’ consensus target at 204.64 sits below its current price of 222.92, signaling cautious optimism. SkyWater’s fixed target at 35 suggests expectations for a rebound from its current 29.82 price.

Don’t Let Luck Decide Your Entry Point
Optimize your entry points with our advanced ProRealTime indicators. You’ll get efficient buy signals with precise price targets for maximum performance. Start outperforming now!
How do institutions grade them?
Here is a summary of recent institutional grades for Texas Instruments Incorporated and SkyWater Technology, Inc.:
Texas Instruments Incorporated Grades
The table below shows recent grades from major financial institutions for Texas Instruments Incorporated:
| Grading Company | Action | New Grade | Date |
|---|---|---|---|
| Jefferies | Maintain | Hold | 2026-01-28 |
| Cantor Fitzgerald | Maintain | Neutral | 2026-01-28 |
| Goldman Sachs | Maintain | Sell | 2026-01-28 |
| Truist Securities | Maintain | Hold | 2026-01-28 |
| Deutsche Bank | Maintain | Hold | 2026-01-28 |
| Stifel | Maintain | Hold | 2026-01-28 |
| UBS | Maintain | Buy | 2026-01-28 |
| B of A Securities | Upgrade | Neutral | 2026-01-28 |
| Wells Fargo | Maintain | Equal Weight | 2026-01-28 |
| JP Morgan | Maintain | Overweight | 2026-01-28 |
SkyWater Technology, Inc. Grades
The table below summarizes recent grades issued for SkyWater Technology, Inc.:
| Grading Company | Action | New Grade | Date |
|---|---|---|---|
| TD Cowen | Downgrade | Hold | 2026-01-27 |
| Piper Sandler | Downgrade | Neutral | 2026-01-27 |
| Needham | Downgrade | Hold | 2026-01-27 |
| TD Cowen | Maintain | Buy | 2025-11-06 |
| Needham | Maintain | Buy | 2025-11-06 |
| Piper Sandler | Maintain | Overweight | 2025-11-06 |
| Needham | Maintain | Buy | 2025-08-07 |
| Needham | Maintain | Buy | 2025-05-08 |
| Needham | Maintain | Buy | 2025-02-27 |
| Needham | Maintain | Buy | 2024-11-11 |
Which company has the best grades?
Texas Instruments holds a conservative mix of Hold and Neutral grades with some Buy ratings, while SkyWater has experienced multiple downgrades recently. Investors may view Texas Instruments’ steadier grades as reflecting more stable institutional confidence.
Risks specific to each company
The following categories identify the critical pressure points and systemic threats facing both firms in the 2026 market environment:
1. Market & Competition
Texas Instruments Incorporated (TXN)
- Established analog and embedded processing segments secure stable demand amid semiconductor cyclical pressures.
SkyWater Technology, Inc. (SKYT)
- Smaller scale and newer IPO face intense competition in niche foundry and development services markets.
2. Capital Structure & Debt
Texas Instruments Incorporated (TXN)
- Moderate debt-to-equity (0.86) with strong interest coverage (11.52) supports financial stability.
SkyWater Technology, Inc. (SKYT)
- High debt-to-equity (1.33) and weak interest coverage (0.74) increase refinancing and solvency risks.
3. Stock Volatility
Texas Instruments Incorporated (TXN)
- Beta near 1 (0.995) indicates market-level volatility, suitable for risk-averse investors.
SkyWater Technology, Inc. (SKYT)
- High beta (3.513) signals extreme price swings, increasing risk but potential rewards.
4. Regulatory & Legal
Texas Instruments Incorporated (TXN)
- Large global footprint exposes TXN to broad regulatory frameworks but benefits from compliance experience.
SkyWater Technology, Inc. (SKYT)
- Being smaller, SKYT may face greater relative impact from sudden regulatory shifts in US semiconductor policy.
5. Supply Chain & Operations
Texas Instruments Incorporated (TXN)
- Extensive established supply chains provide resilience but risk exposure to global chip shortages persists.
SkyWater Technology, Inc. (SKYT)
- Dependence on advanced process development and foundry partnerships makes SKYT vulnerable to capacity constraints.
6. ESG & Climate Transition
Texas Instruments Incorporated (TXN)
- Larger entity with ESG initiatives likely benefits from investor goodwill and regulatory alignment.
SkyWater Technology, Inc. (SKYT)
- Emerging firm may lag in ESG maturity, posing reputational and compliance risks as standards tighten.
7. Geopolitical Exposure
Texas Instruments Incorporated (TXN)
- Global sales and manufacturing expose TXN to US-China tensions and trade policy volatility.
SkyWater Technology, Inc. (SKYT)
- Primarily US-based operations reduce geopolitical risks but limit global growth opportunities.
Which company shows a better risk-adjusted profile?
Texas Instruments shows a superior risk-adjusted profile, supported by strong financial health and stable market position. SkyWater’s high leverage, poor interest coverage, and elevated stock volatility amplify its risk. The most impactful risk for TXN is geopolitical exposure given its global reach. For SKYT, its fragile capital structure is the primary concern. TXN’s Altman Z-score of 10.3 confirms financial safety, while SKYT’s 2.35 signals moderate distress risk, highlighting prudence for SKYT investors.
Final Verdict: Which stock to choose?
Texas Instruments Incorporated’s superpower lies in its robust capital efficiency and strong cash generation, supported by a well-entrenched market position. Its declining ROIC trend is a point of vigilance, suggesting pressure on profitability ahead. TXN fits well in portfolios seeking steady, long-term growth with moderate risk tolerance.
SkyWater Technology, Inc. offers a strategic moat through rapid top-line growth and improving profitability metrics, signaling a turnaround phase. However, its financial fragility and weaker balance sheet relative to TXN warrant caution. SKYT suits investors aiming for high-growth potential with a tolerance for volatility and operational risk.
If you prioritize consistent value creation and capital discipline, Texas Instruments outshines with superior stability and a proven moat. However, if you seek aggressive growth and can withstand financial risks, SkyWater’s accelerating momentum presents a compelling, albeit speculative, scenario. Both demand careful risk assessment aligned with your investment profile.
Disclaimer: Investment carries a risk of loss of initial capital. The past performance is not a reliable indicator of future results. Be sure to understand risks before making an investment decision.
Go Further
I encourage you to read the complete analyses of Texas Instruments Incorporated and SkyWater Technology, Inc. to enhance your investment decisions: