Home > Comparison > Technology > TER vs SKYT
The strategic rivalry between Teradyne, Inc. and SkyWater Technology, Inc. defines the semiconductor sector’s current evolution. Teradyne operates as a diversified technology powerhouse, blending semiconductor test equipment with industrial automation. SkyWater focuses on specialized semiconductor manufacturing and development services, catering to niche markets like aerospace and defense. This clash of scale versus specialization frames a compelling debate on growth potential and risk. This analysis aims to identify which trajectory offers superior risk-adjusted returns for diversified portfolios.
Table of contents
Companies Overview
Teradyne and SkyWater Technology hold pivotal roles in the semiconductor sector, shaping critical industry segments.
Teradyne, Inc.: Global Leader in Automated Testing Solutions
Teradyne commands the semiconductor testing equipment market, generating revenue through diversified segments: Semiconductor Test, System Test, Industrial Automation, and Wireless Test. Its core strength lies in sophisticated test systems for wafers, memory devices, and wireless technologies. In 2026, Teradyne focuses strategically on expanding industrial automation and wireless testing capabilities, leveraging its broad product portfolio to serve automotive, cloud computing, and consumer electronics sectors.
SkyWater Technology, Inc.: Advanced Semiconductor Manufacturing Partner
SkyWater Technology specializes in semiconductor development and manufacturing services with an emphasis on silicon-based analog, mixed-signal, and rad-hard integrated circuits. It collaborates closely with customers on engineering and process development. In 2026, SkyWater prioritizes co-creating technologies for aerospace, defense, automotive, and IoT markets, positioning itself as a nimble foundry for specialized semiconductor applications.
Strategic Collision: Similarities & Divergences
Teradyne and SkyWater both target semiconductor innovation but diverge sharply in business models: Teradyne excels in automated test equipment while SkyWater focuses on manufacturing services and process co-development. Their primary battleground is the semiconductor value chain, with Teradyne upstream in testing and SkyWater downstream in fabrication. Investors face distinct profiles—Teradyne offers scale and diversification, whereas SkyWater presents growth potential in specialized manufacturing niches.
Income Statement Comparison
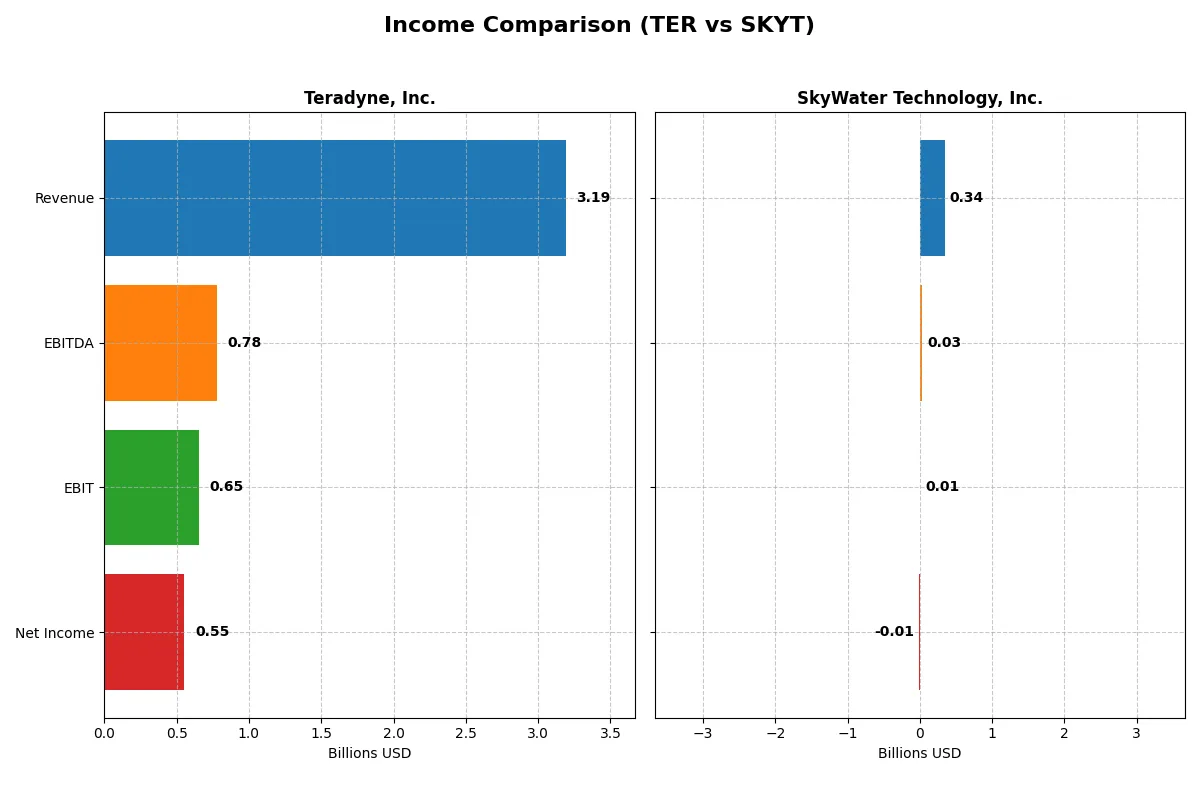
The following data dissects the core profitability and scalability of both corporate engines to reveal who dominates the bottom line:
| Metric | Teradyne, Inc. (TER) | SkyWater Technology, Inc. (SKYT) |
|---|---|---|
| Revenue | 3.19B | 342M |
| Cost of Revenue | 1.32B | 273M |
| Operating Expenses | 1.17B | 63M |
| Gross Profit | 1.87B | 70M |
| EBITDA | 780M | 25M |
| EBIT | 653M | 7M |
| Interest Expense | 8M | 9M |
| Net Income | 554M | -7M |
| EPS | 3.49 | -0.14 |
| Fiscal Year | 2025 | 2024 |
Income Statement Analysis: The Bottom-Line Duel
This income statement comparison reveals the true efficiency and growth dynamics powering each company’s financial engine.
Teradyne, Inc. Analysis
Teradyne’s revenue declined by 13.85% from 2021 to 2025 but rebounded 13.13% in the latest year to $3.19B. Net income fell 45.39% over five years, though it improved slightly last year to $554M. Gross margin remains strong at 58.55%, supporting a solid net margin of 17.37%. Operating efficiency drives steady EBIT growth despite margin compression.
SkyWater Technology, Inc. Analysis
SkyWater’s revenue surged 143.72% from 2020 to 2024, reaching $342M. Net income turned positive recently, improving 67.05% overall but still posting a modest net loss of $6.8M in 2024. Gross margin stands at 20.34%, while EBIT margin is thin at 1.92%. The firm shows rapid momentum, nearly doubling EBIT and EPS in the latest year, signaling operational gains from scale.
Margin Strength vs. Growth Momentum
Teradyne excels with robust margins and consistent profitability, despite revenue volatility. SkyWater impresses with fast revenue and earnings growth but remains unprofitable at the bottom line. Teradyne’s profile suits investors prioritizing margin power and cash generation. SkyWater appeals to those seeking high-growth potential with improving efficiency but higher risk.
Financial Ratios Comparison
These vital ratios act as a diagnostic tool to expose the underlying fiscal health, valuation premiums, and capital efficiency of the companies compared below:
| Ratios | Teradyne, Inc. (TER) | SkyWater Technology, Inc. (SKYT) |
|---|---|---|
| ROE | 19.8% | -11.8% |
| ROIC | 18.4% | 3.4% |
| P/E | 54.6 | -100.3 |
| P/B | 10.8 | 11.8 |
| Current Ratio | 1.76 | 0.86 |
| Quick Ratio | 1.41 | 0.76 |
| D/E | 0.12 | 1.33 |
| Debt-to-Assets | 8.3% | 24.5% |
| Interest Coverage | 86.4 | 0.74 |
| Asset Turnover | 0.76 | 1.09 |
| Fixed Asset Turnover | 4.99 | 2.07 |
| Payout Ratio | 13.8% | 0% |
| Dividend Yield | 0.25% | 0% |
| Fiscal Year | 2025 | 2024 |
Efficiency & Valuation Duel: The Vital Signs
Financial ratios act as a company’s DNA, uncovering hidden risks and revealing operational excellence essential for informed investing decisions.
Teradyne, Inc.
Teradyne delivers strong profitability with a 19.82% ROE and a solid 17.37% net margin, highlighting efficient operations. However, the stock trades at a stretched 54.64 P/E and 10.83 P/B, signaling a premium valuation. It offers a modest 0.25% dividend yield, balancing shareholder returns with continued R&D investment at 15.8% of revenue.
SkyWater Technology, Inc.
SkyWater shows weak profitability, with a negative 11.79% ROE and a -1.98% net margin, reflecting operational challenges. Its valuation metrics are mixed: a negative P/E but an expensive 11.82 P/B ratio. The company pays no dividend, focusing instead on growth via R&D spending of roughly 4.4% of revenue, despite a strained liquidity position.
Premium Valuation vs. Operational Safety
Teradyne offers superior profitability and operational efficiency but at a high valuation premium. SkyWater’s financials show riskier fundamentals and weaker returns. Investors prioritizing stability and proven execution may prefer Teradyne, while those seeking turnaround potential may consider SkyWater’s growth profile.
Which one offers the Superior Shareholder Reward?
I see Teradyne, Inc. (TER) pays a modest dividend yield around 0.25–0.5%, with a conservative payout ratio near 14%. TER sustains dividends well above free cash flow, indicating a prudent, reliable distribution. It also executes meaningful share buybacks, enhancing total returns. Conversely, SkyWater Technology, Inc. (SKYT) pays no dividends and shows negative net margins. SKYT relies solely on reinvestment for growth, but its high debt and weak cash flows raise sustainability concerns. TER’s balanced dividend and buyback approach delivers more consistent and sustainable shareholder rewards in 2026. I favor TER for superior total return potential.
Comparative Score Analysis: The Strategic Profile
The radar chart reveals the fundamental DNA and trade-offs of Teradyne, Inc. and SkyWater Technology, Inc., highlighting their financial strengths and valuation contrasts:
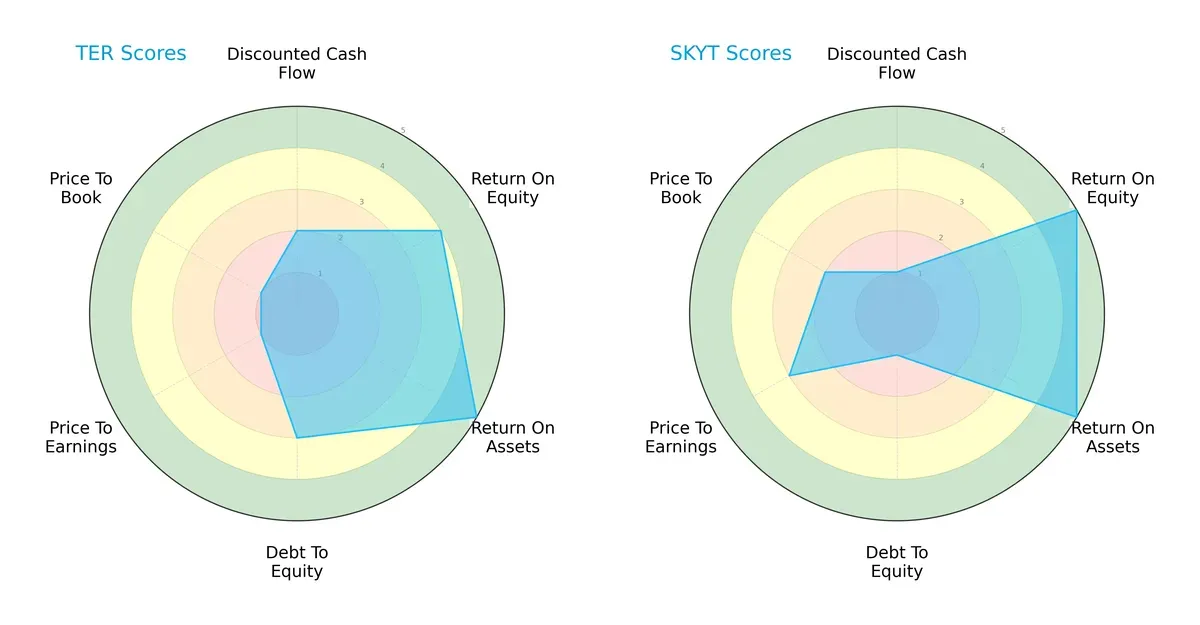
Teradyne boasts a balanced operational efficiency with strong ROA (5) and solid ROE (4), supported by moderate debt management (3). However, its valuation scores (P/E and P/B at 1) signal potential overvaluation risks. SkyWater excels in profitability (ROE 5, ROA 5) but carries high financial risk with a weak debt-to-equity score (1). Its valuation metrics (P/E 3, P/B 2) suggest more reasonable pricing. Teradyne shows a more balanced profile, while SkyWater leans heavily on operational efficiency despite leverage concerns.
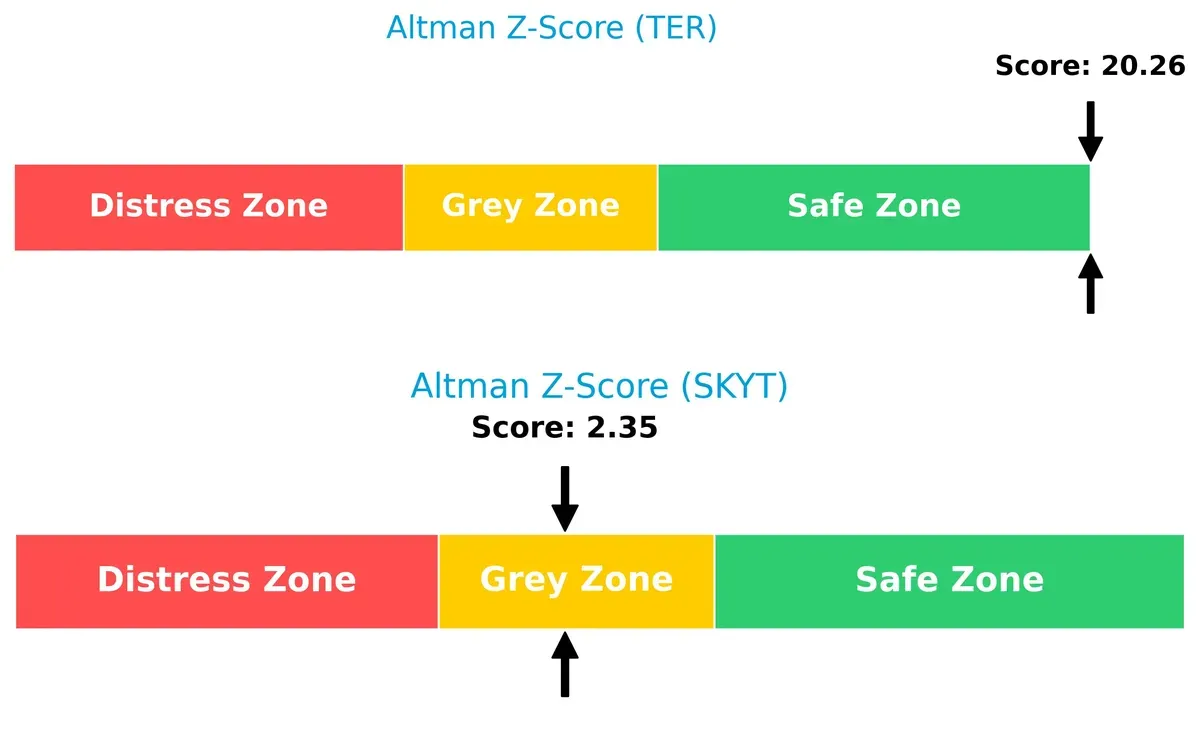
Bankruptcy Risk: Solvency Showdown
Teradyne’s Altman Z-Score of 20.3 places it deep in the safe zone, whereas SkyWater’s 2.35 situates it in the grey zone, indicating higher bankruptcy risk in this cycle:
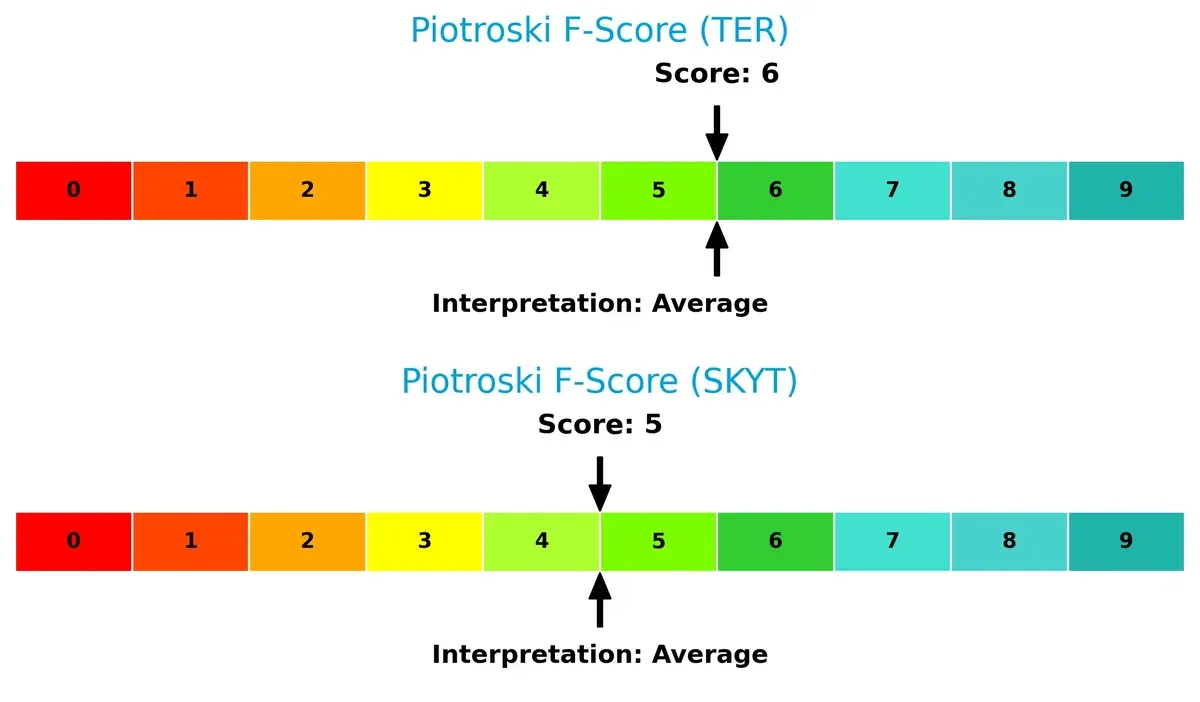
Financial Health: Quality of Operations
Teradyne and SkyWater score 6 and 5 on the Piotroski F-Score, respectively, both reflecting average financial health. Neither shows critical red flags, but Teradyne maintains a slight edge in operational quality:
How are the two companies positioned?
This section dissects the operational DNA of Teradyne and SkyWater by comparing their revenue distribution and internal dynamics. The goal is to confront their economic moats to reveal which model sustains the strongest competitive advantage today.
Revenue Segmentation: The Strategic Mix
The following visual comparison dissects how Teradyne and SkyWater diversify their income streams and reveals where their primary sector bets lie:
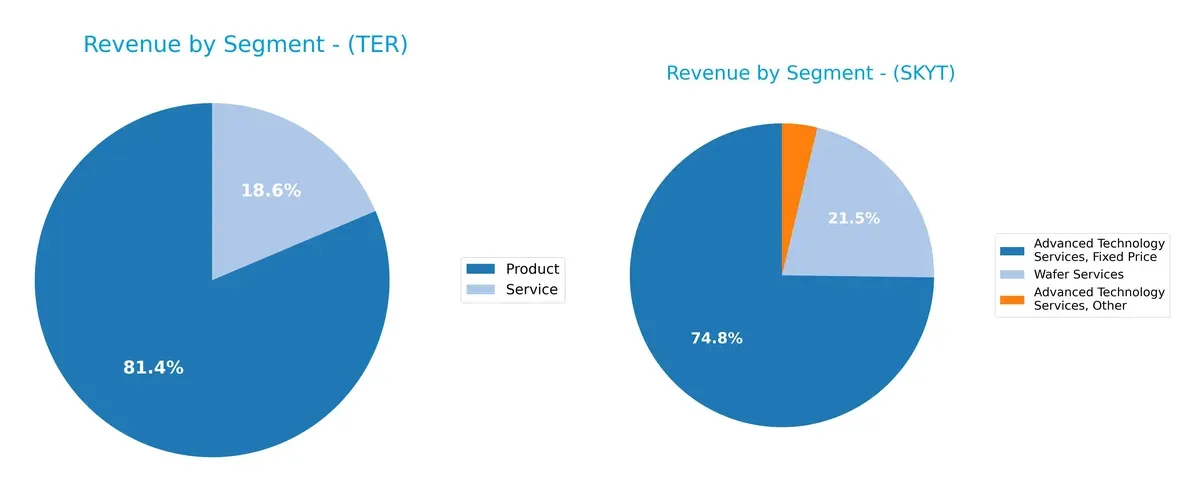
Teradyne leans heavily on its Product segment, generating $2.3B in 2024, dwarfing its Service revenue of $525M. This concentration anchors its strategy in product innovation and market dominance. Conversely, SkyWater spreads revenue across Advanced Technology Services and Wafer Services, with no single segment dominating. This diversified mix reduces concentration risk but indicates a more service-oriented, specialized semiconductor approach. Teradyne’s product focus suggests ecosystem lock-in, while SkyWater pivots on flexible service offerings.
Strengths and Weaknesses Comparison
This table compares the strengths and weaknesses of Teradyne, Inc. and SkyWater Technology, Inc.:
TER Strengths
- Strong profitability with 17.37% net margin and 19.82% ROE
- Conservative debt levels with 0.12 debt-to-equity
- Favorable current and quick ratios above 1.4
- High interest coverage ratio of 81.43
- Diversified revenue from products and services segments
- Broad global presence with significant sales in major Asian and US markets
SKYT Strengths
- Favorable asset turnover at 1.09 reflecting efficient asset use
- Debt-to-assets ratio at 24.46% indicates moderate leverage
- Diversified advanced technology services and wafer services revenue streams
- US market dominates revenue, showing focused geographic presence
TER Weaknesses
- Unfavorable high WACC of 12.35%, exceeding ROIC benchmark
- High valuation multiples with PE of 54.64 and PB of 10.83
- Dividend yield is low at 0.25%
- Neutral asset turnover at 0.76 suggests room for operational improvement
SKYT Weaknesses
- Negative profitability with net margin -1.98% and ROE -11.79%
- Poor liquidity indicated by current ratio 0.86 and quick ratio 0.76
- High debt-to-equity at 1.33 increases financial risk
- Low interest coverage of 0.74 signals potential solvency issues
- No dividend yield and high PB of 11.82
Teradyne demonstrates robust profitability and financial stability but carries valuation and cost of capital concerns. SkyWater struggles with profitability and liquidity, highlighting financial vulnerability despite some operational efficiency. Both companies’ profiles suggest distinct strategic priorities to address their weaknesses.
The Moat Duel: Analyzing Competitive Defensibility
A structural moat is the sole shield protecting long-term profits from relentless competition erosion. Let’s dissect the moats of Teradyne and SkyWater:
Teradyne, Inc.: Diversified Technology Moat through Intangible Assets
Teradyne’s competitive edge stems from its intangible assets in automated test platforms, reflected in robust 20.5% EBIT margins and stable gross margins near 58.5%. In 2026, expansion into industrial automation and wireless testing could deepen this moat despite a declining ROIC trend.
SkyWater Technology, Inc.: Emerging Niche Moat via Specialized Manufacturing
SkyWater relies on specialized semiconductor manufacturing services, contrasting Teradyne’s broader portfolio. Though currently shedding value with a negative ROIC vs. WACC, its strong revenue growth and improving profitability signal a maturing moat and potential for market disruption in custom silicon production.
The Moat Battle: Intangible Assets vs. Specialized Manufacturing
Teradyne commands a wider moat with consistent profitability and scale, despite recent ROIC decline. SkyWater’s moat is narrower but growing rapidly, positioning it for future value creation. Teradyne remains better equipped to defend market share today.
Which stock offers better returns?
Teradyne, Inc. and SkyWater Technology, Inc. exhibit strong bullish trends over the past year with substantial price gains and increasing trading volumes, highlighting significant investor interest and momentum dynamics.
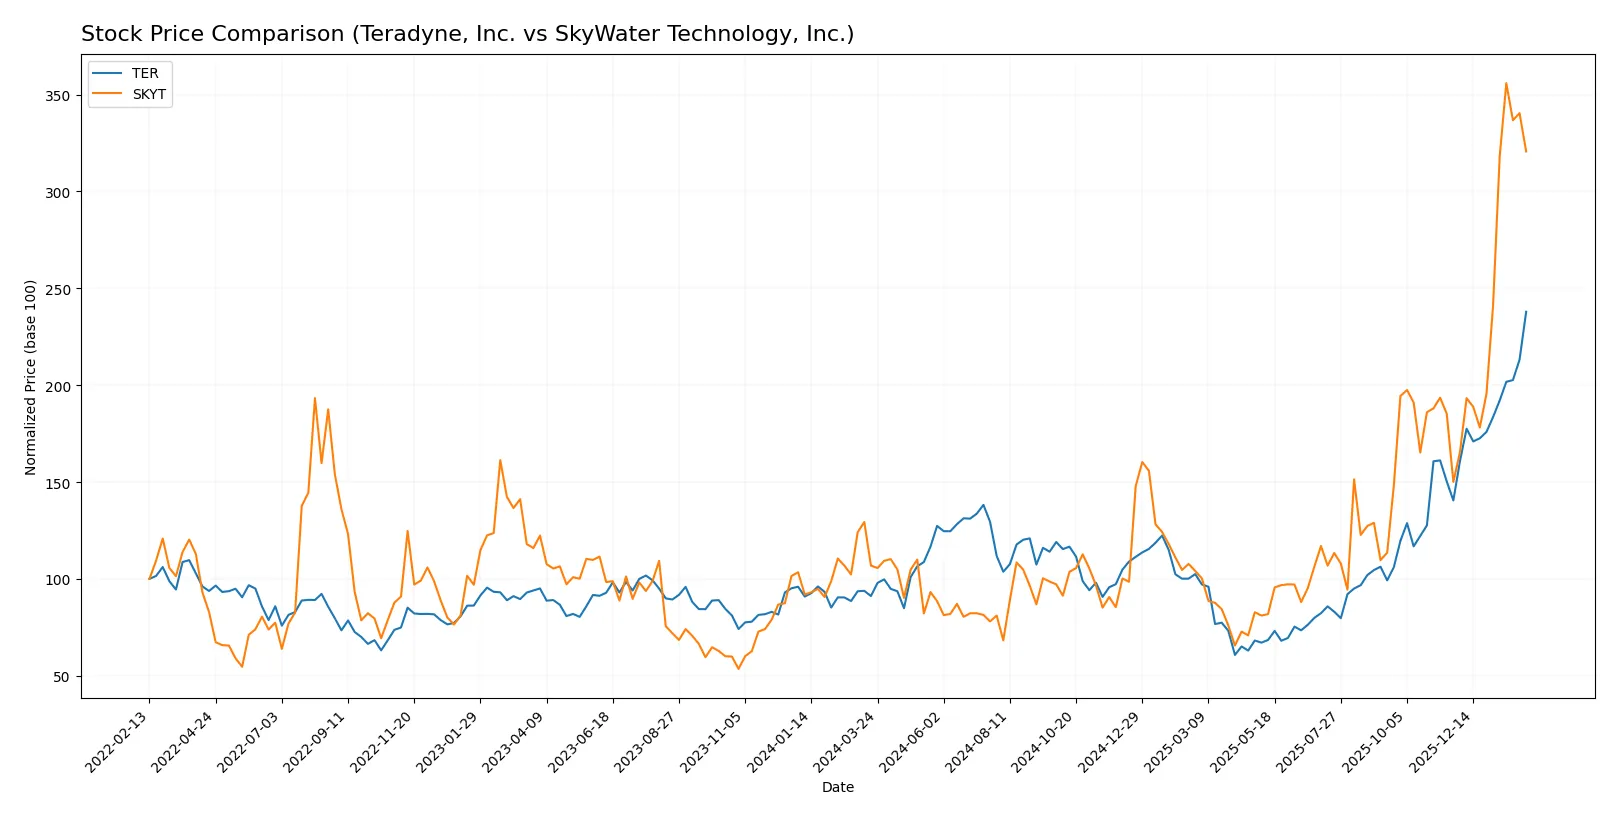
Trend Comparison
Teradyne’s stock rose 161.08% over the past 12 months, showing acceleration and high volatility with a standard deviation of 39.2. The price peaked at 269.07 after starting near 68.72.
SkyWater Technology surged 200% in the same period, also accelerating but with much lower volatility at 5.6. Its price range moved from 6.1 to a high of 33.1.
SkyWater outperformed Teradyne, delivering the highest market performance with a 200% gain versus Teradyne’s 161.08% over the past year.
Target Prices
Analysts present a solid consensus on target prices for Teradyne, Inc. and SkyWater Technology, Inc., reflecting measured optimism.
| Company | Target Low | Target High | Consensus |
|---|---|---|---|
| Teradyne, Inc. | 175 | 335 | 276.08 |
| SkyWater Technology, Inc. | 35 | 35 | 35 |
Teradyne’s consensus target of 276.08 sits slightly above its current price of 269.07, indicating modest upside potential. SkyWater’s target price at 35 surpasses its current 29.82, signaling expectations for meaningful growth.

Don’t Let Luck Decide Your Entry Point
Optimize your entry points with our advanced ProRealTime indicators. You’ll get efficient buy signals with precise price targets for maximum performance. Start outperforming now!
How do institutions grade them?
Teradyne, Inc. Grades
The following table summarizes recent grades assigned to Teradyne, Inc. by major grading companies.
| Grading Company | Action | New Grade | Date |
|---|---|---|---|
| Cantor Fitzgerald | maintain | Overweight | 2026-02-04 |
| Goldman Sachs | maintain | Buy | 2026-02-04 |
| Stifel | maintain | Buy | 2026-02-04 |
| Evercore ISI Group | maintain | Outperform | 2026-02-04 |
| Citigroup | maintain | Buy | 2026-02-04 |
| Evercore ISI Group | maintain | Outperform | 2026-02-03 |
| Cantor Fitzgerald | maintain | Overweight | 2026-02-02 |
| Stifel | maintain | Buy | 2026-01-30 |
| UBS | maintain | Buy | 2026-01-26 |
| B of A Securities | maintain | Buy | 2026-01-22 |
SkyWater Technology, Inc. Grades
The following table shows recent grades assigned to SkyWater Technology, Inc. by leading grading companies.
| Grading Company | Action | New Grade | Date |
|---|---|---|---|
| TD Cowen | downgrade | Hold | 2026-01-27 |
| Piper Sandler | downgrade | Neutral | 2026-01-27 |
| Needham | downgrade | Hold | 2026-01-27 |
| TD Cowen | maintain | Buy | 2025-11-06 |
| Needham | maintain | Buy | 2025-11-06 |
| Piper Sandler | maintain | Overweight | 2025-11-06 |
| Needham | maintain | Buy | 2025-08-07 |
| Needham | maintain | Buy | 2025-05-08 |
| Needham | maintain | Buy | 2025-02-27 |
| Needham | maintain | Buy | 2024-11-11 |
Which company has the best grades?
Teradyne, Inc. consistently receives strong buy and outperform ratings from top firms. SkyWater Technology’s recent downgrades to hold and neutral suggest weaker sentiment. Investors may view Teradyne’s grades as more favorable for potential growth.
Risks specific to each company
The following categories pinpoint critical pressure points and systemic threats facing Teradyne, Inc. and SkyWater Technology, Inc. in the 2026 market environment:
1. Market & Competition
Teradyne, Inc.
- Dominates semiconductor test equipment with diversified segments, but faces stiff competition in automation and wireless testing.
SkyWater Technology, Inc.
- Smaller scale with niche semiconductor manufacturing; high competition from larger foundries limits market share growth.
2. Capital Structure & Debt
Teradyne, Inc.
- Low debt-to-equity (0.12), strong interest coverage (81.43), signaling conservative leverage and financial stability.
SkyWater Technology, Inc.
- High debt-to-equity (1.33) and weak interest coverage (0.74) raise red flags on solvency and refinancing risks.
3. Stock Volatility
Teradyne, Inc.
- Beta of 1.82 indicates higher than market volatility but manageable for large-cap tech stock.
SkyWater Technology, Inc.
- Extremely high beta of 3.51 signals significant price swings, increasing risk for volatility-sensitive investors.
4. Regulatory & Legal
Teradyne, Inc.
- Operates globally; potential exposure to export controls and evolving semiconductor regulations.
SkyWater Technology, Inc.
- Subject to stringent aerospace and defense compliance, increasing regulatory complexity and operational risk.
5. Supply Chain & Operations
Teradyne, Inc.
- Robust manufacturing and diversified supply base reduce disruption risk but depend on semiconductor cycle health.
SkyWater Technology, Inc.
- More vulnerable supply chain due to smaller scale and reliance on specialized materials for rad-hard and mixed-signal chips.
6. ESG & Climate Transition
Teradyne, Inc.
- Larger footprint demands strong ESG measures; progress needed to mitigate environmental impact amid industry scrutiny.
SkyWater Technology, Inc.
- Emerging company with opportunity to integrate ESG from ground up but currently less mature in sustainability practices.
7. Geopolitical Exposure
Teradyne, Inc.
- Global exposure to US-China tensions and supply chain nationalism; diversified end markets provide some buffer.
SkyWater Technology, Inc.
- Concentrated US defense and aerospace contracts heighten risk from shifting government policies and export restrictions.
Which company shows a better risk-adjusted profile?
Teradyne faces its most impactful risk in regulatory and geopolitical pressures but shows a strong balance sheet and moderate volatility. SkyWater’s dominant risk lies in capital structure and stock volatility, reflecting financial fragility and market sensitivity. Teradyne’s robust liquidity, low leverage, and safe Altman Z-score illustrate a better risk-adjusted profile. SkyWater’s grey-zone Z-score and high beta underscore elevated bankruptcy and market risks, warranting caution.
Final Verdict: Which stock to choose?
Teradyne, Inc. (TER) shines as a cash-generating powerhouse with a strong economic moat evidenced by ROIC comfortably topping its cost of capital. Its disciplined capital allocation and robust balance sheet underpin sustainable value creation. A point of vigilance remains its declining ROIC trend, hinting at potential margin pressure ahead. TER fits well in an Aggressive Growth portfolio seeking quality with scale.
SkyWater Technology, Inc. (SKYT) presents a compelling turnaround story with a growing ROIC and accelerating profitability, supported by strategic investments in niche semiconductor manufacturing. Its moat lies in its improving operational leverage and innovation pipeline. Compared to TER, SKYT carries higher financial risk but offers a growth-at-a-reasonable-price profile attractive to investors with higher risk tolerance.
If you prioritize proven value creation and financial strength, Teradyne outshines with better stability and efficient capital use. However, if you seek early-stage growth coupled with operational improvement, SkyWater offers superior upside potential despite elevated risk. Ultimately, the choice hinges on your appetite for risk and portfolio role—blue-chip growth versus speculative growth.
Disclaimer: Investment carries a risk of loss of initial capital. The past performance is not a reliable indicator of future results. Be sure to understand risks before making an investment decision.
Go Further
I encourage you to read the complete analyses of Teradyne, Inc. and SkyWater Technology, Inc. to enhance your investment decisions: