Home > Comparison > Technology > SWKS vs SKYT
The strategic rivalry between Skyworks Solutions, Inc. and SkyWater Technology, Inc. shapes the semiconductor industry’s evolution. Skyworks operates as a market-leading semiconductor product designer with a broad portfolio, while SkyWater focuses on semiconductor development and manufacturing services. This analysis pits Skyworks’ integrated product leadership against SkyWater’s specialized manufacturing model. I will evaluate which company offers a superior risk-adjusted return potential for diversified portfolios amid ongoing sector innovation.
Table of contents
Companies Overview
Skyworks Solutions and SkyWater Technology stand as influential players in the semiconductor industry with distinct market roles.
Skyworks Solutions, Inc.: Semiconductor Innovator with a Broad Product Portfolio
Skyworks Solutions dominates as a semiconductor manufacturer specializing in proprietary analog and mixed-signal chips. Its revenue relies on sales across diverse sectors including aerospace, automotive, and smartphones. In 2026, it focuses on expanding its front-end modules and wireless system components to capture growth in connected and mobile devices worldwide.
SkyWater Technology, Inc.: Specialty Semiconductor Manufacturer and Service Provider
SkyWater Technology operates as a semiconductor foundry offering development and manufacturing services for analog, rad-hard, and power discrete chips. Its revenue is driven by engineering partnerships and manufacturing contracts. The firm’s 2026 strategy emphasizes co-creating technologies with customers to advance custom silicon solutions in aerospace, defense, and IoT markets.
Strategic Collision: Similarities & Divergences
Skyworks pursues a product-driven model with a broad proprietary portfolio, while SkyWater embraces a service-oriented foundry approach focused on customer collaboration. The primary competitive battleground lies in serving specialized semiconductor needs for high-growth technology sectors. Their distinct business models create contrasting investment profiles: one leverages product innovation and scale, the other depends on bespoke manufacturing agility.
Income Statement Comparison
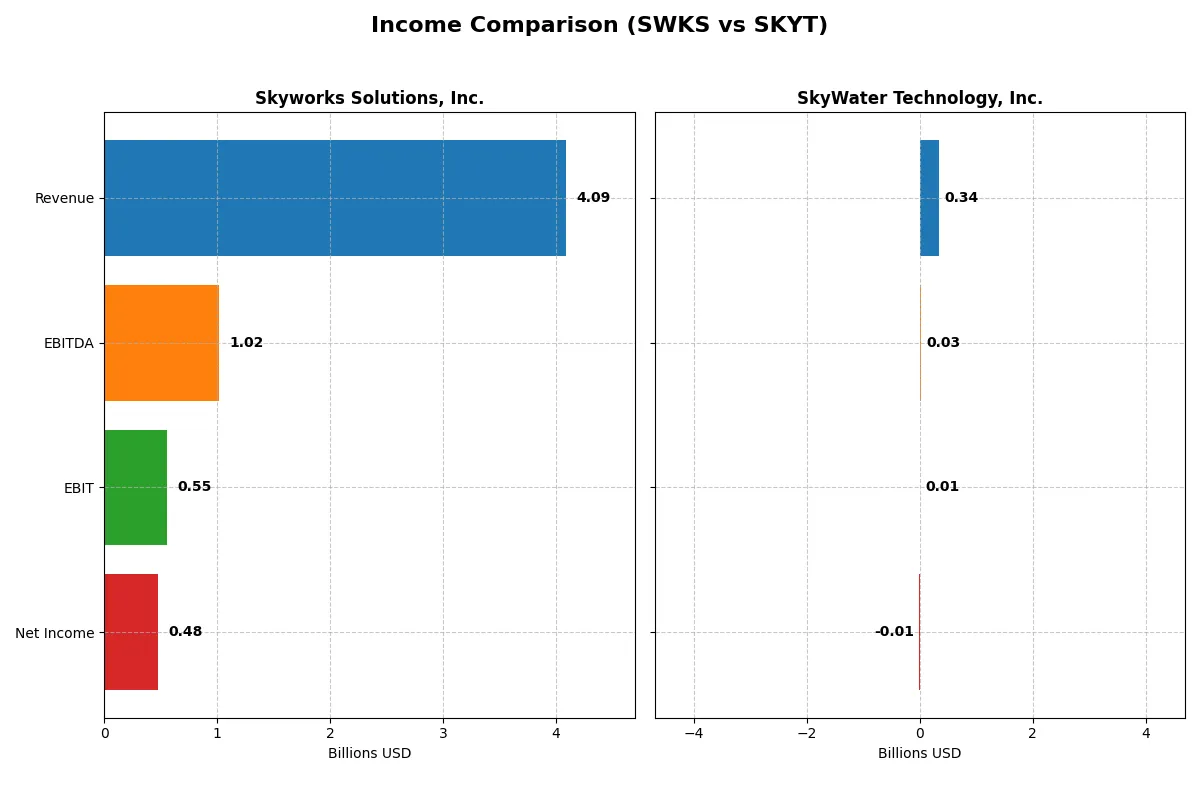
This data dissects the core profitability and scalability of both corporate engines to reveal who dominates the bottom line:
| Metric | Skyworks Solutions, Inc. (SWKS) | SkyWater Technology, Inc. (SKYT) |
|---|---|---|
| Revenue | 4.09B | 342M |
| Cost of Revenue | 2.40B | 273M |
| Operating Expenses | 1.18B | 63M |
| Gross Profit | 1.68B | 70M |
| EBITDA | 1.02B | 25M |
| EBIT | 554M | 7M |
| Interest Expense | 27M | 9M |
| Net Income | 477M | -7M |
| EPS | 3.09 | -0.14 |
| Fiscal Year | 2025 | 2024 |
Income Statement Analysis: The Bottom-Line Duel
This comparison exposes the true operational efficiency and profitability momentum of two distinct corporate engines over recent years.
Skyworks Solutions, Inc. Analysis
Skyworks Solutions’ revenue declined by 2.18% in the latest year, falling to $4.09B, while net income dropped 18.17% to $477M. Despite this, the firm maintains a strong gross margin of 41.16% and a net margin of 11.67%, reflecting solid cost control and profitability. However, both revenue and net income have trended downward over five years, indicating waning momentum.
SkyWater Technology, Inc. Analysis
SkyWater Technology’s revenue surged 19.39% to $342M in 2024, with net income losses narrowing to $-6.8M, showing marked improvement. Gross margin stands at 20.34%, with a modest EBIT margin of 1.92%. The company exhibits robust growth trajectories, including 144% EBIT growth and 81.5% net margin improvement year-over-year, signaling rapid operational scaling and improving efficiency.
Established Profitability vs. Emerging Growth
Skyworks Solutions leads in scale and profitability with superior margins and positive net income. Conversely, SkyWater Technology shows strong growth momentum and margin improvement from a smaller base, though it remains unprofitable. Investors focused on stable earnings may prefer Skyworks, while those eyeing growth potential might consider SkyWater’s accelerating turnaround.
Financial Ratios Comparison
These vital ratios act as a diagnostic tool to expose the underlying fiscal health, valuation premiums, and capital efficiency of the companies compared below:
| Ratios | Skyworks Solutions, Inc. (SWKS) | SkyWater Technology, Inc. (SKYT) |
|---|---|---|
| ROE | 8.3% | -11.8% |
| ROIC | 6.4% | 3.4% |
| P/E | 25.0 | -100.3 |
| P/B | 2.07 | 11.82 |
| Current Ratio | 2.33 | 0.86 |
| Quick Ratio | 1.76 | 0.76 |
| D/E | 0.21 | 1.33 |
| Debt-to-Assets | 15.2% | 24.5% |
| Interest Coverage | 18.5 | 0.74 |
| Asset Turnover | 0.52 | 1.09 |
| Fixed Asset Turnover | 2.95 | 2.07 |
| Payout ratio | 90.7% | 0% |
| Dividend yield | 3.63% | 0% |
| Fiscal Year | 2025 | 2024 |
Efficiency & Valuation Duel: The Vital Signs
Financial ratios act as a company’s DNA, revealing hidden risks and operational excellence that numbers alone cannot capture.
Skyworks Solutions, Inc.
Skyworks shows a solid net margin of 11.67% but a modest ROE of 8.29%, reflecting moderate profitability. Its P/E of 24.95 and P/B of 2.07 indicate a fairly valued stock, neither cheap nor expensive. The 3.63% dividend yield signals steady shareholder returns, complementing reinvestments in R&D at nearly 19% of revenue.
SkyWater Technology, Inc.
SkyWater posts negative profitability with a -1.98% net margin and a deeply negative ROE of -11.79%. Its P/E ratio is negative but distorted by losses, while a high P/B of 11.82 signals an expensive valuation relative to book value. The absence of dividends highlights a focus on growth, but weak liquidity and high debt raise red flags.
Operational Strength vs. Financial Fragility
Skyworks offers a balanced profile with decent profitability and shareholder returns at a reasonable valuation. SkyWater struggles with losses, stretched valuation, and liquidity issues. Investors seeking operational stability may prefer Skyworks, while those with higher risk tolerance might view SkyWater as a speculative growth play.
Which one offers the Superior Shareholder Reward?
I analyze Skyworks Solutions, Inc. (SWKS) and SkyWater Technology, Inc. (SKYT) through their dividend yields, payout ratios, and share buybacks. SWKS pays a solid 3.63% dividend yield with a high payout ratio near 91%, backed by strong free cash flow coverage (2.07x), signaling sustainable income returns. SWKS also runs consistent buybacks, enhancing total shareholder return. In contrast, SKYT pays no dividends and posts negative net margins, reflecting losses and weak cash flow. Its share buyback activity is negligible, and leverage is high (debt/equity >1.3), stressing financial risk. Historically, I’ve observed that companies like SWKS with robust free cash flow and disciplined capital allocation outperform peers in total returns. Thus, SWKS offers a far superior, more sustainable shareholder reward in 2026.
Comparative Score Analysis: The Strategic Profile
The radar chart reveals the fundamental DNA and trade-offs of Skyworks Solutions and SkyWater Technology, highlighting their distinct financial strengths and vulnerabilities:
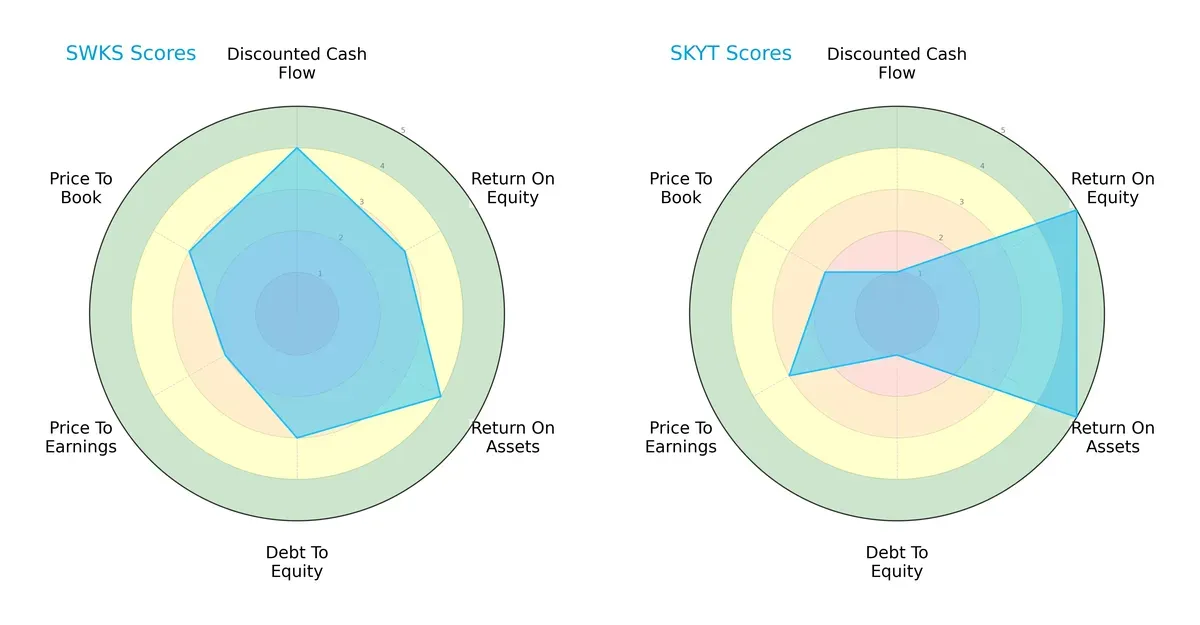
Skyworks Solutions displays a balanced profile with strong DCF (4) and ROA (4) scores and moderate debt management (3). SkyWater Technology excels in profitability metrics, scoring very high in ROE (5) and ROA (5), but shows financial leverage risk with a weak debt-to-equity score (1). Skyworks leans on steady cash flow and moderate valuation, while SkyWater relies on superior asset efficiency but carries more financial risk.
Bankruptcy Risk: Solvency Showdown
Skyworks Solutions’ Altman Z-Score of 4.34 places it securely in the safe zone, while SkyWater Technology’s 2.35 falls into the grey zone, indicating moderate bankruptcy risk:
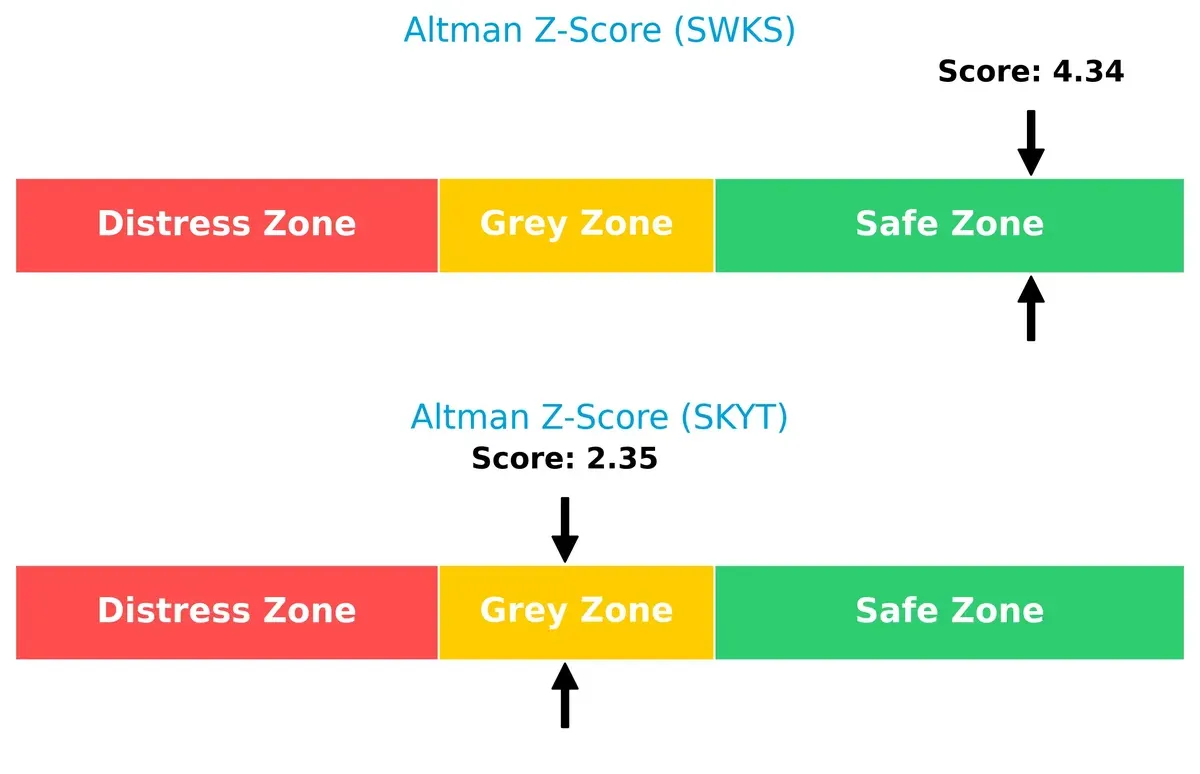
Skyworks demonstrates robust financial stability, reducing default probability. SkyWater’s score suggests caution, as it faces increased risk amid volatile market cycles.
Financial Health: Quality of Operations
Skyworks Solutions scores a strong 7 on the Piotroski F-Score, signaling solid operational health. SkyWater Technology’s 5 reflects average financial quality, with potential internal red flags:
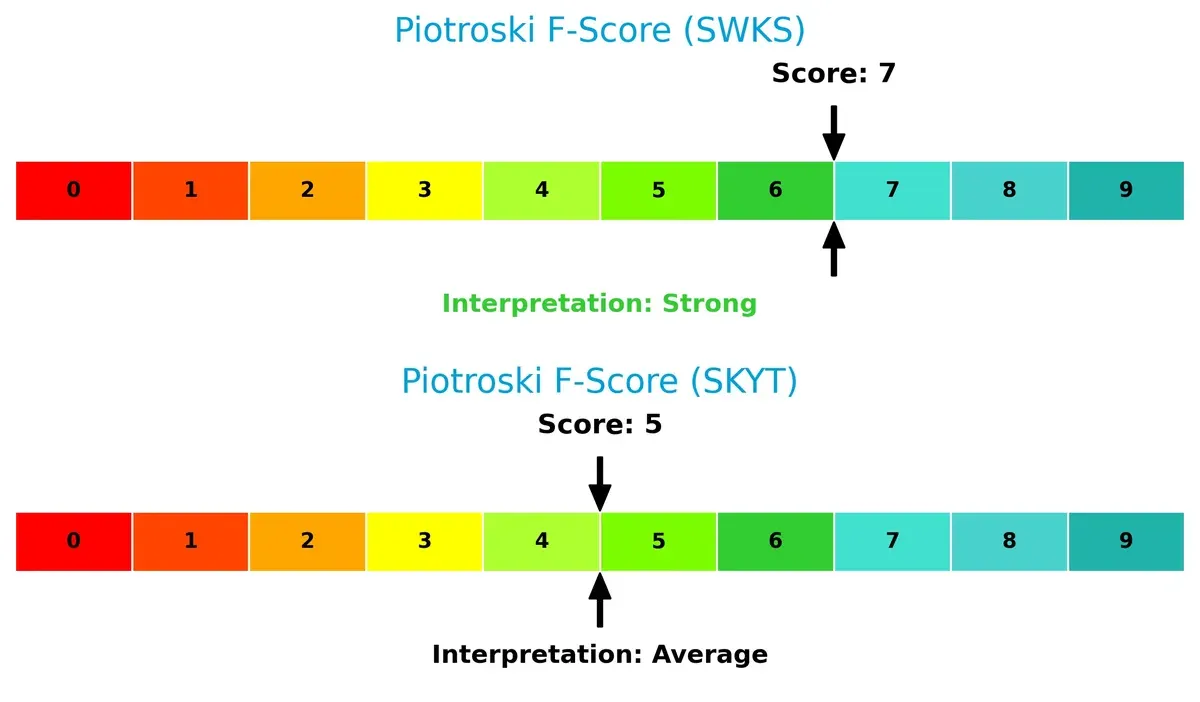
Skyworks exhibits stronger profitability, liquidity, and efficiency metrics. SkyWater’s middling score flags areas for improvement in operational execution and financial discipline.
How are the two companies positioned?
This section dissects the operational DNA of Skyworks Solutions and SkyWater Technology by comparing their revenue distribution and internal dynamics. The final goal is to confront their economic moats to reveal which model delivers the most resilient, sustainable competitive advantage today.
Revenue Segmentation: The Strategic Mix
This visual comparison dissects how Skyworks Solutions and SkyWater Technology diversify their income streams and reveals their primary sector bets:
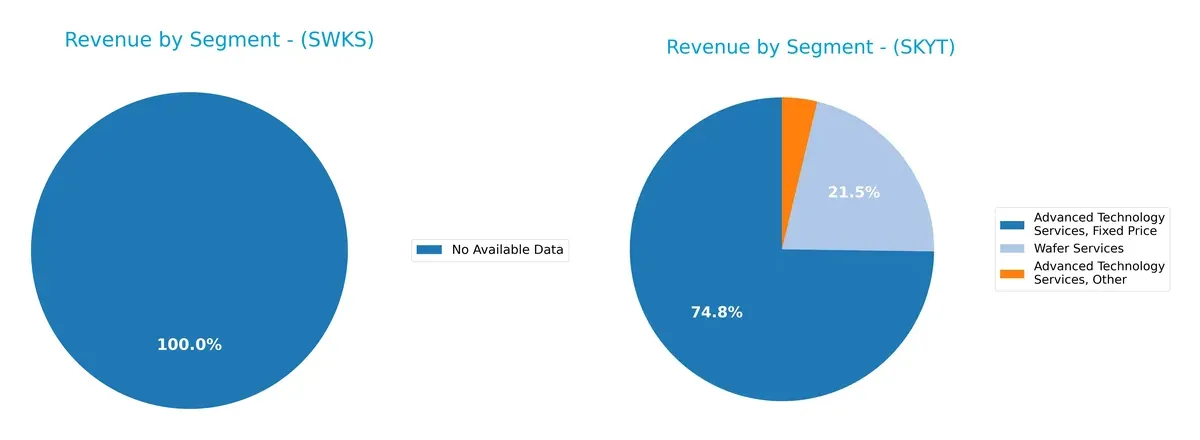
SkyWater Technology leans heavily on Advanced Technology Services, generating roughly $93M in fixed price and $122M in time/materials for 2024, overshadowing its $27M wafer services. In contrast, Skyworks Solutions lacks available data, preventing a direct comparison. SkyWater’s reliance on advanced services signals a strategic focus on specialized, high-value contracts, which anchors its revenue but introduces concentration risk without broader diversification.
Strengths and Weaknesses Comparison
This table compares the Strengths and Weaknesses of Skyworks Solutions, Inc. and SkyWater Technology, Inc.:
Skyworks Strengths
- Favorable net margin at 11.67%
- Strong liquidity with current ratio 2.33
- Low debt-to-equity 0.21
- Favorable dividend yield 3.63%
- Broad global presence including US, China, Taiwan
- Consistent asset turnover ratios
SkyWater Strengths
- Favorable asset turnover at 1.09
- Favorable debt-to-assets ratio 24.46%
- Product diversification in Advanced Technology and Wafer Services
- Growing US revenue base
Skyworks Weaknesses
- Unfavorable return on equity at 8.29% below WACC
- Neutral ROIC versus WACC at 6.35%
- Moderate PE 24.95 and PB 2.07
- Neutral fixed asset turnover
- Regional dependence on US market
SkyWater Weaknesses
- Negative net margin -1.98%
- Negative ROE -11.79%
- ROIC 3.4% below WACC 19.95%
- Poor liquidity with current ratio 0.86
- High debt-to-equity 1.33
- No dividend yield
- Unfavorable interest coverage 0.74
Skyworks demonstrates solid financial health, strong global reach, and dividend support, but faces challenges in equity returns. SkyWater shows product diversification and improving asset use but struggles with profitability, liquidity, and leverage. These factors shape each company’s strategic focus on financial stability versus operational growth.
The Moat Duel: Analyzing Competitive Defensibility
A structural moat is the only thing protecting long-term profits from the erosion of competition. Let’s dissect the competitive barriers of two semiconductor players:
Skyworks Solutions, Inc. (SWKS): Intangible Assets and Market Reach
Skyworks leverages proprietary semiconductor IP and large U.S. market exposure, supporting solid margins near 41%. However, declining ROIC and shrinking profits signal its moat is weakening in 2026.
SkyWater Technology, Inc. (SKYT): Emerging Operational Efficiency
SkyWater’s competitive edge lies in growing ROIC and manufacturing services expansion, posting rapid revenue growth. Yet, its net margin remains negative, reflecting ongoing scale challenges compared to Skyworks.
Intangible Assets vs. Operational Momentum
Skyworks holds a wider moat with entrenched IP and market reach, but its declining profitability threatens future defense. SkyWater’s improving ROIC hints at a deepening moat, yet it remains less equipped to defend market share today.
Which stock offers better returns?
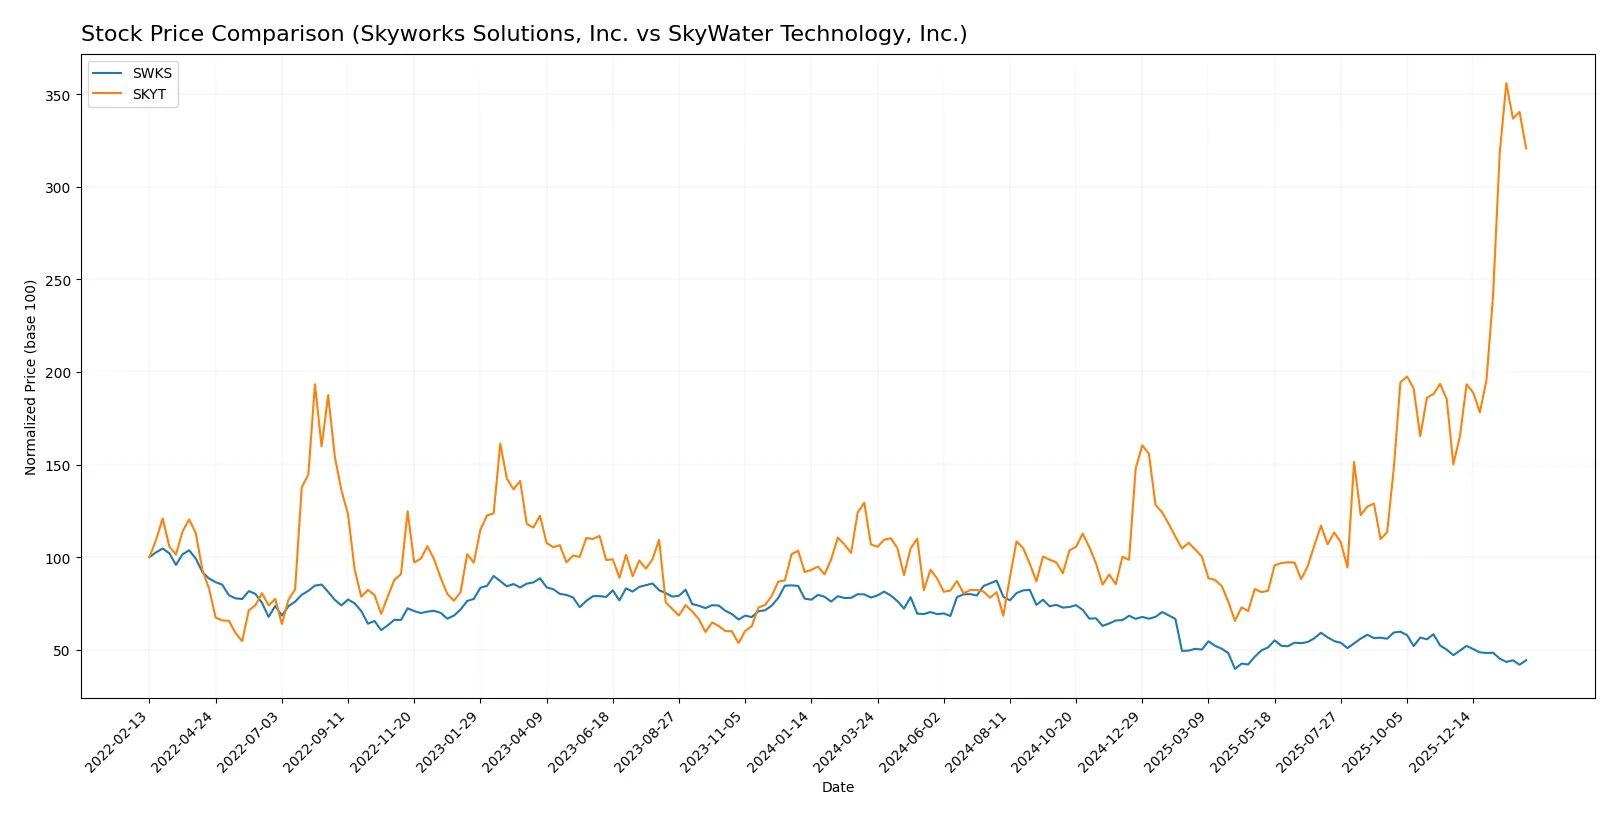
Over the past year, Skyworks Solutions, Inc. experienced a sharp price decline with decelerating losses, while SkyWater Technology, Inc. showed a strong upward momentum with accelerating gains.
Trend Comparison
Skyworks Solutions, Inc. revealed a 43.31% price drop over 12 months, marking a bearish trend with decelerating losses and notable volatility (16.49 std deviation). SkyWater Technology, Inc. posted a 200% gain in the same period, reflecting a bullish trend with accelerating momentum and moderate volatility (5.6 std deviation). SkyWater Technology outperformed Skyworks Solutions by a wide margin, delivering the highest market returns in the analyzed year.
Target Prices
Analysts present a cautious but varied outlook on Skyworks Solutions and SkyWater Technology.
| Company | Target Low | Target High | Consensus |
|---|---|---|---|
| Skyworks Solutions, Inc. | 58 | 140 | 77.36 |
| SkyWater Technology, Inc. | 35 | 35 | 35 |
Skyworks Solutions’ consensus target of 77.36 suggests upside from the current 59, reflecting mixed analyst confidence. SkyWater Technology’s fixed target at 35 implies potential growth from its 29.82 price, albeit with higher volatility risk.

Don’t Let Luck Decide Your Entry Point
Optimize your entry points with our advanced ProRealTime indicators. You’ll get efficient buy signals with precise price targets for maximum performance. Start outperforming now!
How do institutions grade them?
This section compares the recent grades assigned to Skyworks Solutions, Inc. and SkyWater Technology, Inc. by major financial institutions:
Skyworks Solutions, Inc. Grades
Below is a summary of the latest grades from established financial graders for Skyworks Solutions, Inc.:
| Grading Company | Action | New Grade | Date |
|---|---|---|---|
| Citigroup | Maintain | Neutral | 2026-02-04 |
| Stifel | Maintain | Hold | 2026-02-04 |
| Benchmark | Maintain | Hold | 2026-02-04 |
| Keybanc | Maintain | Overweight | 2026-02-04 |
| JP Morgan | Maintain | Neutral | 2026-02-04 |
| Morgan Stanley | Maintain | Equal Weight | 2026-02-02 |
| B. Riley Securities | Maintain | Neutral | 2026-01-26 |
| Mizuho | Maintain | Neutral | 2026-01-26 |
| Susquehanna | Maintain | Neutral | 2026-01-22 |
| UBS | Maintain | Neutral | 2026-01-20 |
SkyWater Technology, Inc. Grades
The table below lists recent grades from reputable grading firms for SkyWater Technology, Inc.:
| Grading Company | Action | New Grade | Date |
|---|---|---|---|
| TD Cowen | Downgrade | Hold | 2026-01-27 |
| Piper Sandler | Downgrade | Neutral | 2026-01-27 |
| Needham | Downgrade | Hold | 2026-01-27 |
| TD Cowen | Maintain | Buy | 2025-11-06 |
| Needham | Maintain | Buy | 2025-11-06 |
| Piper Sandler | Maintain | Overweight | 2025-11-06 |
| Needham | Maintain | Buy | 2025-08-07 |
| Needham | Maintain | Buy | 2025-05-08 |
| Needham | Maintain | Buy | 2025-02-27 |
| Needham | Maintain | Buy | 2024-11-11 |
Which company has the best grades?
Skyworks Solutions, Inc. holds consistent Neutral to Overweight grades, reflecting a stable outlook. SkyWater Technology, Inc. experienced recent downgrades from Buy/Overweight to Hold/Neutral, indicating increased caution. Investors might interpret Skyworks as a more steady option based on current grading trends.
Risks specific to each company
The following categories identify critical pressure points and systemic threats facing Skyworks Solutions, Inc. and SkyWater Technology, Inc. in the 2026 market environment:
1. Market & Competition
Skyworks Solutions, Inc.
- Established player with broad semiconductor product portfolio and global market reach.
SkyWater Technology, Inc.
- Smaller, newer entrant focused on niche semiconductor manufacturing services with limited scale.
2. Capital Structure & Debt
Skyworks Solutions, Inc.
- Low debt-to-equity ratio (0.21) signals strong balance sheet and manageable leverage.
SkyWater Technology, Inc.
- High debt-to-equity (1.33) raises financial risk and pressure on cash flow.
3. Stock Volatility
Skyworks Solutions, Inc.
- Moderate beta of 1.317 implies average market sensitivity and volatility.
SkyWater Technology, Inc.
- High beta of 3.513 indicates significant stock price swings and investor risk.
4. Regulatory & Legal
Skyworks Solutions, Inc.
- Operating globally exposes it to complex regulatory regimes and trade policies.
SkyWater Technology, Inc.
- Primarily US-based but in aerospace/defense sectors with strict compliance requirements.
5. Supply Chain & Operations
Skyworks Solutions, Inc.
- Extensive manufacturing and distribution network enhances supply chain resilience.
SkyWater Technology, Inc.
- Smaller scale and reliance on specialized manufacturing increase operational risk.
6. ESG & Climate Transition
Skyworks Solutions, Inc.
- Larger firm likely faces greater ESG scrutiny and must invest in sustainable practices.
SkyWater Technology, Inc.
- Emerging company with opportunity to embed ESG standards early but limited disclosure.
7. Geopolitical Exposure
Skyworks Solutions, Inc.
- Significant exposure to Asia-Pacific markets subjects it to geopolitical tensions and tariffs.
SkyWater Technology, Inc.
- Less international exposure reduces geopolitical risk but limits global growth.
Which company shows a better risk-adjusted profile?
Skyworks Solutions faces competitive and geopolitical pressures but maintains a strong balance sheet and moderate volatility. SkyWater struggles with high leverage, volatile stock, and operational risks. Skyworks’ Altman Z-score of 4.34 and Piotroski score of 7 signal robust financial health, while SkyWater’s scores place it in a grey zone with average financial strength. I view Skyworks Solutions as the safer, more balanced investment. Its favorable interest coverage ratio (20.44) contrasts sharply with SkyWater’s weak 0.74, underscoring its superior risk management.
Final Verdict: Which stock to choose?
Skyworks Solutions, Inc. (SWKS) demonstrates an enduring cash-generation ability, underpinned by a solid balance sheet and favorable liquidity ratios. Its main point of vigilance remains the declining profitability trend, which signals caution for investors seeking rapid growth. This stock suits portfolios focused on Stable Income and Moderate Growth.
SkyWater Technology, Inc. (SKYT) offers an intriguing growth trajectory, fueled by expanding revenues and improving profitability metrics. Its emerging strategic moat lies in operational efficiency gains and innovation capacity, albeit with higher financial risk and weaker liquidity than SWKS. SKYT fits well in Growth at a Reasonable Price (GARP) portfolios willing to tolerate volatility.
If you prioritize reliable cash flow and financial stability, Skyworks outshines due to its robust capital structure and dividend yield. However, if you seek faster growth potential and can accept elevated risk, SkyWater offers better upside with a trajectory of improving returns. Both present distinct analytical scenarios tailored to differing risk appetites and investment horizons.
Disclaimer: Investment carries a risk of loss of initial capital. The past performance is not a reliable indicator of future results. Be sure to understand risks before making an investment decision.
Go Further
I encourage you to read the complete analyses of Skyworks Solutions, Inc. and SkyWater Technology, Inc. to enhance your investment decisions: