In the fast-evolving semiconductor industry, Tower Semiconductor Ltd. (TSEM) and Silicon Laboratories Inc. (SLAB) stand out for their innovative approaches and market presence. Tower operates as an independent foundry with diverse process technologies, while Silicon Labs focuses on fabless mixed-signal solutions, particularly for IoT applications. Comparing these companies reveals distinct strategies in technology and market focus. This article will help you decide which is the more compelling investment opportunity.
Table of contents
Companies Overview
I will begin the comparison between Tower Semiconductor Ltd. and Silicon Laboratories Inc. by providing an overview of these two companies and their main differences.
Tower Semiconductor Ltd. Overview
Tower Semiconductor Ltd. is an independent semiconductor foundry specializing in analog intensive mixed-signal semiconductor devices. The company offers customizable process technologies such as SiGe, BiCMOS, RF CMOS, and MEMS, serving diverse markets including automotive, aerospace, and medical devices. Headquartered in Israel, Tower Semiconductor operates wafer fabrication services and design enablement platforms, positioning itself as a key player in semiconductor manufacturing since 1993.
Silicon Laboratories Inc. Overview
Silicon Laboratories Inc. is a fabless semiconductor company focusing on analog-intensive mixed-signal solutions, including wireless microcontrollers and sensor products. The company targets IoT applications like connected home, industrial automation, and medical instrumentation. Founded in 1996 and based in Austin, Texas, Silicon Labs sells its products globally through direct sales and distribution networks, emphasizing innovation in wireless and sensor technology.
Key similarities and differences
Both companies operate in the semiconductor industry with a focus on analog-intensive mixed-signal technologies. Tower Semiconductor is a foundry providing wafer fabrication and customizable processes, while Silicon Labs is fabless, concentrating on product design and IoT-related applications. Tower’s markets include automotive and aerospace, whereas Silicon Labs targets IoT and smart device sectors. Their business models differ mainly in manufacturing ownership and market focus.
Income Statement Comparison
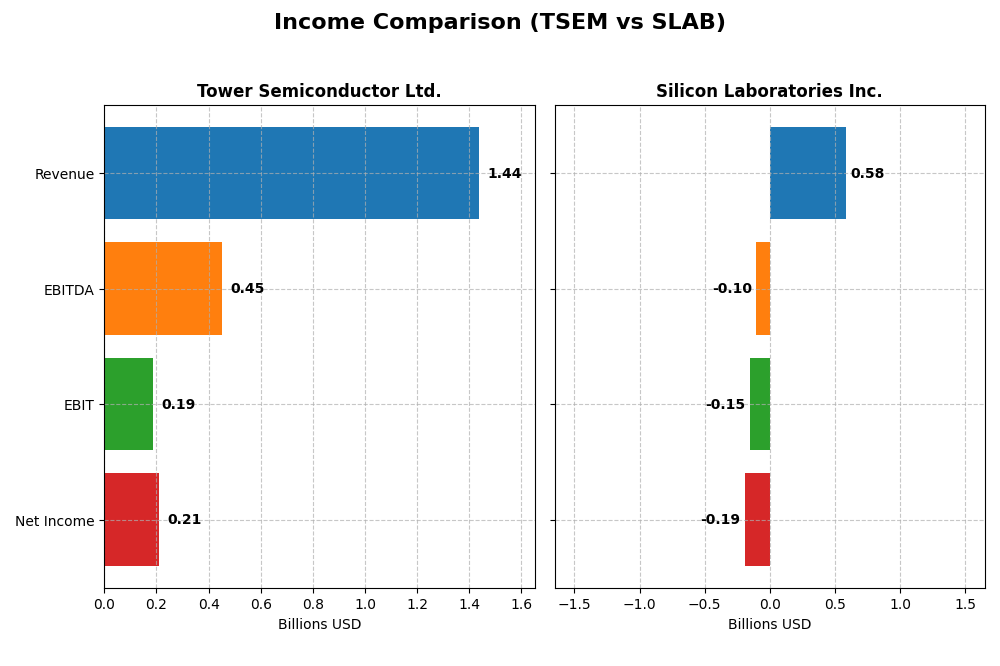
The table below compares the key income statement metrics for Tower Semiconductor Ltd. and Silicon Laboratories Inc. based on their most recent fiscal year results.
| Metric | Tower Semiconductor Ltd. (TSEM) | Silicon Laboratories Inc. (SLAB) |
|---|---|---|
| Market Cap | 13.9B USD | 5.0B USD |
| Revenue | 1.44B USD | 584M USD |
| EBITDA | 451M USD | -105M USD |
| EBIT | 185M USD | -154M USD |
| Net Income | 208M USD | -191M USD |
| EPS | 1.87 USD | -5.93 USD |
| Fiscal Year | 2024 | 2024 |
Income Statement Interpretations
Tower Semiconductor Ltd.
Tower Semiconductor’s revenue showed moderate growth of 0.94% in 2024, continuing a favorable overall increase of 13.47% since 2020. Net income rose significantly over the period, with a 152.56% gain, but reversed in 2024 with a 60.29% net margin decline. Despite this, gross and EBIT margins remain favorable, indicating solid profitability, though recent earnings slowed.
Silicon Laboratories Inc.
Silicon Laboratories experienced a 25.29% revenue decline in 2024 after earlier gains totaling 14.38% since 2020. Net income suffered a steep drop, with a negative margin and EPS growth over both the year and overall period. Although the gross margin stays strong at 53.42%, EBIT and net margins are unfavorable, reflecting operational challenges and weaker profitability in the latest year.
Which one has the stronger fundamentals?
Tower Semiconductor exhibits stronger fundamentals with favorable gross, EBIT, and net margins, alongside positive long-term revenue and net income growth. Silicon Laboratories shows a solid gross margin but faces significant declines in profitability and earnings, resulting in an overall unfavorable income statement evaluation. Thus, Tower Semiconductor demonstrates more consistent and robust income statement performance.
Financial Ratios Comparison
The table below presents a side-by-side comparison of key financial ratios for Tower Semiconductor Ltd. (TSEM) and Silicon Laboratories Inc. (SLAB) based on the most recent fiscal year data available.
| Ratios | Tower Semiconductor Ltd. (TSEM) | Silicon Laboratories Inc. (SLAB) |
|---|---|---|
| ROE | 7.8% | -17.7% |
| ROIC | 6.4% | -14.7% |
| P/E | 27.5 | -21.5 |
| P/B | 2.16 | 3.81 |
| Current Ratio | 6.18 | 6.15 |
| Quick Ratio | 5.23 | 5.07 |
| D/E (Debt-to-Equity) | 0.068 | 0.014 |
| Debt-to-Assets | 5.9% | 1.3% |
| Interest Coverage | 32.6 | -126.3 |
| Asset Turnover | 0.47 | 0.48 |
| Fixed Asset Turnover | 1.11 | 4.42 |
| Payout Ratio | 0 | 0 |
| Dividend Yield | 0% | 0% |
Interpretation of the Ratios
Tower Semiconductor Ltd.
Tower Semiconductor shows a mix of strong and weak ratios. Its net margin of 14.47% and low debt levels are favorable, while a low ROE of 7.83% and high P/E of 27.54 raise concerns. The current ratio is unusually high at 6.18, suggesting possible inefficiency. The company does not pay dividends, which may reflect reinvestment in growth or operational needs.
Silicon Laboratories Inc.
Silicon Laboratories has predominantly unfavorable ratios with a negative net margin of -32.69% and negative ROE at -17.69%, indicating profitability challenges. The company’s P/E is negative but considered favorable due to losses. Its low debt and strong asset turnover contrast with poor interest coverage and zero dividend payout, likely due to sustained losses and focus on R&D.
Which one has the best ratios?
Tower Semiconductor displays a slightly favorable profile with balanced profitability and conservative debt, despite some inefficiencies. Silicon Laboratories’ ratios are largely unfavorable, reflecting operational losses and financial stress. Overall, Tower Semiconductor’s financial ratios appear more robust and stable compared to Silicon Laboratories.
Strategic Positioning
This section compares the strategic positioning of Tower Semiconductor Ltd. and Silicon Laboratories Inc., including market position, key segments, and exposure to disruption:
Tower Semiconductor Ltd.
- Independent semiconductor foundry with diversified global presence and moderate competitive pressure
- Serves multiple markets: consumer electronics, automotive, aerospace, medical, and industrial sectors
- Utilizes various customizable process technologies, facing typical semiconductor technological challenges
Silicon Laboratories Inc.
- Fabless semiconductor company focused on analog mixed-signal solutions amid high competitive pressure
- Focus on IoT and industrial applications including smart metering, automation, and connected home
- Faces disruption risks from rapid innovation in IoT and wireless microcontroller technologies
Tower Semiconductor Ltd. vs Silicon Laboratories Inc. Positioning
Tower Semiconductor pursues a diversified market strategy across multiple industries with broad technology offerings, while Silicon Laboratories concentrates on analog mixed-signal solutions for IoT and industrial sectors. Tower’s approach offers wider market exposure; Silicon Labs targets niche-driven growth.
Which has the best competitive advantage?
Tower Semiconductor shows slightly unfavorable MOAT with growing profitability, indicating improving value creation. Silicon Laboratories has a very unfavorable MOAT with declining profitability and value destruction, signaling weaker competitive advantage.
Stock Comparison
The stock price chart highlights a pronounced bullish momentum for Tower Semiconductor Ltd. with strong acceleration and increasing buyer dominance, while Silicon Laboratories Inc. shows a more moderate bullish trend amid declining volume and seller dominance.
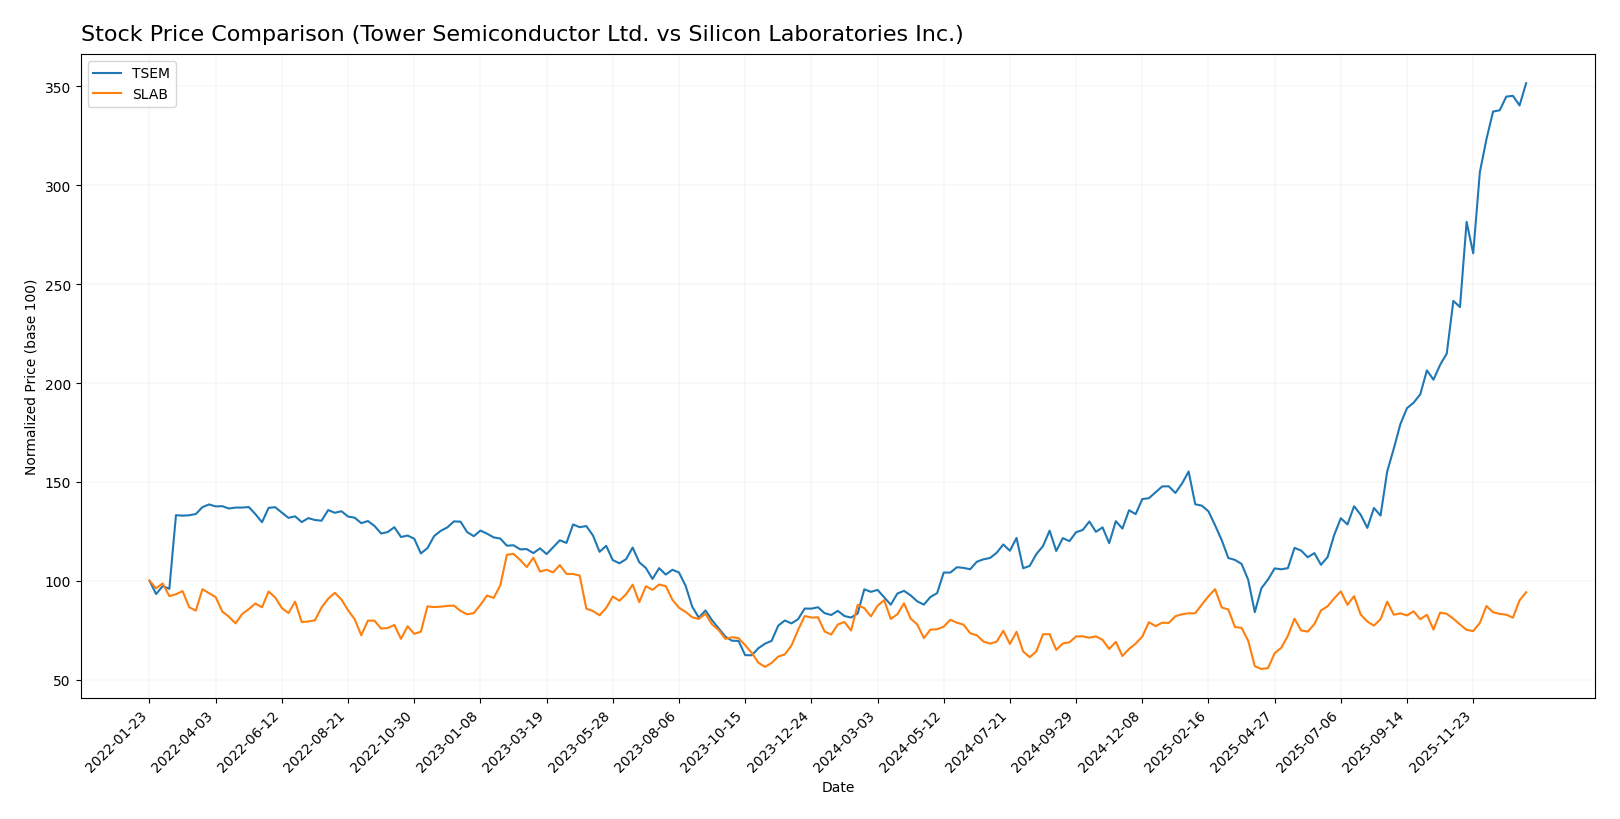
Trend Analysis
Tower Semiconductor Ltd. (TSEM) exhibits a strong bullish trend over the past 12 months with a 273% price increase, accelerating momentum, and high volatility (std deviation 23.67), reaching a high of 124.0. Recent gains remain robust with a 45.6% rise in just over two months.
Silicon Laboratories Inc. (SLAB) also shows a bullish trend with a 14.9% gain over the past year, acceleration in price movement, and moderate volatility (std deviation 14.15), peaking at 155.33. Recent performance improved by 16.6%, but volume trends indicate seller dominance.
Comparatively, TSEM outperformed SLAB significantly in market performance over the past year, delivering substantially higher returns and stronger buyer activity.
Target Prices
Analyst consensus target prices suggest moderate upside potential for these semiconductor companies.
| Company | Target High | Target Low | Consensus |
|---|---|---|---|
| Tower Semiconductor Ltd. | 125 | 66 | 96 |
| Silicon Laboratories Inc. | 165 | 130 | 151.67 |
For Tower Semiconductor Ltd., the consensus target of 96 is slightly below its current price near 124, indicating potential downside or a valuation plateau. Silicon Laboratories Inc. has a consensus target close to its current price of 152.82, reflecting balanced expectations with limited immediate upside.
Analyst Opinions Comparison
This section compares analysts’ ratings and grades for Tower Semiconductor Ltd. (TSEM) and Silicon Laboratories Inc. (SLAB):
Rating Comparison
TSEM Rating
- Rating: B+, classified as Very Favorable by analysts.
- Discounted Cash Flow Score: 3, indicating a moderate valuation based on future cash flows.
- ROE Score: 3, showing moderate efficiency in generating profit from equity.
- ROA Score: 4, representing favorable asset utilization to generate earnings.
- Debt To Equity Score: 4, favorable financial risk profile with lower debt level.
- Overall Score: 3, a moderate overall financial standing.
SLAB Rating
- Rating: C-, also classified as Very Favorable.
- Discounted Cash Flow Score: 2, reflecting a moderate but lower valuation than TSEM.
- ROE Score: 1, indicating very unfavorable efficiency in profit generation from equity.
- ROA Score: 1, indicating very unfavorable asset utilization.
- Debt To Equity Score: 1, indicating very unfavorable financial risk due to high debt.
- Overall Score: 1, indicating a very unfavorable overall financial standing.
Which one is the best rated?
Based strictly on the provided data, Tower Semiconductor Ltd. (TSEM) is better rated overall, with higher scores across most financial metrics including ROA, debt to equity, and overall score, compared to Silicon Laboratories Inc. (SLAB).
Scores Comparison
Here is a comparison of the financial scores for Tower Semiconductor Ltd. and Silicon Laboratories Inc.:
TSEM Scores
- Altman Z-Score: 21.06, indicating a safe zone and very low bankruptcy risk.
- Piotroski Score: 7, classified as strong, showing solid financial health.
SLAB Scores
- Altman Z-Score: 18.02, also in the safe zone with low bankruptcy risk.
- Piotroski Score: 4, considered average, reflecting moderate financial strength.
Which company has the best scores?
Tower Semiconductor Ltd. shows higher scores with a safer Altman Z-Score and a stronger Piotroski Score compared to Silicon Laboratories Inc., which has a lower Piotroski Score indicating average financial strength.
Grades Comparison
Here is the comparison of recent grades assigned to Tower Semiconductor Ltd. and Silicon Laboratories Inc.:
Tower Semiconductor Ltd. Grades
This table summarizes recent grades from reliable grading companies for Tower Semiconductor Ltd.:
| Grading Company | Action | New Grade | Date |
|---|---|---|---|
| Benchmark | Maintain | Buy | 2026-01-09 |
| Wedbush | Downgrade | Neutral | 2025-12-31 |
| Benchmark | Maintain | Buy | 2025-11-11 |
| Susquehanna | Maintain | Positive | 2025-11-11 |
| Wedbush | Maintain | Outperform | 2025-11-11 |
| Barclays | Maintain | Equal Weight | 2025-11-11 |
| Benchmark | Maintain | Buy | 2025-09-08 |
| Susquehanna | Maintain | Positive | 2025-08-05 |
| Benchmark | Maintain | Buy | 2025-08-05 |
| Benchmark | Maintain | Buy | 2025-08-04 |
The overall trend for Tower Semiconductor Ltd. shows predominantly “Buy” and “Positive” grades with occasional neutral ratings, indicating a generally favorable outlook with some caution.
Silicon Laboratories Inc. Grades
This table summarizes recent grades from reliable grading companies for Silicon Laboratories Inc.:
| Grading Company | Action | New Grade | Date |
|---|---|---|---|
| Morgan Stanley | Maintain | Equal Weight | 2025-08-06 |
| Susquehanna | Maintain | Neutral | 2025-08-06 |
| Barclays | Maintain | Equal Weight | 2025-08-05 |
| Susquehanna | Maintain | Neutral | 2025-07-22 |
| Stifel | Maintain | Buy | 2025-07-18 |
| Keybanc | Maintain | Overweight | 2025-07-08 |
| Benchmark | Maintain | Buy | 2025-05-27 |
| Benchmark | Maintain | Buy | 2025-05-14 |
| Susquehanna | Maintain | Neutral | 2025-05-14 |
| Needham | Maintain | Buy | 2025-05-14 |
Silicon Laboratories Inc. presents a mixed grade profile with multiple “Buy” ratings balanced by “Neutral” and “Equal Weight” assessments, reflecting moderate confidence with some reservations.
Which company has the best grades?
Both companies share a consensus “Buy” rating, but Tower Semiconductor Ltd. has more consistent “Buy” and “Positive” grades, while Silicon Laboratories Inc. shows more variability including neutral and equal weight ratings. This difference may influence investors’ perception of relative stability and growth potential.
Strengths and Weaknesses
Below is a comparison of Tower Semiconductor Ltd. (TSEM) and Silicon Laboratories Inc. (SLAB) based on key financial and market criteria.
| Criterion | Tower Semiconductor Ltd. (TSEM) | Silicon Laboratories Inc. (SLAB) |
|---|---|---|
| Diversification | Moderate, focused on semiconductor manufacturing | Limited, mainly Industrial & Commercial segment |
| Profitability | Net margin 14.47%, ROIC 6.41% (slightly favorable) | Negative net margin -32.69%, ROIC -14.71% (unfavorable) |
| Innovation | Growing ROIC indicates improving efficiency | Declining ROIC signals challenges in innovation |
| Global presence | Established global footprint in semiconductor space | Global reach but concentrated revenue streams |
| Market Share | Solid but faces strong competition | Market share impacted by declining financial performance |
Key takeaways: Tower Semiconductor shows improving profitability and efficiency despite slightly unfavorable moat status, making it a cautiously attractive option. Silicon Laboratories faces significant profitability and innovation challenges, suggesting higher risk for investors.
Risk Analysis
Below is a comparative table of key risks for Tower Semiconductor Ltd. (TSEM) and Silicon Laboratories Inc. (SLAB) based on the latest 2024 data:
| Metric | Tower Semiconductor Ltd. (TSEM) | Silicon Laboratories Inc. (SLAB) |
|---|---|---|
| Market Risk | Moderate (Beta 0.88, stable range) | Higher (Beta 1.55, volatile range) |
| Debt level | Low (D/E 0.07, favorable) | Very Low (D/E 0.01, very favorable) |
| Regulatory Risk | Moderate (global operations, multiple jurisdictions) | Moderate (US and China exposure) |
| Operational Risk | Moderate (manufacturing complexity) | Moderate (fabless model, supply chain reliance) |
| Environmental Risk | Moderate (manufacturing emissions) | Lower (fabless, less direct emissions) |
| Geopolitical Risk | Elevated (headquartered in Israel, exposure to Asia markets) | Moderate (US-based, China exposure) |
Synthesizing the risks, SLAB carries higher market volatility and operational risks linked to its fabless model, with weak profitability metrics raising financial distress concerns. TSEM’s geopolitical exposure and operational complexity are notable, but its strong balance sheet and safer financial scores mitigate default risk. Investors should weigh SLAB’s higher beta and losses against TSEM’s steadier profile and moderate regulatory challenges.
Which Stock to Choose?
Tower Semiconductor Ltd. (TSEM) shows a favorable income statement with strong gross and net margins, though recent growth rates have slowed. Financial ratios are slightly favorable overall, with low debt and solid interest coverage, but a moderate return on equity and some unfavorable valuation metrics. The company has a slightly unfavorable MOAT status, indicating value destruction despite increasing profitability, and holds a very favorable B+ rating.
Silicon Laboratories Inc. (SLAB) presents a mixed picture with a high gross margin but negative EBIT and net margins, reflecting operational challenges and declining profitability. Most financial ratios are unfavorable, despite very low debt levels, and the MOAT evaluation is very unfavorable due to declining returns on invested capital. Its overall rating is C-, indicating significant financial weakness.
The choice between these stocks might depend on investor risk profiles: those with a higher risk tolerance and focus on turnaround potential could find SLAB’s valuation and recent price acceleration appealing, while more risk-averse or quality-oriented investors may view TSEM’s stable income metrics and stronger rating as more favorable. Both companies carry risks given their MOAT evaluations and recent financial trends.
Disclaimer: Investment carries a risk of loss of initial capital. The past performance is not a reliable indicator of future results. Be sure to understand risks before making an investment decision.
Go Further
I encourage you to read the complete analyses of Tower Semiconductor Ltd. and Silicon Laboratories Inc. to enhance your investment decisions: