Home > Comparison > Technology > SLAB vs LSCC
The strategic rivalry between Silicon Laboratories Inc. and Lattice Semiconductor Corporation shapes the semiconductor sector’s evolution. Silicon Labs operates as a fabless provider of analog-intensive mixed-signal solutions, focusing on IoT and industrial automation. Lattice Semiconductor specializes in field programmable gate arrays and IP licensing, targeting communications and computing markets. This analysis evaluates which operational model offers superior risk-adjusted returns, guiding investors in selecting the more resilient technology leader for diversified portfolios.
Table of contents
Companies Overview
Silicon Laboratories Inc. and Lattice Semiconductor Corporation are pivotal players shaping the semiconductor landscape in 2026.
Silicon Laboratories Inc.: Analog-Intensive Mixed-Signal Innovator
Silicon Laboratories Inc. dominates the fabless semiconductor segment with its analog-intensive mixed-signal solutions. It drives revenue through wireless microcontrollers and sensor products pivotal for IoT applications like industrial automation and smart metering. The company’s 2026 strategy emphasizes expanding its footprint in connected home and security markets, leveraging its broad product portfolio and direct sales network.
Lattice Semiconductor Corporation: FPGA and Connectivity Specialist
Lattice Semiconductor Corporation leads with its field programmable gate arrays (FPGAs) and video connectivity products. It earns primarily from selling these products across communications, computing, and industrial sectors worldwide. In 2026, Lattice focuses on growing its IP licensing and patent monetization while enhancing product families like Certus-NX, aiming to deepen its presence in automotive and consumer electronics markets.
Strategic Collision: Similarities & Divergences
Both companies carve niches in semiconductors but differ in approach: Silicon Laboratories emphasizes analog mixed-signal integration with IoT applications, while Lattice pursues a programmable logic and IP licensing model. Their main battleground is the expanding industrial and consumer electronics sectors. Investors encounter distinct profiles—Silicon Labs offers diversified IoT exposure, whereas Lattice leans on flexible FPGA technology and licensing streams.
Income Statement Comparison
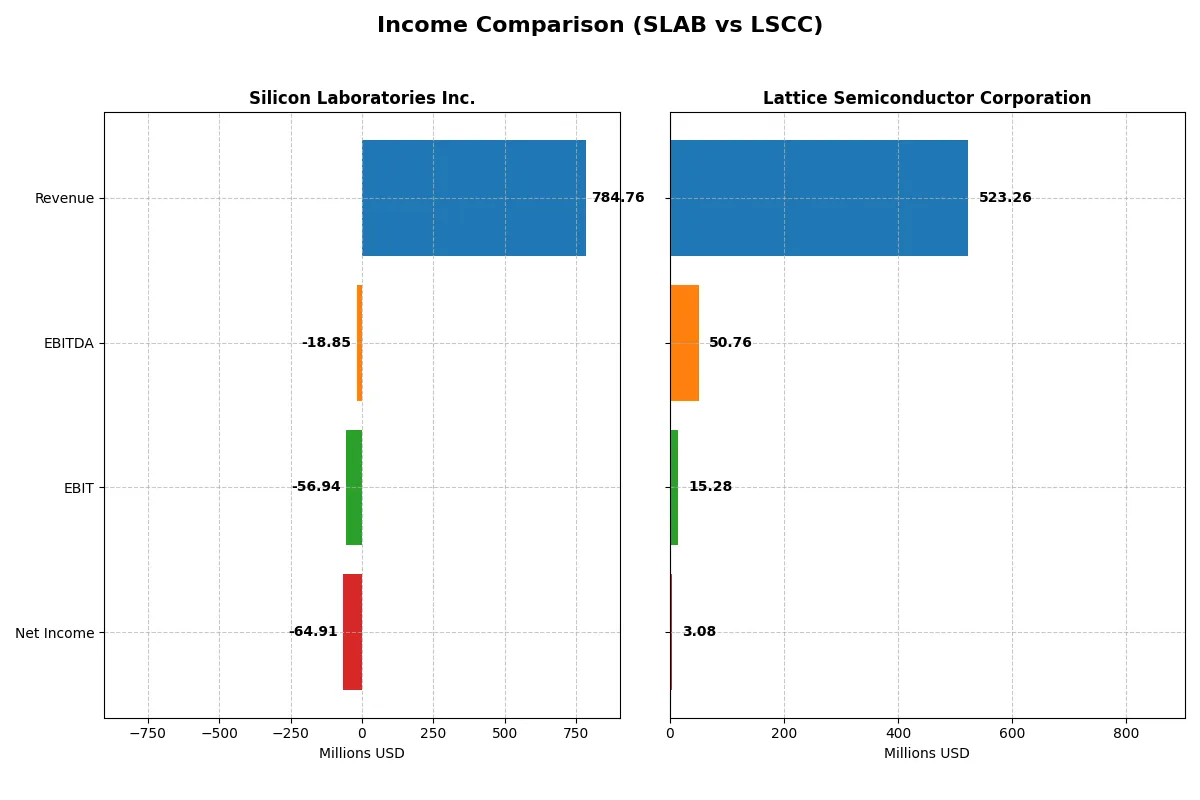
This data dissects the core profitability and scalability of both corporate engines to reveal who dominates the bottom line:
| Metric | Silicon Laboratories Inc. (SLAB) | Lattice Semiconductor Corporation (LSCC) |
|---|---|---|
| Revenue | 785M | 523M |
| Cost of Revenue | 328M | 166M |
| Operating Expenses | 528M | 342M |
| Gross Profit | 457M | 357M |
| EBITDA | -19M | 51M |
| EBIT | -57M | 15M |
| Interest Expense | 1M | 3M |
| Net Income | -65M | 3M |
| EPS | -1.98 | 0.0225 |
| Fiscal Year | 2025 | 2025 |
Income Statement Analysis: The Bottom-Line Duel
This income statement comparison reveals which company operates with greater financial efficiency and sustainability over recent years.
Silicon Laboratories Inc. Analysis
Silicon Laboratories’ revenue shows a mixed trajectory, peaking at 1.02B in 2022 before falling to 785M in 2025. Net income turned sharply negative, hitting -65M in 2025 from a positive 91M in 2022. Despite a gross margin of 58.2% indicating solid core profitability, the net margin plunged to -8.3%, driven by high operating expenses and R&D costs, signaling efficiency challenges amid growth efforts.
Lattice Semiconductor Corporation Analysis
Lattice Semiconductor’s revenue remained relatively stable, around 523M in 2025, with a slight overall increase since 2021. Net income dropped sharply from 259M in 2023 to just 3M in 2025. Its gross margin stays robust at 68.2%, but net margin barely reaches 0.6%, reflecting margin compression and declining operational momentum. EBIT margin is positive but weak at 2.9%, highlighting ongoing profitability pressure.
Margin Resilience vs. Earnings Stability
Silicon Laboratories outpaces Lattice in revenue growth and gross margin expansion but struggles with sustained profitability, resulting in widening net losses. Lattice maintains strong gross margins yet faces a steep net income decline and weak bottom-line results. For investors, Silicon Laboratories presents a high-growth, high-risk profile while Lattice offers steadier revenue with urgent profitability remediation needed.
Financial Ratios Comparison
These vital ratios act as a diagnostic tool to expose the underlying fiscal health, valuation premiums, and capital efficiency of the companies compared below:
| Ratios | Silicon Laboratories Inc. (SLAB) | Lattice Semiconductor Corporation (LSCC) |
|---|---|---|
| ROE | -5.9% | 0.4% |
| ROIC | -6.3% | 0.5% |
| P/E | -66.5x | 3496.2x |
| P/B | 3.94x | 15.10x |
| Current Ratio | 4.69 | 3.09 |
| Quick Ratio | 4.02 | 2.33 |
| D/E | 0 | 0.10 |
| Debt-to-Assets | 0 | 8.4% |
| Interest Coverage | -72.3x | 5.3x |
| Asset Turnover | 0.62 | 0.61 |
| Fixed Asset Turnover | 6.10 | 4.49 |
| Payout ratio | 0% | 0% |
| Dividend yield | 0% | 0% |
| Fiscal Year | 2025 | 2025 |
Efficiency & Valuation Duel: The Vital Signs
Ratios serve as a company’s financial DNA, exposing hidden risks and revealing operational excellence behind the numbers.
Silicon Laboratories Inc.
Silicon Laboratories shows negative profitability with ROE at -5.93% and a net margin of -8.27%, signaling operational challenges. Its valuation appears attractive with a negative P/E, but a high PB ratio of 3.94 suggests some market skepticism. The company pays no dividend, instead investing heavily in R&D, indicating a growth-focused reinvestment strategy.
Lattice Semiconductor Corporation
Lattice Semiconductor posts low but positive profitability: ROE at 0.43% and net margin at 0.59%. However, its valuation is stretched, with a P/E of 3,496 and a PB ratio of 15.1, reflecting elevated investor expectations. The firm also pays no dividend, channeling capital into R&D and operational improvements to support future growth.
Valuation Appeal vs. Profitability Struggles
Both firms face unfavorable profitability metrics, but Silicon Laboratories offers a more reasonable valuation relative to earnings. Lattice’s sky-high multiples demand justification through growth that is yet to materialize. Investors seeking a balance of risk and reward might prefer Silicon Laboratories’ cheaper profile, while growth seekers may tolerate Lattice’s lofty valuation.
Which one offers the Superior Shareholder Reward?
Silicon Laboratories Inc. (SLAB) and Lattice Semiconductor Corporation (LSCC) both forgo dividends, focusing on reinvestment and buybacks. SLAB shows no dividend yield and zero payout, emphasizing cash-rich reinvestment with free cash flow per share around 2.0, but carries consistent net losses and negative margins. LSCC, while also dividend-free, maintains modest profitability with net margins above 0.5%, positive free cash flow near 1.0 per share, and a more aggressive buyback supported by solid operating cash flow coverage. LSCC’s disciplined capital allocation and sustainable cash flow generation provide a more attractive total return profile for 2026. I conclude LSCC offers the superior shareholder reward given its balanced growth and buyback intensity.
Comparative Score Analysis: The Strategic Profile
The radar chart reveals the fundamental DNA and trade-offs of Silicon Laboratories Inc. and Lattice Semiconductor Corporation:
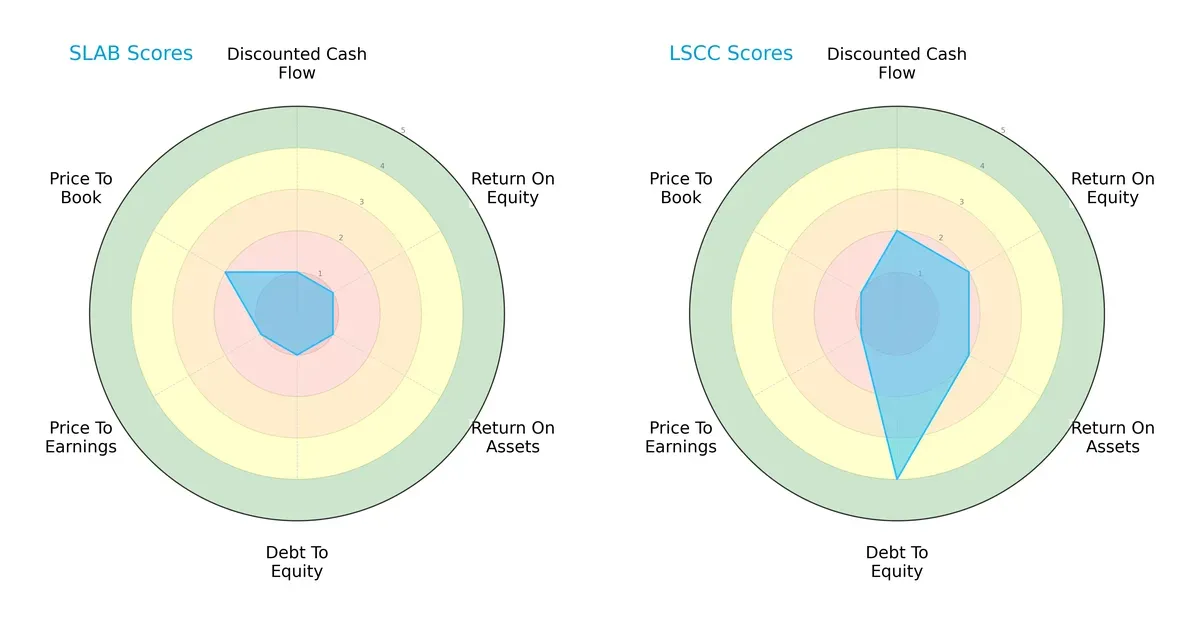
Silicon Laboratories shows uniformly low scores across all metrics, indicating a broad weakness in financial and valuation factors. Lattice Semiconductor performs better on debt management with a favorable debt-to-equity score but struggles with valuation metrics, reflecting a reliance on balance sheet strength over profitability or valuation appeal. Overall, Lattice offers a more balanced financial profile, while Silicon Laboratories depends on no specific edge.
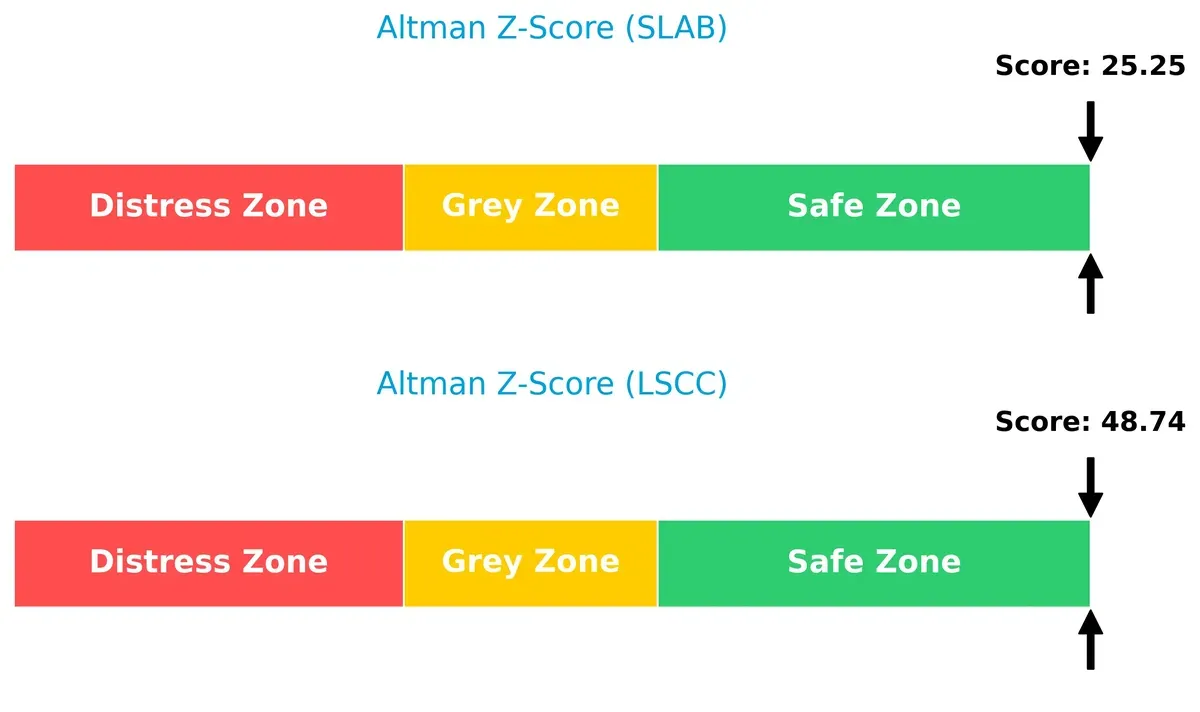
Bankruptcy Risk: Solvency Showdown
Lattice Semiconductor’s Altman Z-Score surpasses Silicon Laboratories by a wide margin, signaling superior long-term solvency and a safer investment during economic cycles:
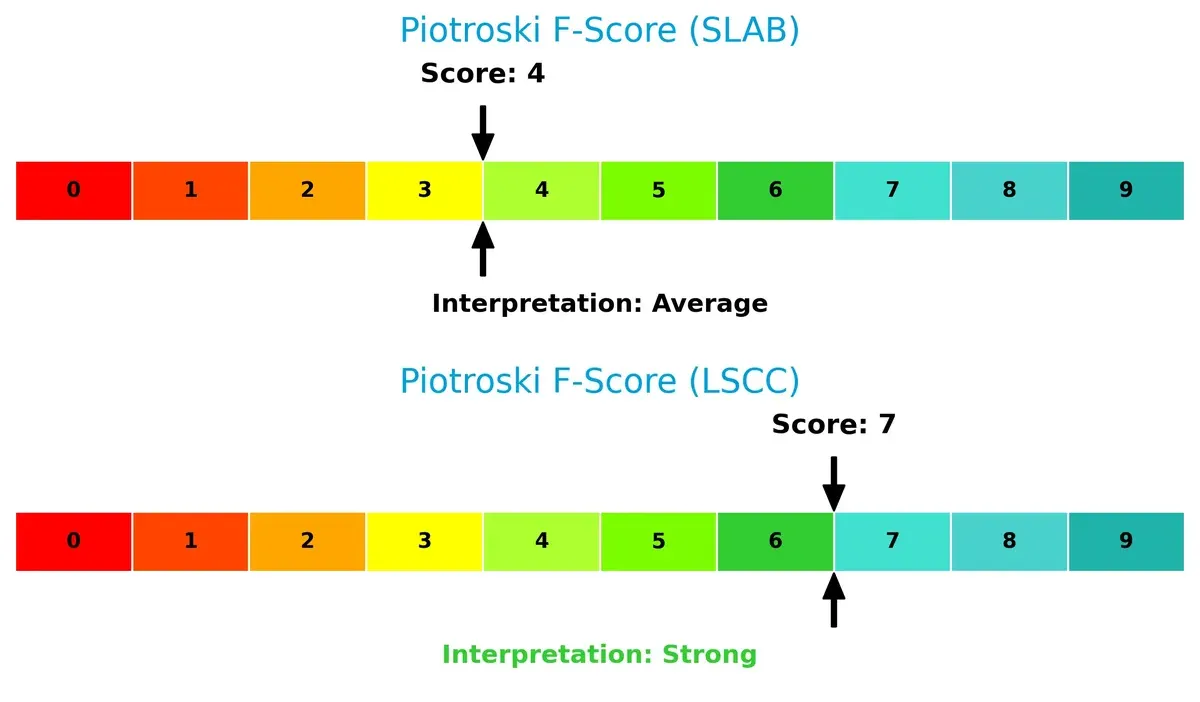
Financial Health: Quality of Operations
Lattice Semiconductor’s Piotroski F-Score of 7 denotes strong financial health, outperforming Silicon Laboratories’ average score of 4, which raises red flags in operational quality and internal metrics:
How are the two companies positioned?
This section dissects the operational DNA of SLAB and LSCC by comparing their revenue distribution and internal dynamics. The final goal is to confront their economic moats to identify which business model offers the most resilient, sustainable competitive advantage today.
Revenue Segmentation: The Strategic Mix
The following comparison dissects how Silicon Laboratories Inc. and Lattice Semiconductor Corporation diversify their income streams and where their primary sector bets lie:
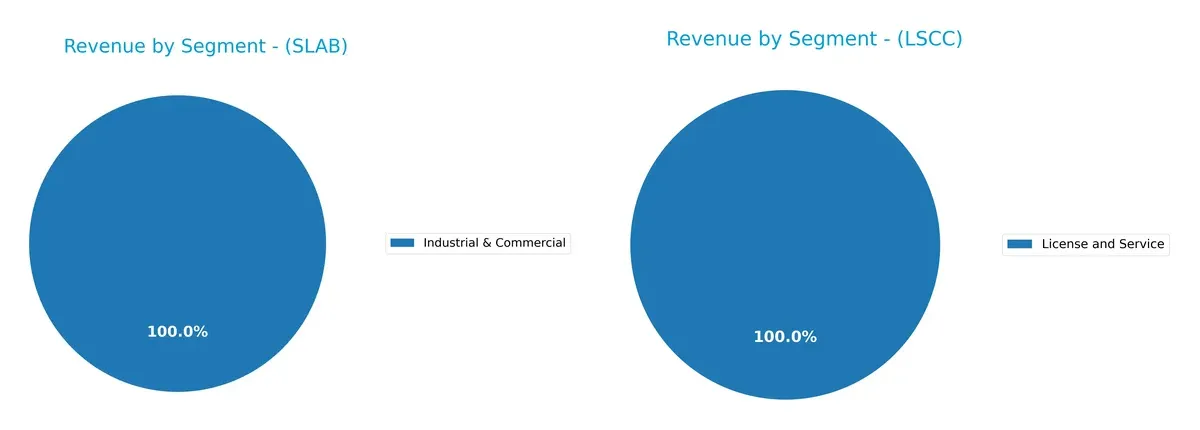
Silicon Laboratories leans heavily on a single segment, Industrial & Commercial, generating $445M in 2025, showing a concentrated but focused revenue base. Lattice Semiconductor spreads its revenue across Product Revenue, Direct ($50.6M), Distributors ($332M), and License and Service ($17.1M), reflecting a more diversified model. Silicon Labs’ concentration risks contrast with Lattice’s broader approach, which may better weather sector shifts but demands complex ecosystem management.
Strengths and Weaknesses Comparison
This table compares the Strengths and Weaknesses of Silicon Laboratories Inc. (SLAB) and Lattice Semiconductor Corporation (LSCC):
SLAB Strengths
- Zero debt enhances financial stability
- Quick ratio above 4 shows strong liquidity
- Favorable fixed asset turnover at 6.1
- Diversified revenue across multiple segments
- Significant global presence including China and Taiwan
LSCC Strengths
- Favorable interest coverage at 5.27 indicates ability to cover debt costs
- Low debt-to-assets ratio at 8.38%
- Quick ratio above 2.3 supports liquidity
- Global sales strong in Asia and Americas
- Favorable fixed asset turnover at 4.49
SLAB Weaknesses
- Negative net margin, ROE, and ROIC indicate unprofitability
- High WACC at 10.86% raises capital cost
- Negative interest coverage signals financial stress
- Unfavorable price-to-book ratio at 3.94
- Concentrated revenue in Industrial & Commercial segment limits diversification
LSCC Weaknesses
- Very low net margin, ROE, and ROIC reflect weak profitability
- High WACC at 11.47% increases financing cost
- Extremely high P/E at 3496.18 questions valuation
- Moderate current ratio near 3 may pose liquidity concerns
- Revenue heavily reliant on License and Service segment
Silicon Laboratories shows financial strength in liquidity and asset efficiency but struggles with profitability and capital cost. Lattice Semiconductor has better interest coverage and moderate leverage but faces profitability challenges and valuation risks. Both companies exhibit unfavorable overall financial ratios, highlighting the need for attentive capital and operational management.
The Moat Duel: Analyzing Competitive Defensibility
A structural moat is the only reliable shield protecting long-term profits from relentless competitive pressures. Let’s dissect how each company defends its turf:
Silicon Laboratories Inc.: Intangible Assets and Niche Innovation
Silicon Labs leans on specialized analog and mixed-signal technology, reflected in solid gross margins near 58%. However, declining ROIC signals weakening capital efficiency. New IoT applications offer growth, but margin pressure remains a threat in 2026.
Lattice Semiconductor Corporation: Cost Advantage in Programmable Logic
Lattice’s moat centers on cost-efficient FPGA solutions, boasting higher gross margins around 68%. Yet, shrinking EBIT and net margins reveal profitability struggles. Expansion into communications and industrial markets could stabilize returns if execution improves.
Verdict: Specialized Innovation vs. Cost Efficiency in Decline
Both firms face deteriorating ROIC well below WACC, signaling value destruction. Silicon Labs’ niche tech and product innovation offer deeper moat potential than Lattice’s cost focus. Silicon Labs appears better positioned to defend market share despite current profitability challenges.
Which stock offers better returns?
The past year shows strong upward momentum for both stocks, with Silicon Laboratories Inc. exhibiting sharper gains and more pronounced acceleration in price movements.
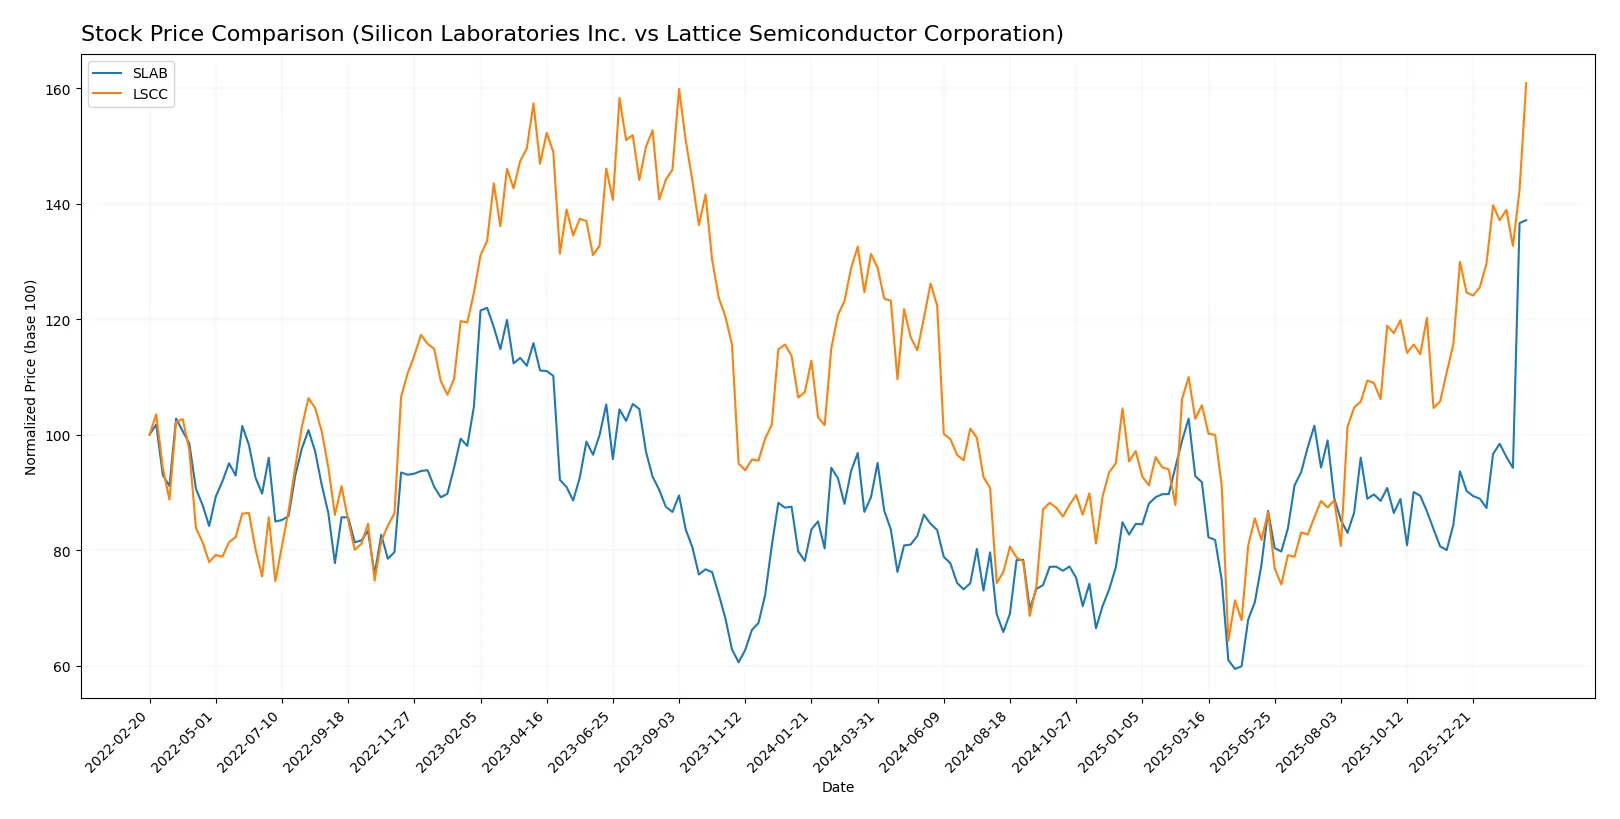
Trend Comparison
Silicon Laboratories Inc. (SLAB) posted a 53.82% price increase over 12 months, signaling a bullish trend with acceleration. It reached a high of 207.27 and a low of 89.82, with volatility at 18.09.
Lattice Semiconductor Corporation (LSCC) rose 22.53% over the same period, also bullish with accelerating gains. Its price ranged from 39.03 to 97.63, and volatility measured 11.77, indicating steadier movement.
SLAB outperformed LSCC significantly in market returns, delivering more than double LSCC’s price appreciation with stronger momentum and higher volatility.
Target Prices
Analysts present a bullish consensus for both Silicon Laboratories Inc. and Lattice Semiconductor Corporation.
| Company | Target Low | Target High | Consensus |
|---|---|---|---|
| Silicon Laboratories Inc. | 160 | 231 | 211.6 |
| Lattice Semiconductor Corporation | 80 | 125 | 104.7 |
The target consensus for Silicon Labs exceeds its current price of 207.27, indicating upside potential. Lattice Semiconductor’s consensus target of 104.7 also suggests moderate appreciation from its current price of 97.63.

Don’t Let Luck Decide Your Entry Point
Optimize your entry points with our advanced ProRealTime indicators. You’ll get efficient buy signals with precise price targets for maximum performance. Start outperforming now!
How do institutions grade them?
Silicon Laboratories Inc. Grades
The following table summarizes recent grades from recognized financial institutions for Silicon Laboratories Inc.:
| Grading Company | Action | New Grade | Date |
|---|---|---|---|
| Citigroup | Maintain | Neutral | 2026-02-06 |
| RBC Capital | Maintain | Sector Perform | 2026-02-05 |
| Benchmark | Downgrade | Hold | 2026-02-04 |
| Needham | Downgrade | Hold | 2026-02-04 |
| Keybanc | Downgrade | Sector Weight | 2026-02-04 |
| Morgan Stanley | Maintain | Equal Weight | 2025-08-06 |
| Susquehanna | Maintain | Neutral | 2025-08-06 |
| Barclays | Maintain | Equal Weight | 2025-08-05 |
| Susquehanna | Maintain | Neutral | 2025-07-22 |
| Stifel | Maintain | Buy | 2025-07-18 |
Lattice Semiconductor Corporation Grades
The table below shows recent grades from established financial firms for Lattice Semiconductor Corporation:
| Grading Company | Action | New Grade | Date |
|---|---|---|---|
| Susquehanna | Maintain | Positive | 2026-02-11 |
| Jefferies | Maintain | Buy | 2026-02-11 |
| Keybanc | Maintain | Overweight | 2026-02-11 |
| Stifel | Maintain | Buy | 2026-02-11 |
| Needham | Maintain | Buy | 2026-02-11 |
| Benchmark | Maintain | Buy | 2026-02-11 |
| RBC Capital | Maintain | Outperform | 2026-02-11 |
| Rosenblatt | Maintain | Buy | 2026-02-11 |
| Susquehanna | Maintain | Positive | 2026-01-22 |
| Keybanc | Maintain | Overweight | 2026-01-13 |
Which company has the best grades?
Lattice Semiconductor consistently receives strong buy and overweight ratings, reflecting greater institutional confidence. Silicon Laboratories shows mostly neutral to hold grades with multiple recent downgrades. This divergence may influence investor sentiment and risk assessment.
Risks specific to each company
In the volatile 2026 semiconductor market, these categories highlight critical pressure points and systemic threats facing Silicon Laboratories Inc. and Lattice Semiconductor Corporation:
1. Market & Competition
Silicon Laboratories Inc.
- Faces intense competition in analog mixed-signal solutions, pressured by innovation cycles and IoT market shifts.
Lattice Semiconductor Corporation
- Competes in FPGA and IP licensing with high innovation demand; market consolidation intensifies rivalry.
2. Capital Structure & Debt
Silicon Laboratories Inc.
- Zero debt reduces financial risk but signals limited leverage for growth; interest coverage is negative.
Lattice Semiconductor Corporation
- Low debt-to-equity ratio (0.1) with positive interest coverage (5.27) supports manageable leverage and financial resilience.
3. Stock Volatility
Silicon Laboratories Inc.
- Beta at 1.54 indicates above-market volatility; price range nearing all-time highs increases risk of correction.
Lattice Semiconductor Corporation
- Higher beta of 1.67 signals elevated price swings; recent sharp price drop (-2.17%) adds downside concern.
4. Regulatory & Legal
Silicon Laboratories Inc.
- Exposure to US-China trade tensions could disrupt supply and sales in key markets.
Lattice Semiconductor Corporation
- Global footprint in Asia and Europe raises regulatory compliance complexity and geopolitical legal risks.
5. Supply Chain & Operations
Silicon Laboratories Inc.
- Fabless model depends on third-party foundries, vulnerable to capacity constraints and geopolitical disruptions.
Lattice Semiconductor Corporation
- Similar fabless reliance, with added risk from specialized FPGA manufacturing processes and licensing dependencies.
6. ESG & Climate Transition
Silicon Laboratories Inc.
- Needs to enhance ESG disclosures; industry pressures to reduce energy use in manufacturing impact cost structures.
Lattice Semiconductor Corporation
- Stronger ESG focus needed; climate transition costs may affect capital allocation and operational efficiency.
7. Geopolitical Exposure
Silicon Laboratories Inc.
- US-based but with significant China exposure, risking tariffs and export controls impacting revenues.
Lattice Semiconductor Corporation
- Broader geographic sales increase exposure to geopolitical instability, especially in Asia-Pacific regions.
Which company shows a better risk-adjusted profile?
Silicon Laboratories’ zero debt and fabless agility limit financial risk but suffer from weak profitability and negative interest coverage. Lattice Semiconductor’s manageable debt and strong interest coverage improve financial stability despite higher valuation risks and recent stock volatility. Lattice’s better Piotroski score (7 vs. 4) signals superior operational health. However, both face severe margin pressures and competitive threats. I see Lattice Semiconductor as showing a marginally better risk-adjusted profile due to its balanced capital structure and stronger financial scores. The critical risks remain Silicon Labs’ negative profitability and Lattice’s valuation extremes, amplified by market volatility in 2026.
Final Verdict: Which stock to choose?
Silicon Laboratories Inc. (SLAB) impresses with its operational resilience and strong cash position, making it a cash machine in a volatile sector. However, its persistent value destruction and declining profitability remain points of vigilance. SLAB suits portfolios aiming for aggressive growth with a tolerance for risk.
Lattice Semiconductor Corporation (LSCC) leverages a strategic moat through its recurring revenue and solid balance sheet, offering better stability than SLAB. While growth has slowed, its robust cash flow and strong financial health make it attractive for GARP investors seeking measured growth at a reasonable price.
If you prioritize aggressive growth and can tolerate value erosion, SLAB’s operational strength outshines LSCC’s cautious approach. However, if you seek financial stability and consistent cash flow in a semiconductor play, LSCC offers better risk-adjusted prospects despite its premium valuation.
Disclaimer: Investment carries a risk of loss of initial capital. The past performance is not a reliable indicator of future results. Be sure to understand risks before making an investment decision.
Go Further
I encourage you to read the complete analyses of Silicon Laboratories Inc. and Lattice Semiconductor Corporation to enhance your investment decisions: