In the dynamic semiconductor industry, Silicon Laboratories Inc. (SLAB) and indie Semiconductor, Inc. (INDI) stand out for their innovative approaches and market focus. SLAB excels in mixed-signal solutions for IoT applications, while INDI targets automotive semiconductors and advanced driver assistance systems. Their overlapping technologies and growth potential make them intriguing for investors. This article will help you decide which company aligns best with your investment strategy.
Table of contents
Companies Overview
I will begin the comparison between Silicon Laboratories Inc. and indie Semiconductor, Inc. by providing an overview of these two companies and their main differences.
Silicon Laboratories Inc. Overview
Silicon Laboratories Inc. is a fabless semiconductor company specializing in analog-intensive mixed-signal solutions. Headquartered in Austin, Texas, it serves markets worldwide including IoT applications such as connected home, industrial automation, smart metering, and medical instrumentation. Founded in 1996, Silicon Labs operates in the technology sector with a market cap of approximately 5B USD.
indie Semiconductor, Inc. Overview
indie Semiconductor, Inc. focuses on automotive semiconductors and software solutions for advanced driver assistance, connected car technology, and electrification. Based in Aliso Viejo, California, the company offers devices for parking assistance, infotainment, telematics, and optical communication markets. Incorporated in 2007, indie Semiconductor has a market capitalization close to 860M USD in the technology sector.
Key similarities and differences
Both companies operate in the semiconductor industry within the technology sector, but their market focus differs significantly. Silicon Labs targets a broad range of IoT applications with mixed-signal solutions, while indie Semiconductor specializes in automotive-related semiconductors and software. Silicon Labs has a larger market cap and employee base, reflecting a more established presence compared to indie Semiconductor’s niche automotive orientation and smaller scale.
Income Statement Comparison
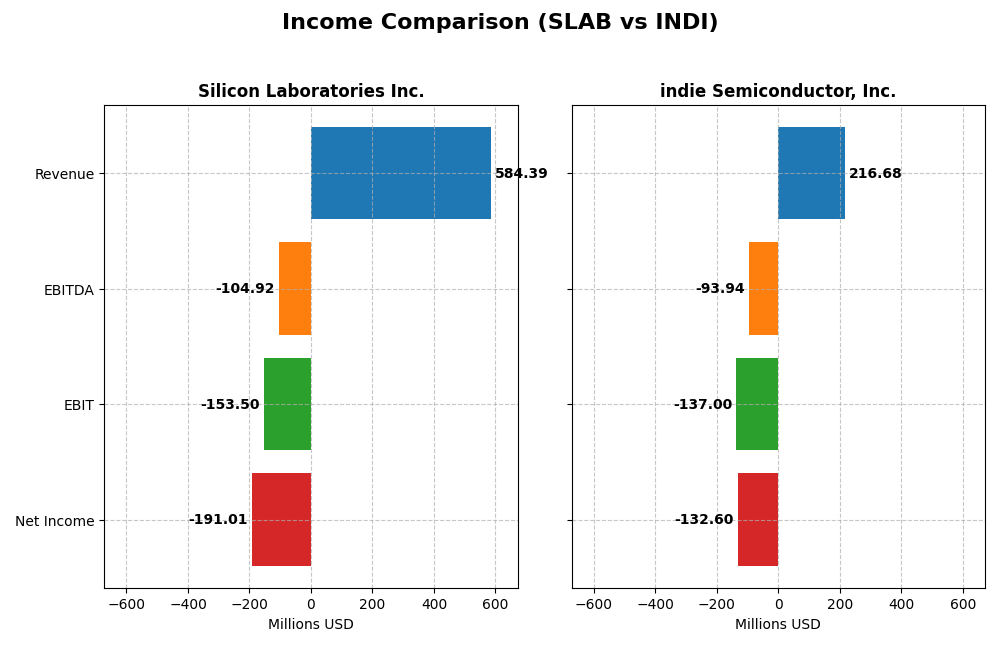
Below is a side-by-side comparison of the most recent income statement metrics for Silicon Laboratories Inc. and indie Semiconductor, Inc. for the fiscal year 2024.
| Metric | Silicon Laboratories Inc. (SLAB) | indie Semiconductor, Inc. (INDI) |
|---|---|---|
| Market Cap | 5.0B | 857M |
| Revenue | 584M | 217M |
| EBITDA | -105M | -94M |
| EBIT | -154M | -137M |
| Net Income | -191M | -133M |
| EPS | -5.93 | -0.76 |
| Fiscal Year | 2024 | 2024 |
Income Statement Interpretations
Silicon Laboratories Inc.
Silicon Laboratories Inc. experienced a revenue increase of 14.4% from 2020 to 2024, but revenue declined by 25.3% in the last year. Net income showed significant volatility, with a steep decline overall, culminating in a -191M USD net loss in 2024. Gross margins remain favorable at 53.4%, yet EBIT and net margins deteriorated, reflecting weaker profitability and margin compression in the latest year.
indie Semiconductor, Inc.
indie Semiconductor’s revenue grew dramatically by 858.4% over the period but slightly fell by 2.9% in 2024. The company faces ongoing net losses, with a net margin of -61.2% and a net loss of -133M USD in the latest year. Gross margin improved significantly last year to 41.7%, and EPS showed a positive growth of 6.2%, indicating some operational improvement despite persistent high losses.
Which one has the stronger fundamentals?
Silicon Laboratories shows a stronger gross margin and lower interest expense ratio but suffers from worsening EBIT and net margins with a sharp net income decline. indie Semiconductor exhibits rapid revenue growth and improving EPS and gross margin, yet its profitability remains weak with substantial losses. Overall, Silicon Laboratories’ fundamentals appear more stable, while indie Semiconductor’s show mixed signals with high growth but ongoing losses.
Financial Ratios Comparison
The table below presents a side-by-side comparison of key financial ratios for Silicon Laboratories Inc. (SLAB) and indie Semiconductor, Inc. (INDI) based on their most recent fiscal year data from 2024.
| Ratios | Silicon Laboratories Inc. (SLAB) | indie Semiconductor, Inc. (INDI) |
|---|---|---|
| ROE | -17.7% | -31.7% |
| ROIC | -14.7% | -19.3% |
| P/E | -21.5 | -5.35 |
| P/B | 3.81 | 1.70 |
| Current Ratio | 6.15 | 4.82 |
| Quick Ratio | 5.07 | 4.23 |
| D/E (Debt-to-Equity) | 0.014 | 0.954 |
| Debt-to-Assets | 1.27% | 42.3% |
| Interest Coverage | -126.3 | -18.4 |
| Asset Turnover | 0.48 | 0.23 |
| Fixed Asset Turnover | 4.42 | 4.30 |
| Payout Ratio | 0 | 0 |
| Dividend Yield | 0% | 0% |
Interpretation of the Ratios
Silicon Laboratories Inc.
Silicon Laboratories Inc. shows a mixed ratio profile with notable weaknesses: negative net margin (-32.69%), return on equity (-17.69%), and return on invested capital (-14.71%) all signal operational and profitability challenges. The company’s strong quick ratio (5.07) and low debt-to-equity (0.01) suggest solid liquidity and conservative leverage. Silicon Labs does not pay dividends, likely due to ongoing reinvestment in research and development, as indicated by a high R&D-to-revenue ratio.
indie Semiconductor, Inc.
indie Semiconductor exhibits several unfavorable financial ratios, including a deeply negative net margin (-61.2%), return on equity (-31.73%), and return on invested capital (-19.25%), pointing to significant profitability issues. Liquidity measures are relatively strong with a quick ratio of 4.23, but leverage is higher and more neutral, with a debt-to-equity ratio of 0.95. indie Semiconductor also does not pay dividends, reflecting its growth phase and prioritization of investment in R&D and acquisitions.
Which one has the best ratios?
Both Silicon Laboratories Inc. and indie Semiconductor have unfavorable overall ratio profiles, with Silicon Labs showing a slightly higher proportion of favorable ratios (35.71% vs 21.43%). Silicon Labs benefits from lower leverage and better liquidity, while indie Semiconductor carries higher debt and more severe profitability deficits. Neither company distributes dividends, consistent with their current financial challenges and reinvestment strategies.
Strategic Positioning
This section compares the strategic positioning of Silicon Laboratories Inc. and indie Semiconductor, Inc., focusing on Market position, Key segments, and Exposure to technological disruption:
Silicon Laboratories Inc.
- Fabless semiconductor with a $5B market cap, moderate competitive pressure in semiconductors.
- Diverse segments including IoT, industrial automation, smart metering, and consumer electronics.
- Exposure to IoT and mixed-signal technologies with ongoing innovation in wireless microcontrollers.
indie Semiconductor, Inc.
- Smaller $857M market cap, higher beta indicating greater volatility and competitive pressure.
- Concentrated on automotive semiconductors and software for ADAS, connected cars, and electrification.
- Focused on automotive technology platforms, including photonics and advanced driver assistance systems.
Silicon Laboratories Inc. vs indie Semiconductor, Inc. Positioning
Silicon Laboratories pursues a diversified approach across multiple electronics and IoT segments, offering broad market exposure. indie Semiconductor focuses on a narrower automotive semiconductor niche, which may pose concentration risks but allows specialization in high-tech automotive solutions.
Which has the best competitive advantage?
Both companies show very unfavorable MOAT evaluations with declining ROIC trends, indicating value destruction and weak competitive advantages. Neither currently demonstrates a sustainable economic moat based on the provided data.
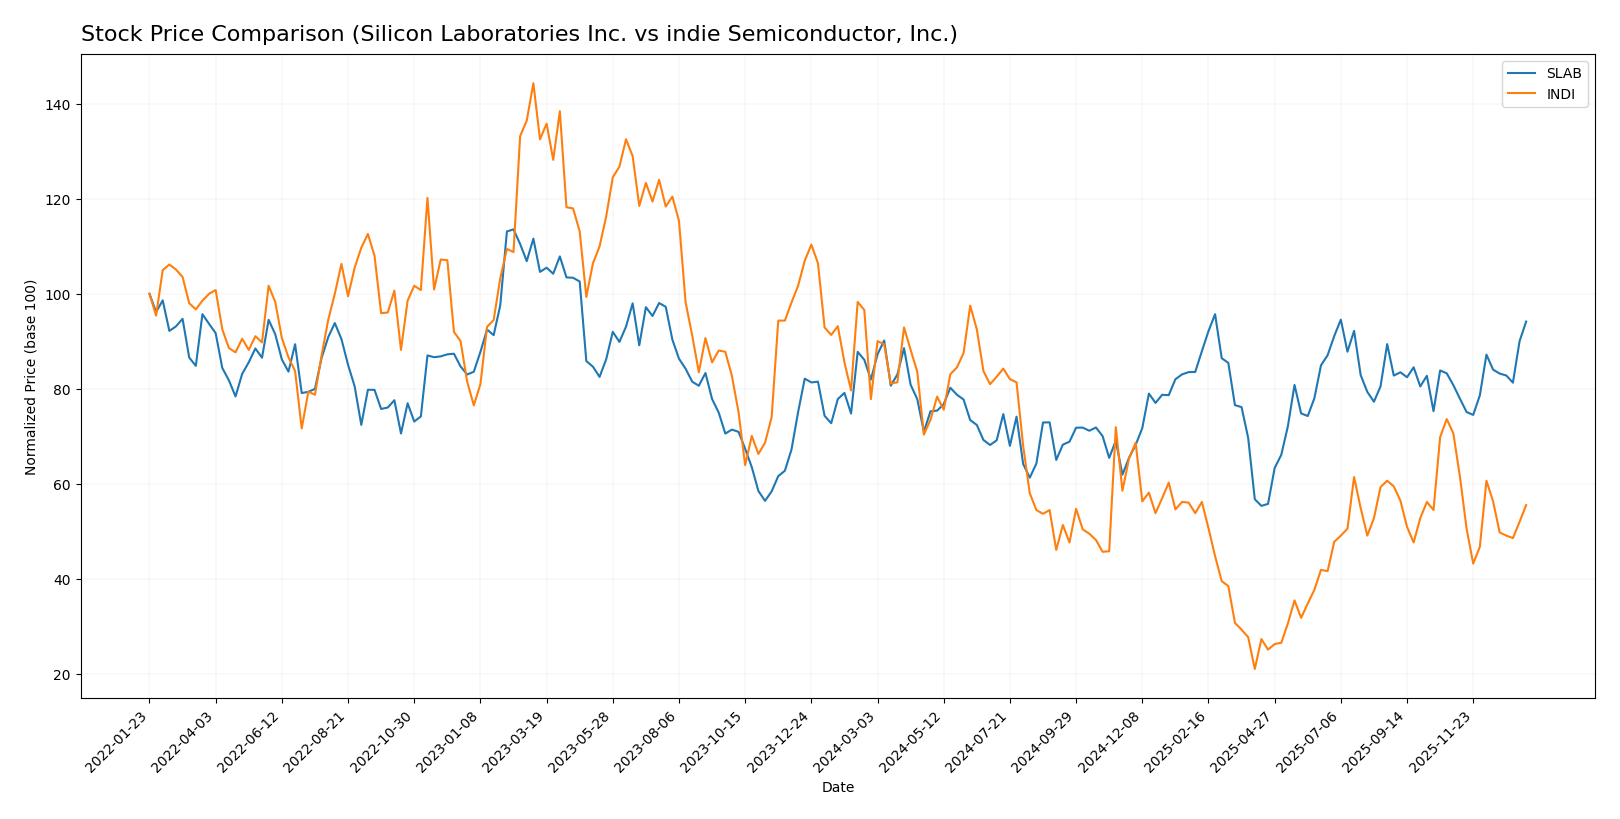
Stock Comparison
The stock price chart highlights contrasting trading dynamics over the past 12 months, with Silicon Laboratories Inc. showing a pronounced upward momentum while indie Semiconductor, Inc. experiences a significant decline.
Trend Analysis
Silicon Laboratories Inc. (SLAB) exhibited a bullish trend with a 14.91% price increase over the past year, accompanied by accelerating momentum and a high volatility level (14.15 std deviation). The stock reached a peak of 155.33 and a low of 89.82.
indie Semiconductor, Inc. (INDI) showed a bearish trend, with a 28.67% price decline over the same period and decelerating negative momentum. Volatility was low at 1.35 std deviation, with prices ranging between 1.6 and 7.43.
Comparing both stocks, SLAB delivered the highest market performance with strong positive gains, whereas INDI faced substantial losses, indicating a clear divergence in investor sentiment and price direction.
Target Prices
Analysts provide a clear consensus on target prices for both Silicon Laboratories Inc. and indie Semiconductor, Inc.
| Company | Target High | Target Low | Consensus |
|---|---|---|---|
| Silicon Laboratories Inc. | 165 | 130 | 151.67 |
| indie Semiconductor, Inc. | 8 | 8 | 8 |
For Silicon Laboratories Inc., the consensus target price of 151.67 USD is very close to its current price of 152.82 USD, indicating a stable outlook. indie Semiconductor’s target consensus at 8 USD suggests significant upside potential from its current price of 4.23 USD.
Analyst Opinions Comparison
This section compares analysts’ ratings and financial grades for Silicon Laboratories Inc. (SLAB) and indie Semiconductor, Inc. (INDI):
Rating Comparison
SLAB Rating
- Rating: C- with a very favorable status overall.
- Discounted Cash Flow Score: 2, indicating moderate valuation based on cash flow.
- ROE Score: 1, showing very unfavorable efficiency in generating profit.
- ROA Score: 1, indicating very unfavorable asset utilization.
- Debt To Equity Score: 1, reflecting very unfavorable financial risk.
- Overall Score: 1, assessed as very unfavorable financial standing.
INDI Rating
- Rating: C- with a very favorable status overall.
- Discounted Cash Flow Score: 1, indicating a very unfavorable valuation.
- ROE Score: 1, showing very unfavorable efficiency in generating profit.
- ROA Score: 1, indicating very unfavorable asset utilization.
- Debt To Equity Score: 1, reflecting very unfavorable financial risk.
- Overall Score: 1, assessed as very unfavorable financial standing.
Which one is the best rated?
Based strictly on the provided data, both SLAB and INDI share identical overall ratings and scores except SLAB has a moderately better discounted cash flow score, while the rest of their financial metrics are equally very unfavorable.
Scores Comparison
Here is a comparison of the Altman Z-Score and Piotroski Score for the two companies:
SLAB Scores
- Altman Z-Score: 18.02, indicating a safe zone with very low bankruptcy risk.
- Piotroski Score: 4, reflecting average financial strength and value.
INDI Scores
- Altman Z-Score: 0.12, indicating distress zone and high bankruptcy risk.
- Piotroski Score: 2, indicating very weak financial strength and value.
Which company has the best scores?
Based strictly on the provided data, SLAB shows a much stronger financial position with a safe zone Altman Z-Score and an average Piotroski Score. INDI scores indicate financial distress and very weak strength, making SLAB’s scores superior in this comparison.
Grades Comparison
Here is a comparison of the latest available grades from reputable grading companies for Silicon Laboratories Inc. and indie Semiconductor, Inc.:
Silicon Laboratories Inc. Grades
The table below shows recent grades assigned by well-known financial firms for Silicon Laboratories Inc.:
| Grading Company | Action | New Grade | Date |
|---|---|---|---|
| Morgan Stanley | Maintain | Equal Weight | 2025-08-06 |
| Susquehanna | Maintain | Neutral | 2025-08-06 |
| Barclays | Maintain | Equal Weight | 2025-08-05 |
| Susquehanna | Maintain | Neutral | 2025-07-22 |
| Stifel | Maintain | Buy | 2025-07-18 |
| Keybanc | Maintain | Overweight | 2025-07-08 |
| Benchmark | Maintain | Buy | 2025-05-27 |
| Benchmark | Maintain | Buy | 2025-05-14 |
| Susquehanna | Maintain | Neutral | 2025-05-14 |
| Needham | Maintain | Buy | 2025-05-14 |
Overall, Silicon Laboratories Inc. has predominantly received “Buy” and “Equal Weight”/”Neutral” ratings, reflecting a balanced outlook with a slight positive bias.
indie Semiconductor, Inc. Grades
The following table presents recent grades from recognized firms for indie Semiconductor, Inc.:
| Grading Company | Action | New Grade | Date |
|---|---|---|---|
| UBS | Maintain | Neutral | 2025-11-10 |
| Benchmark | Maintain | Buy | 2025-06-25 |
| Benchmark | Maintain | Buy | 2025-06-11 |
| Benchmark | Maintain | Buy | 2025-05-21 |
| Benchmark | Maintain | Buy | 2025-05-13 |
| Craig-Hallum | Maintain | Buy | 2025-05-13 |
| Keybanc | Maintain | Overweight | 2025-05-13 |
| Benchmark | Maintain | Buy | 2025-04-09 |
| Benchmark | Maintain | Buy | 2025-02-21 |
| Keybanc | Maintain | Overweight | 2025-02-21 |
indie Semiconductor, Inc. consistently holds a majority of “Buy” and “Overweight” ratings, with a few “Neutral” assessments, indicating generally favorable analyst sentiment.
Which company has the best grades?
Both companies have a consensus “Buy” rating, but indie Semiconductor, Inc. exhibits a stronger bias toward “Buy” and “Overweight” grades from multiple firms, suggesting a more uniformly positive analyst outlook. This may imply higher confidence among analysts for indie Semiconductor’s growth prospects compared to Silicon Laboratories Inc., which shows a more mixed range including several neutral ratings. Investors might interpret these differences as signals of varying risk and reward profiles.
Strengths and Weaknesses
The table below summarizes the key strengths and weaknesses of Silicon Laboratories Inc. (SLAB) and indie Semiconductor, Inc. (INDI) based on their latest financial and operational data.
| Criterion | Silicon Laboratories Inc. (SLAB) | indie Semiconductor, Inc. (INDI) |
|---|---|---|
| Diversification | Moderate: Industrial & Commercial segment dominant; some historical IoT exposure | Low: Primarily Product segment with smaller Service segment |
| Profitability | Weak: Negative net margin (-32.7%), negative ROIC (-14.7%), value destroying | Very weak: Larger negative net margin (-61.2%), negative ROIC (-19.3%), value destroying |
| Innovation | Moderate: Historically active in IoT and infrastructure | Moderate: Focus on semiconductor products with R&D investment |
| Global presence | Established in multiple industrial markets globally | Less diversified globally, more niche semiconductor focus |
| Market Share | Moderate: Competes in specialized industrial and IoT markets | Small: Niche semiconductor player with limited scale |
Key takeaways: Both companies face significant profitability challenges, reflected in negative returns on invested capital and declining value creation. SLAB benefits from broader market exposure and moderate innovation, while INDI’s limited diversification and higher losses increase investment risk. Caution is advised given the unfavorable financial health of both.
Risk Analysis
Below is a comparative risk table for Silicon Laboratories Inc. (SLAB) and indie Semiconductor, Inc. (INDI) based on the most recent 2024 data:
| Metric | Silicon Laboratories Inc. (SLAB) | indie Semiconductor, Inc. (INDI) |
|---|---|---|
| Market Risk | Beta 1.55, moderate volatility | Beta 2.54, high volatility |
| Debt level | Very low debt (D/E 0.01) | Moderate debt (D/E 0.95) |
| Regulatory Risk | Moderate, semiconductor industry | Moderate, automotive semiconductor focus |
| Operational Risk | Average, product diversification | Higher, early-stage with high losses |
| Environmental Risk | Moderate, standard tech impact | Moderate, automotive supply chain |
| Geopolitical Risk | US and China exposure | US focused, lower international exposure |
The most impactful risks are market volatility and operational losses. INDI shows significantly higher market risk and financial distress with a low Altman Z-score (0.12) and very weak Piotroski score (2), indicating elevated bankruptcy risk. SLAB, while showing unfavorable profitability and cash flow ratios, maintains a strong Altman Z-score (18.0) suggesting financial stability despite operational challenges. Investors should be cautious with INDI due to its financial fragility and higher leverage.
Which Stock to Choose?
Silicon Laboratories Inc. (SLAB) shows a declining income trend with a 25.29% revenue drop in 2024 and mostly unfavorable profitability metrics, including negative net margin (-32.69%) and returns on equity (-17.69%). Its debt levels are low with favorable debt-to-equity ratios, but the overall financial ratios and rating remain unfavorable, reflecting value destruction and a very unfavorable moat.
Indie Semiconductor, Inc. (INDI) experiences a slight revenue decline (-2.91% in 2024) but shows mixed income growth with favorable gross margin and net margin improvements. Profitability remains negative with a net margin of -61.2% and a weak return on equity (-31.73%). Debt is higher compared to SLAB but still neutral in evaluation. The overall financial ratios and rating are unfavorable, and the company is in a distress zone with a very weak Piotroski score.
For investors seeking growth potential, Indie Semiconductor’s more favorable income growth and gross margin recovery may appear attractive despite its financial weaknesses. Conversely, Silicon Laboratories’ stronger balance sheet and lower debt might appeal to those prioritizing financial stability, though both companies currently show value destruction and unfavorable overall financial health.
Disclaimer: Investment carries a risk of loss of initial capital. The past performance is not a reliable indicator of future results. Be sure to understand risks before making an investment decision.
Go Further
I encourage you to read the complete analyses of Silicon Laboratories Inc. and indie Semiconductor, Inc. to enhance your investment decisions: