Home > Comparison > Technology > SLAB vs CEVA
The strategic rivalry between Silicon Laboratories Inc. and CEVA, Inc. shapes the semiconductor industry’s innovation frontier. Silicon Laboratories operates as a fabless semiconductor firm, focusing on analog-intensive mixed-signal solutions. In contrast, CEVA licenses wireless connectivity and smart sensing technologies, emphasizing intellectual property and AI-driven platforms. This analysis compares their distinct models to identify which offers a superior risk-adjusted return, guiding portfolio decisions in a dynamic technology landscape.
Table of contents
Companies Overview
Silicon Laboratories Inc. and CEVA, Inc. both shape key segments of the semiconductor industry, driving innovation in IoT and wireless technologies.
Silicon Laboratories Inc.: Fabless Semiconductor Innovator
Silicon Laboratories Inc. stands as a fabless semiconductor company specializing in analog-intensive mixed-signal solutions. Its core revenue stems from wireless microcontrollers and sensor products deployed across IoT applications like smart metering and industrial automation. In 2026, the company emphasizes expanding its product reach for connected home and security markets, leveraging its strong market position in mixed-signal technologies.
CEVA, Inc.: Wireless IP Licensing Leader
CEVA, Inc. operates as a licensor of wireless connectivity and smart sensing technologies, providing digital signal processors and AI platforms to semiconductor and OEM firms. Revenue primarily comes from licensing its DSP-based platforms for 5G, AI, and IoT applications. The strategic focus in 2026 centers on enhancing AI processor capabilities and expanding wireless IP licensing across mobile, automotive, and industrial sectors.
Strategic Collision: Similarities & Divergences
Both companies compete in the broad semiconductor ecosystem but with contrasting models—Silicon Labs designs and sells hardware products, while CEVA licenses intellectual property. Their primary battleground is IoT, where connected devices demand both integrated hardware and cutting-edge wireless protocols. This divergence creates distinct investment profiles: Silicon Labs offers exposure to product-driven growth, while CEVA emphasizes scalable licensing revenue streams.
Income Statement Comparison
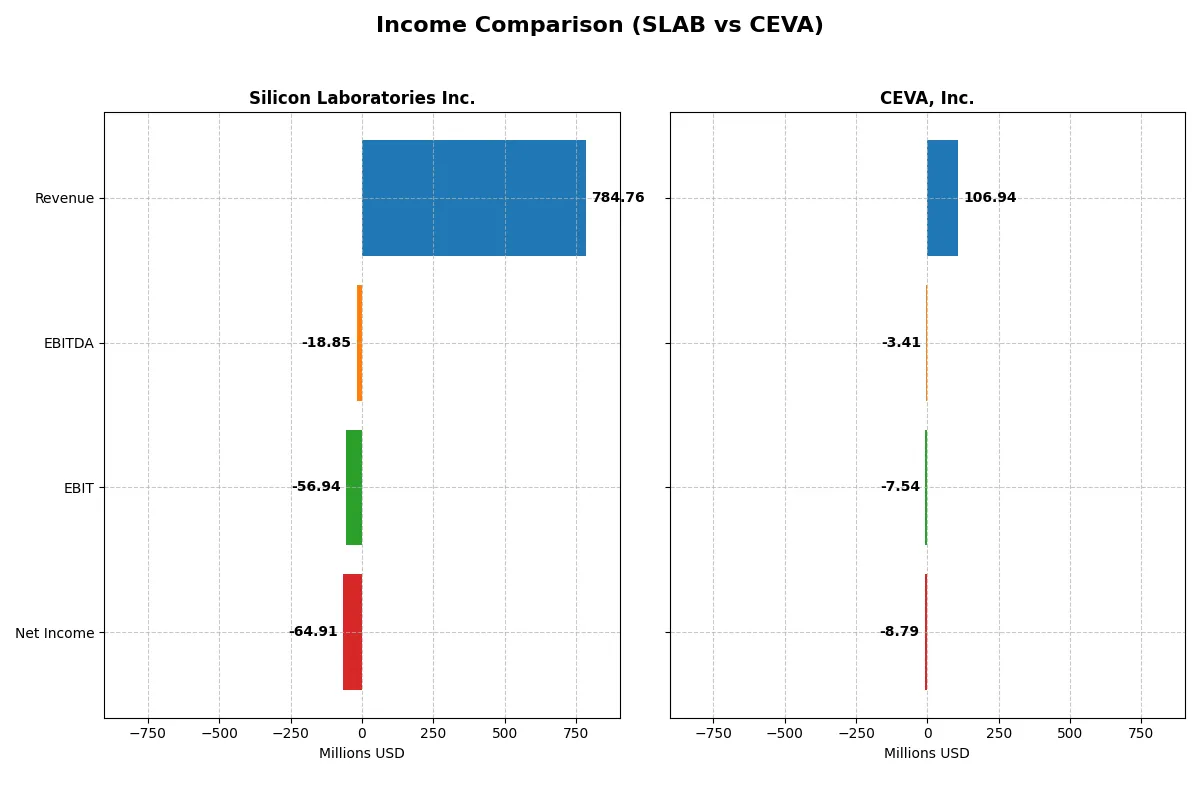
This data dissects the core profitability and scalability of both corporate engines to reveal who dominates the bottom line:
| Metric | Silicon Laboratories Inc. (SLAB) | CEVA, Inc. (CEVA) |
|---|---|---|
| Revenue | 785M | 107M |
| Cost of Revenue | 328M | 13M |
| Operating Expenses | 528M | 102M |
| Gross Profit | 457M | 94M |
| EBITDA | -19M | -3.4M |
| EBIT | -57M | -7.5M |
| Interest Expense | 975K | 0 |
| Net Income | -65M | -8.8M |
| EPS | -1.98 | -0.37 |
| Fiscal Year | 2025 | 2024 |
Income Statement Analysis: The Bottom-Line Duel
This income statement comparison unveils the true operational efficiency and profitability dynamics of these two technology firms.
Silicon Laboratories Inc. Analysis
Silicon Laboratories’ revenue shows a mixed trajectory, peaking above 1B in 2022 before declining to 785M in 2025. Despite a strong 58.2% gross margin, the company endures persistent net losses, hitting -65M in 2025. Its improving margins and 34% revenue growth in the last year signal momentum, yet operating losses reveal ongoing efficiency challenges.
CEVA, Inc. Analysis
CEVA demonstrates steady revenue growth, reaching 107M in 2024, supported by an impressive 88% gross margin. However, net income remains negative, with a -8.8M loss in 2024 despite margin improvements and a nearly 10% revenue increase. CEVA’s efficient cost management narrows losses, yet consistent negative net margins highlight profitability constraints.
Margin Strength vs. Profitability Recovery
Silicon Laboratories boasts higher revenue scale but grapples with widening net losses, while CEVA excels in gross margin efficiency yet struggles to convert this into profits. Silicon Labs’ larger revenue base and recent margin gains position it better for operational leverage. Investors preferring growth with improving margins may favor Silicon Labs; those valuing high gross margins despite current losses might lean toward CEVA.
Financial Ratios Comparison
These vital ratios act as a diagnostic tool to expose the underlying fiscal health, valuation premiums, and capital efficiency of the companies compared below:
| Ratios | Silicon Laboratories Inc. (SLAB) | CEVA, Inc. (CEVA) |
|---|---|---|
| ROE | -5.9% | -3.3% |
| ROIC | -6.3% | -2.7% |
| P/E | -65.9x | -84.8x |
| P/B | 3.91 | 2.79 |
| Current Ratio | 4.69 | 7.09 |
| Quick Ratio | 4.02 | 7.09 |
| D/E | 0 | 0.0219 |
| Debt-to-Assets | 0 | 1.8% |
| Interest Coverage | -72.3x | 0 |
| Asset Turnover | 0.62 | 0.35 |
| Fixed Asset Turnover | 6.10 | 8.43 |
| Payout ratio | 0% | 0% |
| Dividend yield | 0% | 0% |
| Fiscal Year | 2025 | 2024 |
Efficiency & Valuation Duel: The Vital Signs
Ratios act as a company’s DNA, revealing hidden risks and operational excellence that raw numbers alone cannot expose.
Silicon Laboratories Inc.
Silicon Laboratories reveals weak profitability with negative ROE and margins, signaling operational challenges. Its P/E is unusually negative but suggests low earnings quality. The stock trades at a stretched price-to-book ratio near 3.9. Silicon Labs returns no dividends, instead reallocating capital aggressively into R&D, investing 45% of revenue to drive future growth.
CEVA, Inc.
CEVA’s profitability metrics also fall short, showing negative ROE and net margins close to Silicon Labs. Its P/E ratio is even more negative, but its price-to-book ratio is more moderate at 2.79, indicating less valuation stretch. Like Silicon Labs, CEVA pays no dividends and prioritizes reinvestment, dedicating nearly 67% of revenue to R&D, aiming for long-term innovation.
Premium Valuation vs. Growth Intensity
Both companies face profitability headwinds and high valuation risks, reflected in negative ROE and net margins. Silicon Labs carries a pricier book multiple but invests slightly less in R&D than CEVA. Investors seeking a more intense growth profile may prefer CEVA’s heavier reinvestment, while those wary of valuation stretch might find Silicon Labs less appealing.
Which one offers the Superior Shareholder Reward?
Silicon Laboratories Inc. (SLAB) and CEVA, Inc. both eschew dividends, focusing on reinvestment and buybacks. SLAB shows no dividend yield and zero payout, but its free cash flow per share reached a positive 2.01 in 2025, supporting moderate buyback potential. CEVA also pays no dividends, with minimal free cash flow at 0.02 in 2024, signaling limited buyback scope. SLAB’s stronger cash reserves and higher operating cash flow ratio imply a more sustainable buyback strategy. CEVA’s high price-to-free-cash-flow ratio at 1444 signals overvaluation and buyback risk. I find SLAB offers a superior total shareholder return profile in 2026 due to its healthier free cash flow and more prudent capital allocation.
Comparative Score Analysis: The Strategic Profile
The radar chart reveals the fundamental DNA and trade-offs of Silicon Laboratories Inc. and CEVA, Inc., highlighting their financial strengths and valuation nuances:
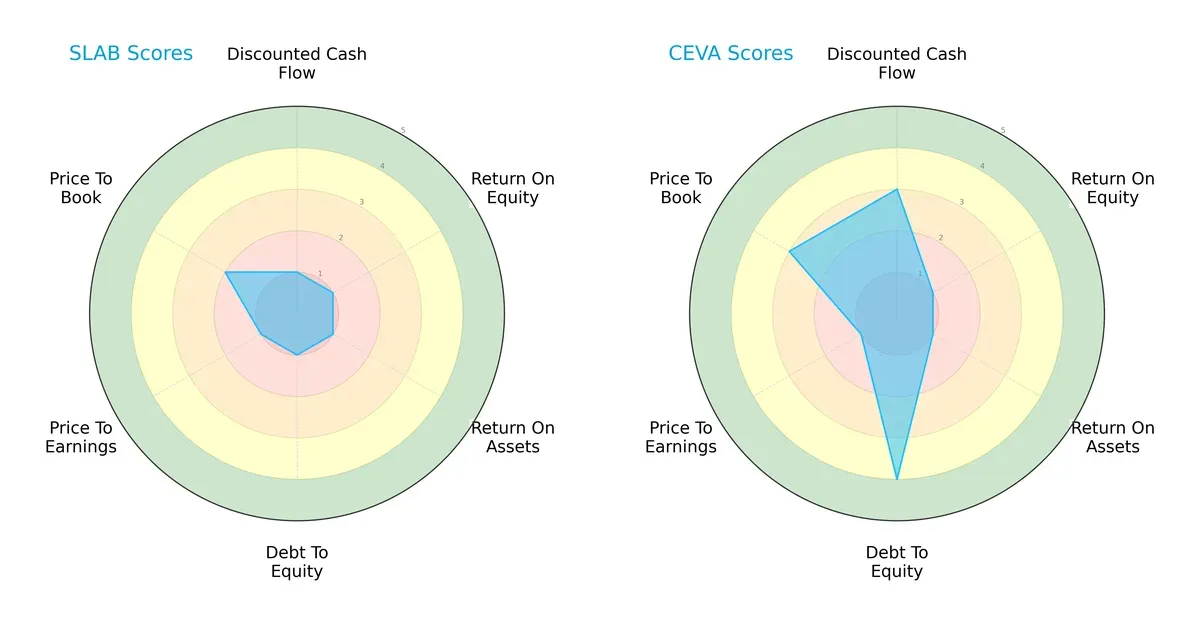
Silicon Laboratories exhibits uniformly low scores across DCF, ROE, ROA, Debt/Equity, and valuation metrics, reflecting a broadly weak financial profile. CEVA, however, shows strength in Debt/Equity with a favorable score of 4, indicating better balance sheet management. CEVA’s elevated DCF and Price-to-Book scores suggest some valuation appeal, though its profitability scores (ROE and ROA) remain weak. CEVA’s profile is more balanced due to diversified strengths, whereas Silicon Laboratories relies on no clear competitive edge.
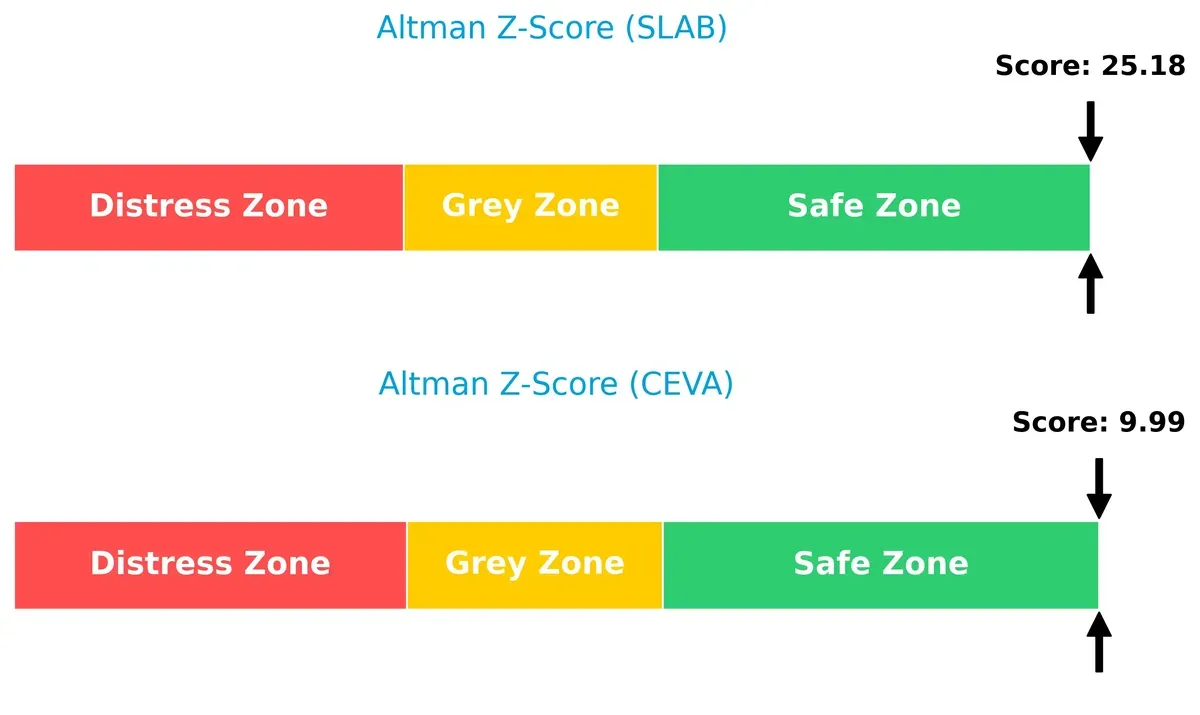
Bankruptcy Risk: Solvency Showdown
Silicon Laboratories and CEVA both reside in the safe zone per Altman Z-Scores, with Silicon Laboratories scoring a commanding 25.2 versus CEVA’s 10.0, implying superior long-term survival prospects for Silicon Laboratories in this cycle:
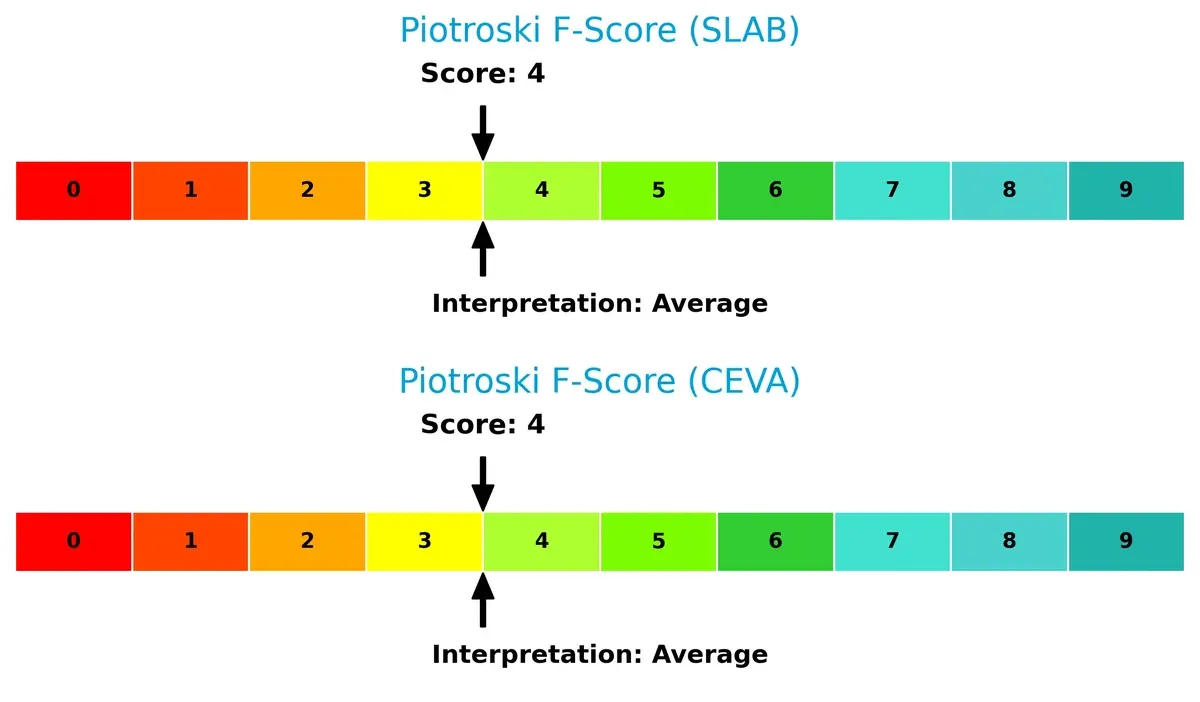
Financial Health: Quality of Operations
Both companies present identical Piotroski F-Scores of 4, indicating average financial health. Neither exhibits peak operational quality, signaling caution on internal metrics for investors:
How are the two companies positioned?
This section dissects SLAB and CEVA’s operational DNA by comparing their revenue distribution and internal dynamics. The goal is to confront their economic moats and identify which model offers the most resilient, sustainable advantage today.
Revenue Segmentation: The Strategic Mix
This visual comparison dissects how Silicon Laboratories Inc. and CEVA, Inc. diversify their income streams and reveals where their primary sector bets lie:
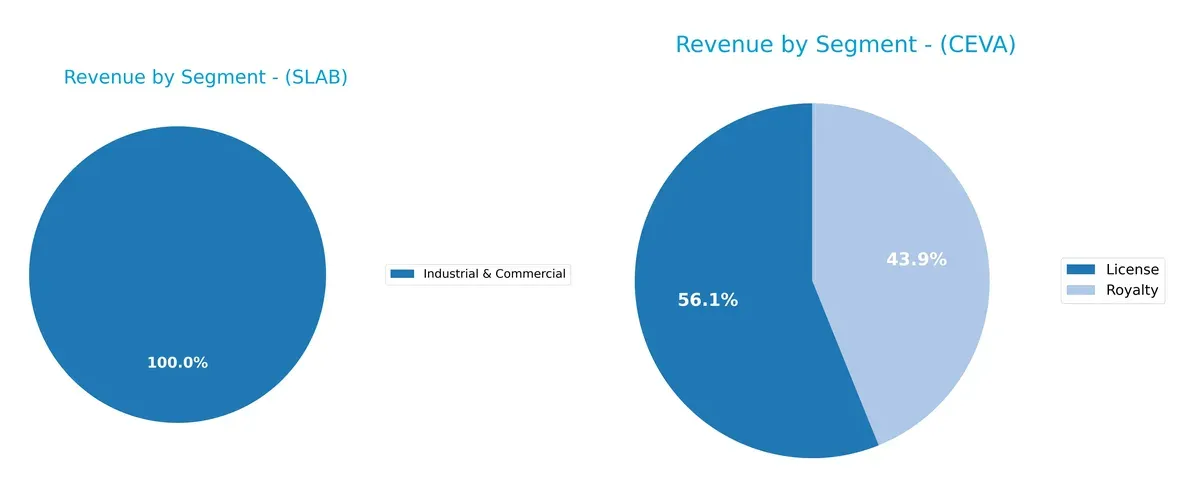
Silicon Laboratories anchors its revenue heavily in Industrial & Commercial, posting $497M in 2023, indicating significant concentration risk. CEVA, by contrast, splits roughly evenly between License ($60M) and Royalty ($47M) streams in 2024, showing a more diversified model. Silicon Labs’ reliance on a single dominant segment risks exposure to market cyclicality, while CEVA’s balanced licensing and royalties suggest a stable, ecosystem-lock-in strategy that cushions volatility.
Strengths and Weaknesses Comparison
This table compares the Strengths and Weaknesses of Silicon Laboratories Inc. (SLAB) and CEVA, Inc. (CEVA):
SLAB Strengths
- Diverse industrial and commercial revenue segments
- Strong fixed asset turnover at 6.1
- Zero debt and low debt-to-assets ratio
- Favorable quick ratio at 4.02
- Global sales spread across China, US, Taiwan, and rest of world
CEVA Strengths
- Favorable quick ratio at 7.09
- Low debt-to-assets ratio at 1.8% with minimal debt
- Strong fixed asset turnover at 8.43
- Revenue diversification between licenses and royalties
- Presence in Asia Pacific, China, Europe, and US markets
SLAB Weaknesses
- Negative net margin (-8.27%) and ROE (-5.93%)
- Unfavorable interest coverage at -58.4
- High price-to-book ratio at 3.91
- Unfavorable current ratio despite liquidity measures
- Declining revenue in recent years
- Global revenue heavily reliant on China and rest of world
CEVA Weaknesses
- Negative net margin (-8.22%) and ROE (-3.3%)
- Unfavorable asset turnover at 0.35
- Interest coverage at zero signals potential cash flow issues
- Unfavorable current ratio despite strong quick ratio
- Highly concentrated revenue streams in licenses and royalties
- Revenue exposure concentrated in Asia Pacific and China
Both companies face profitability challenges with negative returns and interest coverage concerns. SLAB shows stronger liquidity but higher valuation risk. CEVA benefits from very low debt and higher fixed asset efficiency but suffers from weaker asset turnover and geographic concentration. These factors critically shape their strategic options for improving financial health and market reach.
The Moat Duel: Analyzing Competitive Defensibility
A structural moat is the only shield protecting long-term profits from relentless competitive erosion. Let’s dissect the moats of Silicon Laboratories Inc. and CEVA, Inc.:
Silicon Laboratories Inc.: Intangible Assets Driving Innovation
Silicon Labs leverages deep analog and mixed-signal IP, reflected in stable gross margins near 58%. However, declining ROIC signals weakening capital efficiency. New IoT markets could either deepen or strain this moat in 2026.
CEVA, Inc.: Licensing Network Effects and AI DSP Platforms
CEVA’s moat rests on its licensing model and broad DSP portfolio, evidenced by an 88% gross margin. Yet, a steep ROIC decline questions long-term value creation. Expansion into 5G and AI offers growth upside but also competitive risks.
Capital Efficiency vs. Licensing Prowess: Who Holds the Stronger Moat?
Both firms exhibit very unfavorable ROIC trends, signaling value destruction despite solid gross margins. Silicon Labs’ intangible asset base offers more tangible innovation advantages, making its moat potentially deeper. I see Silicon Labs better positioned to defend its niche amid evolving IoT demands.
Which stock offers better returns?
Over the past 12 months, Silicon Laboratories Inc. surged 57.75%, showing clear acceleration and a strong bullish run. CEVA, Inc. declined 2.72%, marking a bearish trend despite recent modest recovery.
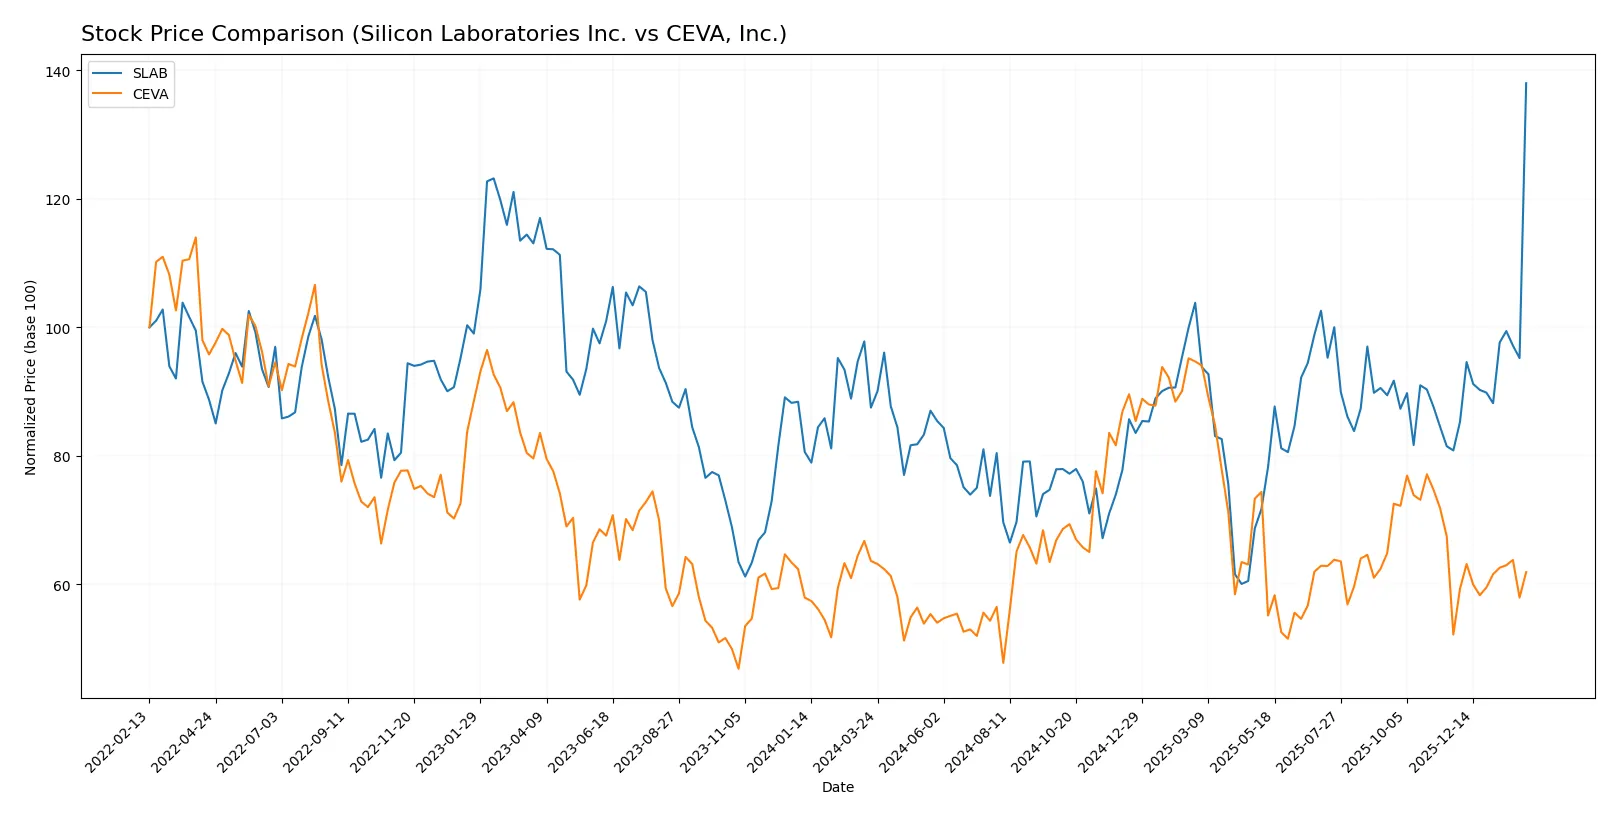
Trend Comparison
Silicon Laboratories Inc. posted a bullish 57.75% gain over the past year with accelerating momentum and high volatility (std. dev. 16.2). It reached a peak price of 206.5 and a low of 89.82.
CEVA, Inc. experienced a bearish 2.72% decline despite accelerating trend and low volatility (std. dev. 4.41). Its price fluctuated between 17.39 and 34.67, with recent mild recovery of 18.63%.
Silicon Laboratories clearly outperformed CEVA, delivering far superior market returns and stronger upward momentum over the analyzed period.
Target Prices
Analysts show a generally bullish outlook with clear upside potential for both Silicon Laboratories Inc. and CEVA, Inc.
| Company | Target Low | Target High | Consensus |
|---|---|---|---|
| Silicon Laboratories Inc. | 160 | 231 | 211.6 |
| CEVA, Inc. | 28 | 28 | 28 |
Silicon Laboratories’ consensus target of 211.6 suggests modest upside from the current 206.5 price. CEVA’s target at 28 implies a strong 24% premium above its 22.54 price, signaling robust analyst confidence.

Don’t Let Luck Decide Your Entry Point
Optimize your entry points with our advanced ProRealTime indicators. You’ll get efficient buy signals with precise price targets for maximum performance. Start outperforming now!
How do institutions grade them?
Silicon Laboratories Inc. Grades
Here are recent institutional grades and rating actions for Silicon Laboratories Inc.:
| Grading Company | Action | New Grade | Date |
|---|---|---|---|
| Citigroup | Maintain | Neutral | 2026-02-06 |
| RBC Capital | Maintain | Sector Perform | 2026-02-05 |
| Keybanc | Downgrade | Sector Weight | 2026-02-04 |
| Benchmark | Downgrade | Hold | 2026-02-04 |
| Needham | Downgrade | Hold | 2026-02-04 |
| Susquehanna | Maintain | Neutral | 2025-08-06 |
| Morgan Stanley | Maintain | Equal Weight | 2025-08-06 |
| Barclays | Maintain | Equal Weight | 2025-08-05 |
| Susquehanna | Maintain | Neutral | 2025-07-22 |
| Stifel | Maintain | Buy | 2025-07-18 |
CEVA, Inc. Grades
The following table shows recent grades and rating actions for CEVA, Inc.:
| Grading Company | Action | New Grade | Date |
|---|---|---|---|
| Barclays | Maintain | Overweight | 2025-11-12 |
| Rosenblatt | Maintain | Buy | 2025-11-11 |
| Rosenblatt | Maintain | Buy | 2025-08-14 |
| Oppenheimer | Maintain | Outperform | 2025-05-09 |
| Rosenblatt | Maintain | Buy | 2025-05-08 |
| Barclays | Maintain | Overweight | 2025-05-08 |
| Rosenblatt | Maintain | Buy | 2025-04-23 |
| Barclays | Maintain | Overweight | 2025-02-14 |
| Rosenblatt | Maintain | Buy | 2025-02-14 |
| Rosenblatt | Maintain | Buy | 2025-02-11 |
Which company has the best grades?
CEVA, Inc. consistently earns Buy and Overweight ratings, indicating strong institutional confidence. Silicon Laboratories Inc. shows mixed ratings with multiple downgrades. This difference may affect investor sentiment and portfolio positioning.
Risks specific to each company
The following categories identify the critical pressure points and systemic threats facing both firms in the 2026 market environment:
1. Market & Competition
Silicon Laboratories Inc.
- Faces intense competition in analog and mixed-signal semiconductors amid rapid IoT evolution.
CEVA, Inc.
- Competes in DSP and AI processor licensing with pressure from tech innovation and adoption cycles.
2. Capital Structure & Debt
Silicon Laboratories Inc.
- Zero debt, strong balance sheet but negative interest coverage signals operational losses.
CEVA, Inc.
- Minimal debt (2%), manageable leverage, but zero interest coverage hints at financial stress.
3. Stock Volatility
Silicon Laboratories Inc.
- Beta of 1.54 indicates high sensitivity to market swings, increasing investment risk.
CEVA, Inc.
- Beta of 1.50 also reflects elevated volatility typical in tech licensing firms.
4. Regulatory & Legal
Silicon Laboratories Inc.
- Operates globally, exposed to complex export controls and IP protection challenges.
CEVA, Inc.
- Licensing model vulnerable to IP litigation and evolving data security regulations.
5. Supply Chain & Operations
Silicon Laboratories Inc.
- Fabless model relies on foundry partners; supply chain disruptions can delay product delivery.
CEVA, Inc.
- Relies on semiconductor manufacturers for IP integration, sensitive to chipset supply constraints.
6. ESG & Climate Transition
Silicon Laboratories Inc.
- Increasing pressure to reduce carbon footprint in manufacturing and product lifecycle.
CEVA, Inc.
- Faces ESG scrutiny on sustainable tech innovation and ethical supply chain management.
7. Geopolitical Exposure
Silicon Laboratories Inc.
- Significant China exposure risks tariffs and regulatory barriers amid US-China tensions.
CEVA, Inc.
- Global licensing exposes CEVA to geopolitical risks affecting cross-border tech transfers.
Which company shows a better risk-adjusted profile?
Silicon Laboratories’ biggest risk lies in operational losses despite strong liquidity and zero debt. CEVA’s primary concern is its fragile financial health with minimal interest coverage and lower asset efficiency. Both face unfavorable profitability, but Silicon Labs’ robust capital structure offers a safer cushion. Recent data show Silicon Labs’ zero debt contrasts with CEVA’s slight leverage, justifying greater prudence on CEVA’s risk profile.
Final Verdict: Which stock to choose?
Silicon Laboratories Inc. (SLAB) excels as a growth engine fueled by strong revenue momentum and robust R&D investment. Its superpower lies in rapid innovation and operational scale, although the consistent value destruction signals a point of vigilance. SLAB suits aggressive growth portfolios willing to tolerate volatility for potential market leadership.
CEVA, Inc. stands out with its strategic moat in specialized licensing and intellectual property, offering more financial stability than SLAB. Its recurring revenue model provides a cushion against cyclicality, fitting portfolios targeting GARP—growth at a reasonable price—with moderate risk tolerance.
If you prioritize aggressive growth and innovation-driven upside, SLAB is the compelling choice due to its strong topline expansion and R&D focus despite profitability challenges. However, if you seek more stability with a defensible niche and recurring revenue, CEVA offers better risk management though it commands a cautious valuation stance.
Disclaimer: Investment carries a risk of loss of initial capital. The past performance is not a reliable indicator of future results. Be sure to understand risks before making an investment decision.
Go Further
I encourage you to read the complete analyses of Silicon Laboratories Inc. and CEVA, Inc. to enhance your investment decisions: