In the fast-evolving technology sector, Shopify Inc. and Workday, Inc. stand out as leaders in application software, each driving innovation in distinct yet overlapping markets. Shopify revolutionizes commerce platforms for merchants worldwide, while Workday excels in enterprise cloud solutions for finance and human capital management. This comparison explores their strengths and growth potential, helping you decide which company aligns best with your investment goals. Let’s uncover which stock deserves a place in your portfolio.
Table of contents
Companies Overview
I will begin the comparison between Shopify and Workday by providing an overview of these two companies and their main differences.
Shopify Overview
Shopify Inc. is a commerce company headquartered in Ottawa, Canada, offering a comprehensive commerce platform that enables merchants to manage and sell products through multiple channels, including online storefronts and physical locations. Its services cover product management, payment processing, order fulfillment, and merchant solutions such as financing and shipping. Shopify operates globally with a market cap of approximately 205B USD.
Workday Overview
Workday, Inc., based in Pleasanton, California, provides enterprise cloud applications focused on financial management, human capital management, and analytics. Its software helps organizations plan, execute, and analyze business operations across industries like healthcare, finance, and retail. Workday has a market cap near 51B USD and employs over 20K people, emphasizing cloud spend management and workforce lifecycle solutions.
Key similarities and differences
Both Shopify and Workday operate in the software application industry, offering cloud-based platforms to improve business operations. Shopify focuses on commerce and retail solutions, empowering merchants to sell products globally, while Workday specializes in enterprise resource planning, financial, and human capital management for larger organizations. Their business models differ primarily in target customers and application scope, with Shopify serving merchants and Workday serving enterprises.
Income Statement Comparison
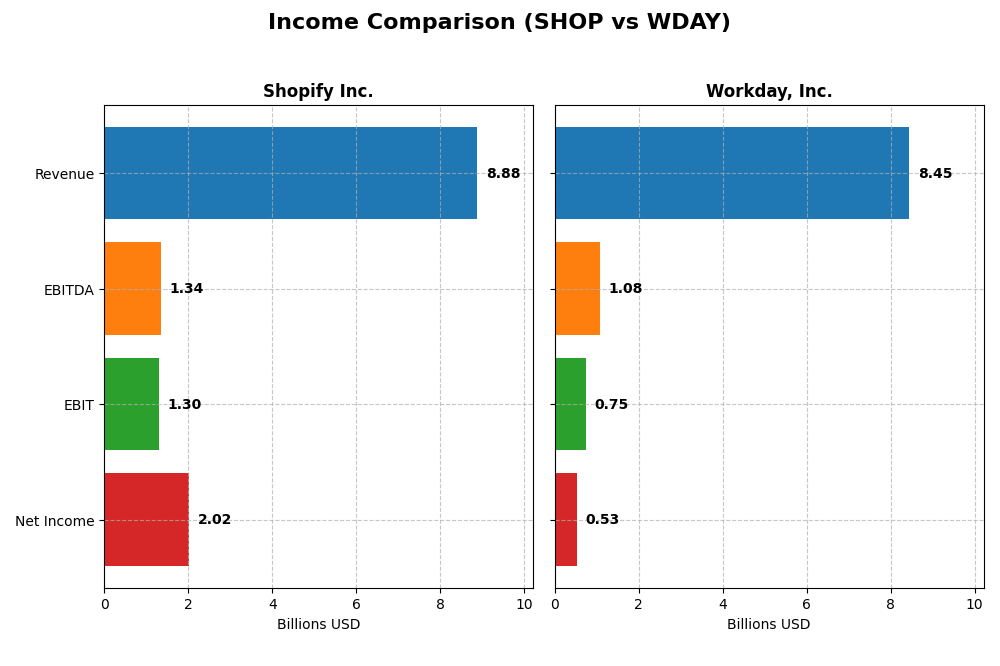
The table below compares key income statement metrics for Shopify Inc. and Workday, Inc. based on their most recent fiscal year data, providing a snapshot of their financial performance.
| Metric | Shopify Inc. (SHOP) | Workday, Inc. (WDAY) |
|---|---|---|
| Market Cap | 205.3B | 50.7B |
| Revenue | 8.88B | 8.45B |
| EBITDA | 1.34B | 1.08B |
| EBIT | 1.30B | 752M |
| Net Income | 2.02B | 526M |
| EPS | 1.56 | 1.98 |
| Fiscal Year | 2024 | 2025 |
Income Statement Interpretations
Shopify Inc.
Shopify’s revenue grew strongly from 3B in 2020 to 8.9B in 2024, with net income shifting from 320M to 2B over the same period. Margins improved significantly, with gross margin at 50.36% and net margin at 22.74%. The 2024 fiscal year showed a robust 25.78% revenue increase and over 1100% net margin growth, signaling a strong operational turnaround.
Workday, Inc.
Workday’s revenue rose steadily from 4.3B in 2021 to 8.4B in 2025, with net income fluctuating but reaching 526M in 2025. Gross margin remained high at 75.5%, while EBIT margin was moderate at 8.9%. Although revenue and EBIT grew well in 2025, net margin and EPS declined sharply by over 60%, indicating some pressure on profitability.
Which one has the stronger fundamentals?
Shopify demonstrates stronger fundamentals with consistent revenue and net income growth, improving margins, and favorable profitability indicators. Workday maintains high gross margins and growing revenues but faces challenges in net margin and EPS reductions. Overall, Shopify’s income statement shows a more robust and favorable growth trajectory compared to Workday’s mixed margin performance.
Financial Ratios Comparison
The table below presents the most recent fiscal year financial ratios for Shopify Inc. and Workday, Inc., highlighting key metrics for comparison.
| Ratios | Shopify Inc. (2024) | Workday, Inc. (2025) |
|---|---|---|
| ROE | 17.47% | 5.82% |
| ROIC | 7.55% | 2.73% |
| P/E | 68.18 | 132.15 |
| P/B | 11.91 | 7.69 |
| Current Ratio | 3.71 | 1.85 |
| Quick Ratio | 3.70 | 1.85 |
| D/E (Debt-to-Equity) | 0.10 | 0.37 |
| Debt-to-Assets | 8.09% | 18.70% |
| Interest Coverage | 0 | 3.64 |
| Asset Turnover | 0.64 | 0.47 |
| Fixed Asset Turnover | 63.43 | 5.36 |
| Payout Ratio | 0 | 0 |
| Dividend Yield | 0 | 0 |
Interpretation of the Ratios
Shopify Inc.
Shopify’s financial ratios show a mixed profile with strong net margin (22.74%) and ROE (17.47%), but weaknesses include a high P/E ratio (68.18) and elevated price-to-book (11.91). The current ratio is high at 3.71 but flagged unfavorable, possibly indicating excess liquidity. Shopify does not pay dividends, likely prioritizing reinvestment in growth and R&D, reflecting its high valuation multiples and strategic focus.
Workday, Inc.
Workday presents a more balanced but less robust ratio set, with neutral net margin (6.23%) and unfavorable returns on equity (5.82%) and invested capital (2.73%). Its valuation metrics are also stretched, with a P/E of 132.15 and P/B of 7.69. Workday does not distribute dividends, consistent with its emphasis on reinvestment and product development, supporting its positioning as a high-growth software firm.
Which one has the best ratios?
Shopify exhibits a slightly more favorable overall ratio profile with 50% favorable metrics against 35.7% unfavorable, compared to Workday’s neutral stance and equal favorable and unfavorable ratio split (42.9% each). Shopify’s superior profitability and return measures contrast with Workday’s more moderate performance and higher leverage, suggesting Shopify currently holds a stronger financial foundation.
Strategic Positioning
This section compares the strategic positioning of Shopify Inc. and Workday, Inc., focusing on market position, key segments, and exposure to technological disruption:
Shopify Inc.
- Leading commerce platform with strong global presence, facing competitive pressure in e-commerce software.
- Key segments: Merchant Solutions and Subscription Solutions driving revenue mainly from commerce-related services.
- Exposure: Adapts to e-commerce technology shifts, but reliant on platform innovation and merchant solutions.
Workday, Inc.
- Enterprise cloud application provider with significant presence in finance and HR sectors, facing moderate competition.
- Key segments: Subscription Services dominate, supplemented by Professional Services focused on enterprise management.
- Exposure: Invests in cloud and augmented analytics, integrating machine learning to enhance enterprise efficiency.
Shopify Inc. vs Workday, Inc. Positioning
Shopify shows a diversified commerce platform targeting multiple sales channels, while Workday concentrates on enterprise cloud applications for finance and HR. Shopify benefits from a broad merchant base, Workday from specialized subscription services with advanced analytics.
Which has the best competitive advantage?
Both companies exhibit a slightly unfavorable moat status, shedding value despite growing ROIC trends. Shopify’s higher ROIC growth suggests improving profitability, but both face challenges in sustaining competitive advantage based on current MOAT evaluations.
Stock Comparison
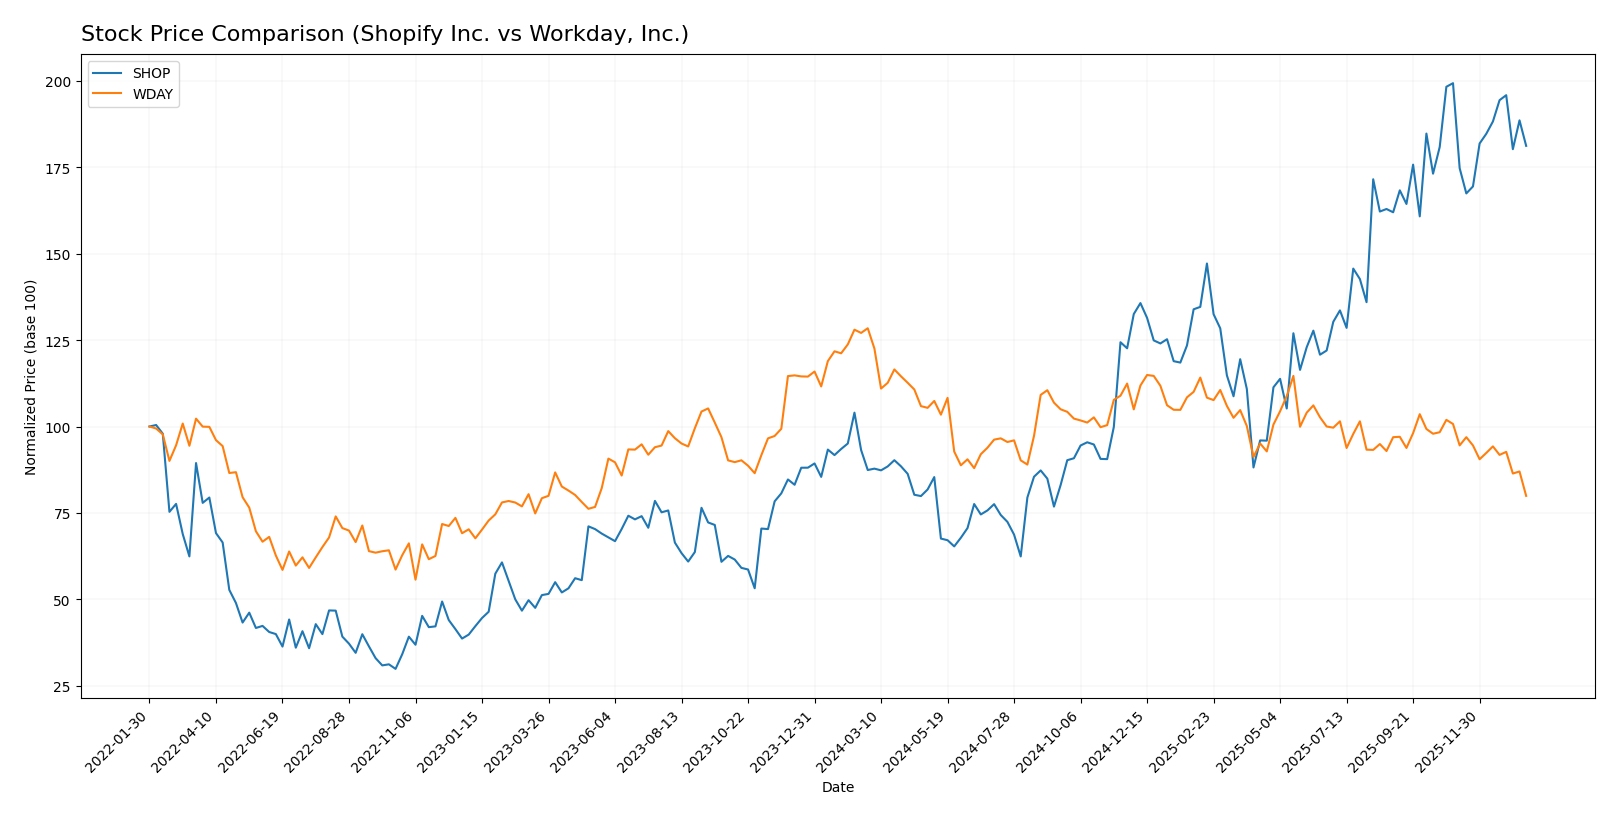
The stock price movements over the past 12 months reveal contrasting trajectories, with Shopify Inc. exhibiting a strong bullish trend and Workday, Inc. showing a notable bearish decline in share value.
Trend Analysis
Shopify Inc.’s stock rose 107.29% over the past year, indicating a bullish trend with deceleration. It traded between 54.43 and 173.86, with volatility reflected by a 33.71 std deviation.
Workday, Inc.’s shares declined 37.76% in the same period, confirming a bearish trend also marked by deceleration. The price range was 190.38 to 305.88, with a 20.13 std deviation indicating moderate volatility.
Comparing the two, Shopify delivered the highest market performance with a strong positive return, whereas Workday experienced a significant negative price trend.
Target Prices
Analysts present a clear consensus on the target prices for Shopify Inc. and Workday, Inc., indicating potential upside from current levels.
| Company | Target High | Target Low | Consensus |
|---|---|---|---|
| Shopify Inc. | 200 | 140 | 186.24 |
| Workday, Inc. | 320 | 235 | 274.47 |
Shopify’s consensus target price of 186.24 USD suggests a moderate upside compared to its current price around 157.71 USD. Workday’s target consensus at 274.47 USD shows a significant expected increase from its current price of about 189.99 USD.
Analyst Opinions Comparison
This section compares analysts’ ratings and grades for Shopify Inc. and Workday, Inc.:
Rating Comparison
Shopify Inc. Rating
- Rating: B indicating a very favorable assessment.
- Discounted Cash Flow Score: Moderate at 2 out of 5.
- ROE Score: Favorable at 4 out of 5, showing good profitability.
- ROA Score: Very favorable at 5 out of 5, highly efficient.
- Debt To Equity Score: Moderate at 3 out of 5, balanced risk.
- Overall Score: Moderate at 3 out of 5.
Workday, Inc. Rating
- Rating: B- indicating a very favorable assessment.
- Discounted Cash Flow Score: Favorable at 4 out of 5.
- ROE Score: Moderate at 3 out of 5, showing average profitability.
- ROA Score: Moderate at 3 out of 5, average asset utilization.
- Debt To Equity Score: Moderate at 2 out of 5, slightly lower risk.
- Overall Score: Moderate at 2 out of 5.
Which one is the best rated?
Shopify holds a higher overall rating of B compared to Workday’s B-, with stronger ROE and ROA scores indicating better profitability and asset efficiency. Workday excels in discounted cash flow but has a lower overall score.
Scores Comparison
The following table compares the Altman Z-Score and Piotroski Score of Shopify Inc. and Workday, Inc.:
SHOP Scores
- Altman Z-Score of 50.42 indicates a safe zone, suggesting very low bankruptcy risk.
- Piotroski Score of 6 reflects average financial strength and investment potential.
WDAY Scores
- Altman Z-Score of 4.41 indicates a safe zone, suggesting low bankruptcy risk.
- Piotroski Score of 6 reflects average financial strength and investment potential.
Which company has the best scores?
Shopify’s significantly higher Altman Z-Score indicates stronger financial stability compared to Workday, although both have equal Piotroski Scores, reflecting similar average financial health.
Grades Comparison
Here is a detailed comparison of the latest grades for Shopify Inc. and Workday, Inc.:
Shopify Inc. Grades
The table below shows recent analyst grades for Shopify Inc. from reputable financial institutions.
| Grading Company | Action | New Grade | Date |
|---|---|---|---|
| Scotiabank | Upgrade | Sector Outperform | 2026-01-08 |
| Wolfe Research | Downgrade | Peer Perform | 2026-01-06 |
| Wells Fargo | Maintain | Overweight | 2025-12-17 |
| Truist Securities | Maintain | Hold | 2025-11-05 |
| CIBC | Maintain | Outperform | 2025-11-05 |
| Cantor Fitzgerald | Maintain | Neutral | 2025-11-05 |
| DA Davidson | Maintain | Buy | 2025-11-05 |
| Scotiabank | Maintain | Sector Perform | 2025-11-05 |
| Needham | Maintain | Buy | 2025-11-05 |
| JP Morgan | Maintain | Overweight | 2025-11-05 |
Shopify’s grades show a mix of “Buy,” “Outperform,” and “Hold” ratings, with recent upgrades and downgrades indicating some analyst divergence but generally positive sentiment.
Workday, Inc. Grades
The following table presents recent grades for Workday, Inc. from established grading firms.
| Grading Company | Action | New Grade | Date |
|---|---|---|---|
| Barclays | Maintain | Overweight | 2026-01-12 |
| RBC Capital | Maintain | Outperform | 2026-01-05 |
| TD Cowen | Maintain | Buy | 2025-11-26 |
| Needham | Maintain | Buy | 2025-11-26 |
| Barclays | Maintain | Overweight | 2025-11-26 |
| Keybanc | Maintain | Overweight | 2025-11-26 |
| JP Morgan | Maintain | Overweight | 2025-11-26 |
| UBS | Maintain | Neutral | 2025-11-26 |
| Citigroup | Maintain | Neutral | 2025-11-26 |
| Wells Fargo | Maintain | Overweight | 2025-11-26 |
Workday’s analyst ratings predominantly consist of “Buy,” “Outperform,” and “Overweight” grades, demonstrating consistent positive analyst confidence.
Which company has the best grades?
Both companies hold a consensus “Buy” rating, but Workday, Inc. has a higher proportion of “Overweight” and “Buy” ratings maintained by multiple analysts, suggesting stronger and more consistent endorsement. This could impact investor perception by indicating steadier confidence in Workday’s growth prospects compared to Shopify’s more mixed recent grade changes.
Strengths and Weaknesses
Below is a comparative overview of key strengths and weaknesses for Shopify Inc. (SHOP) and Workday, Inc. (WDAY) based on recent financial and operational data.
| Criterion | Shopify Inc. (SHOP) | Workday, Inc. (WDAY) |
|---|---|---|
| Diversification | Moderate diversification: largely focused on e-commerce services with strong growth in Merchant Solutions and Subscription segments (6.53B services revenue in 2024). | Moderate diversification: Subscription Services dominate (7.72B in 2025) with a smaller Professional Services segment. |
| Profitability | Favorable net margin (22.74%) and ROE (17.47%), but ROIC (7.55%) below WACC (17.1%), indicating value destruction despite improving profitability. | Lower profitability with net margin at 6.23%, ROE at 5.82%, and ROIC (2.73%) below WACC (8.82%), also shedding value but with positive ROIC trend. |
| Innovation | Strong innovation evidenced by high fixed asset turnover (63.43) and growing ROIC trend, though challenged by high valuation multiples (PE 68.18, PB 11.91). | Innovation steady with moderate fixed asset turnover (5.36) and growing ROIC trend, but also priced expensively (PE 132.15, PB 7.69). |
| Global presence | Strong global footprint driven by e-commerce platform adoption worldwide. | Significant global presence in enterprise cloud solutions with steady subscription growth. |
| Market Share | Large and growing market share in e-commerce platform services. | Leading position in cloud-based HR and financial management software, with expanding subscription base. |
Key takeaways: Both Shopify and Workday are experiencing value destruction as ROIC remains below WACC, despite improving profitability trends. Shopify shows stronger margins and asset efficiency, while Workday maintains steady subscription growth. Investors should weigh high valuations against growth potential and monitor profitability improvements closely.
Risk Analysis
Below is a comparative table outlining key risks for Shopify Inc. (SHOP) and Workday, Inc. (WDAY) based on the most recent data available from 2025-2026:
| Metric | Shopify Inc. (SHOP) | Workday, Inc. (WDAY) |
|---|---|---|
| Market Risk | High beta (2.84) indicates high volatility | Moderate beta (1.14), less volatile |
| Debt level | Low debt-to-equity (0.10), low leverage | Moderate debt-to-equity (0.37) |
| Regulatory Risk | Moderate, operates globally with varied regulations | Moderate, US-centric but with international exposure |
| Operational Risk | Platform dependency and competition risks | SaaS operational risks, dependency on enterprise adoption |
| Environmental Risk | Moderate, tech sector exposure to energy and data center sustainability | Moderate, cloud infrastructure environmental impact |
| Geopolitical Risk | Exposure to multiple regions increases risk | Primarily US-based, lower geopolitical exposure |
The most significant risks for Shopify stem from its high market volatility and elevated valuation multiples, which may lead to price swings impacting investor returns. Workday faces moderate operational and debt-related risks but benefits from a more stable market profile. Both companies operate in regulated environments with evolving compliance demands, requiring careful monitoring.
Which Stock to Choose?
Shopify Inc. (SHOP) shows a strong income evolution with a 25.78% revenue growth in 2024 and consistently favorable profitability metrics, including a 22.74% net margin and a 17.47% ROE. Its financial ratios are slightly favorable overall, supported by low debt levels and high interest coverage, though valuation multiples appear stretched. The company’s rating is very favorable, reflecting solid financial health despite a slightly unfavorable moat indicating value destruction but improving profitability.
Workday, Inc. (WDAY) exhibits favorable income growth, with 16.35% revenue growth in 2025, though net margin growth recently declined. Its financial ratios are neutral overall, with moderate profitability and higher leverage compared to Shopify. Workday’s rating is very favorable, supported by safe-zone Altman Z-Score and average Piotroski Score, but it faces valuation challenges and a slightly unfavorable moat like Shopify, indicating value erosion despite ROIC improvements.
Investors focused on growth might find Shopify’s robust income expansion and profitability appealing, while those prioritizing moderate financial stability could view Workday’s neutral ratio profile and steady rating as indicative of less volatility. Both companies show improving profitability metrics amid value destruction concerns, suggesting a nuanced interpretation based on risk tolerance and investment horizon.
Disclaimer: Investment carries a risk of loss of initial capital. The past performance is not a reliable indicator of future results. Be sure to understand risks before making an investment decision.
Go Further
I encourage you to read the complete analyses of Shopify Inc. and Workday, Inc. to enhance your investment decisions: