In the fast-evolving world of digital commerce and website development, Shopify Inc. and Wix.com Ltd. stand out as influential players. Both companies operate within the technology sector, offering innovative platforms that empower businesses to establish and grow their online presence. While Shopify focuses on comprehensive e-commerce solutions, Wix excels in website creation and customization. This article will help you identify which company offers the most compelling investment opportunity in 2026.

Table of contents
Companies Overview
I will begin the comparison between Shopify Inc. and Wix.com Ltd. by providing an overview of these two companies and their main differences.
Shopify Inc. Overview
Shopify Inc. operates as a commerce company providing a comprehensive commerce platform and services across multiple regions including Canada, the US, Europe, and Asia Pacific. Its platform enables merchants to manage products, inventory, orders, payments, and customer relationships through various sales channels like web storefronts, physical stores, social media, and marketplaces. Headquartered in Ottawa, Canada, Shopify focuses on empowering merchants with tools for e-commerce growth and operational efficiency.
Wix.com Ltd. Overview
Wix.com Ltd. develops and markets a cloud-based platform that enables users worldwide to create websites and web applications easily using drag-and-drop tools and artificial intelligence. Headquartered in Tel Aviv, Israel, Wix offers a suite of products including Wix Editor, Wix ADI, Wix Payments, and a marketplace connecting users with web experts. The company serves millions of registered users, supporting small businesses in building and managing their online presence.
Key similarities and differences
Both Shopify and Wix operate in the technology sector, providing platforms that empower businesses online but differ in focus. Shopify targets e-commerce merchants with comprehensive commerce solutions including payment processing and inventory management, while Wix emphasizes website creation and digital presence tools with added business automation features. Shopify’s market cap is substantially larger at 205B compared to Wix’s 5.6B, reflecting their different scales and market penetration.
Income Statement Comparison
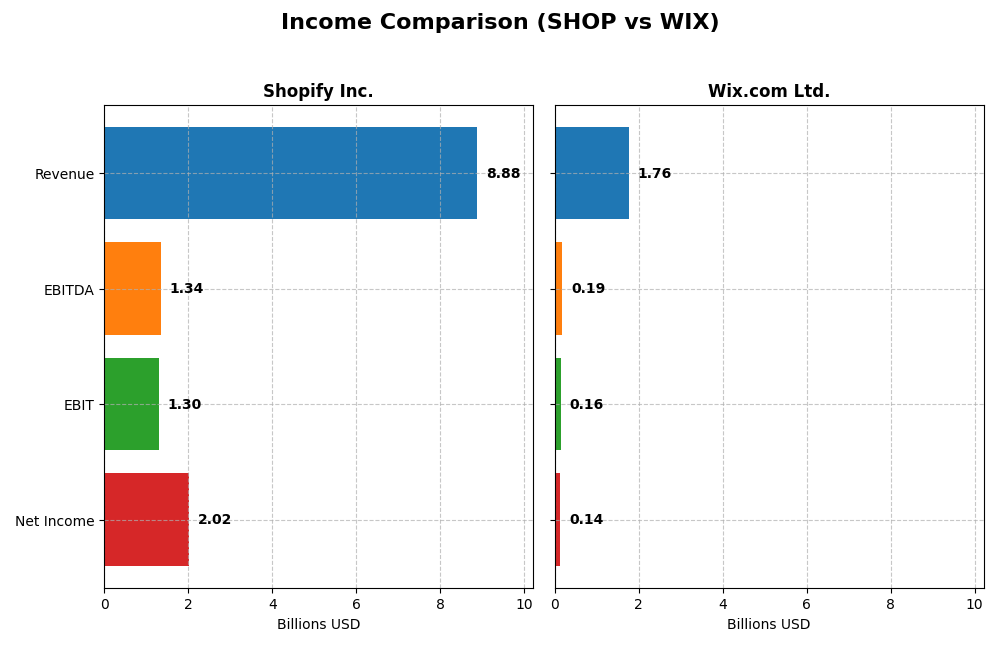
The following table compares the most recent full fiscal year income statement metrics for Shopify Inc. and Wix.com Ltd., highlighting key financial data for investor analysis.
| Metric | Shopify Inc. (SHOP) | Wix.com Ltd. (WIX) |
|---|---|---|
| Market Cap | 205B | 5.6B |
| Revenue | 8.88B | 1.76B |
| EBITDA | 1.34B | 186M |
| EBIT | 1.30B | 155M |
| Net Income | 2.02B | 138M |
| EPS | 1.56 | 2.49 |
| Fiscal Year | 2024 | 2024 |
Income Statement Interpretations
Shopify Inc.
Shopify Inc. demonstrated strong revenue growth from 2020 to 2024, increasing from $2.9B to $8.9B, with net income turning positive and reaching $2.0B in 2024 after previous losses. Margins improved significantly, with a gross margin of 50.36% and a net margin of 22.74% in 2024. The latest year showed accelerated growth in revenue, profitability, and earnings per share, indicating improved operational efficiency.
Wix.com Ltd.
Wix.com Ltd. also showed consistent revenue growth over the period, rising from $984M in 2020 to $1.76B in 2024, with net income recovering from losses to a positive $138M in 2024. Gross margin remained high at 67.93%, though EBIT margin was moderate at 8.81%. The 2024 fiscal year reflected solid growth in revenue and profitability, with improved net margins and earnings per share supporting a favorable performance.
Which one has the stronger fundamentals?
Shopify’s fundamentals appear stronger, supported by higher revenue growth (203% vs. 79%) and a more substantial net margin (22.74% vs. 7.86%) in 2024. Shopify’s operating efficiency and margin expansions are more pronounced, while Wix maintains a higher gross margin but with lower EBIT margin stability. Both show favorable income statements, yet Shopify’s scale and margin improvements suggest greater fundamental strength.
Financial Ratios Comparison
The following table compares key financial ratios for Shopify Inc. and Wix.com Ltd. based on their latest fiscal year data (2024), providing a snapshot of their operational efficiency, profitability, liquidity, and leverage.
| Ratios | Shopify Inc. (SHOP) | Wix.com Ltd. (WIX) |
|---|---|---|
| ROE | 17.5% | -175.6% |
| ROIC | 7.5% | 9.1% |
| P/E | 68.2 | 86.2 |
| P/B | 11.9 | -151.4 |
| Current Ratio | 3.71 | 0.84 |
| Quick Ratio | 3.70 | 0.84 |
| D/E (Debt-to-Equity) | 0.10 | -12.31 |
| Debt-to-Assets | 8.1% | 50.7% |
| Interest Coverage | 0 | 25.9 |
| Asset Turnover | 0.64 | 0.92 |
| Fixed Asset Turnover | 63.4 | 3.33 |
| Payout ratio | 0 | 0 |
| Dividend yield | 0 | 0 |
Interpretation of the Ratios
Shopify Inc.
Shopify presents a mixed picture with strong net margin (22.74%) and return on equity (17.47%) but unfavorable valuation ratios such as a high PE of 68.18 and PB of 11.91. Liquidity appears weak given a current ratio of 3.71 deemed unfavorable, although leverage and interest coverage are favorable. Shopify does not pay dividends, prioritizing reinvestment and growth instead.
Wix.com Ltd.
Wix shows neutral net margin (7.86%) and return on invested capital (9.13%), but its return on equity is highly negative at -175.57%, indicating profitability challenges. Valuation metrics are mixed with an unfavorable PE of 86.21 but a favorable negative PB ratio. Liquidity ratios are weak, with a current ratio of 0.84. Wix also does not pay dividends, focusing on reinvestment and development.
Which one has the best ratios?
Shopify’s ratios are overall slightly favorable, demonstrating better profitability and capital structure, despite some valuation concerns. Wix’s ratios are slightly unfavorable, mainly due to poor profitability and liquidity metrics. Therefore, Shopify exhibits a stronger ratio profile compared to Wix based on the available data.
Strategic Positioning
This section compares the strategic positioning of Shopify Inc. and Wix.com Ltd. across Market position, Key segments, and Exposure to technological disruption:
Shopify Inc.
- Large market cap of 205B USD, operating globally with high beta, faces strong competition in commerce platforms.
- Key segments include Merchant Solutions and Subscription Services driving revenue through commerce platform services.
- Exposure includes enabling merchants to sell across multiple channels and integrating payments and fulfillment services.
Wix.com Ltd.
- Smaller market cap of 5.6B USD, globally active with moderate beta, competes in cloud website creation platforms.
- Key segments are Creative Subscription and Business Solutions focusing on website creation and business management.
- Exposure includes cloud-based website creation, AI-driven tools, and payment platform integration for users.
Shopify Inc. vs Wix.com Ltd. Positioning
Shopify’s strategy emphasizes a diversified commerce platform with broad merchant services, while Wix concentrates on website creation and business tools. Shopify benefits from scale and multi-channel sales, whereas Wix focuses on integrated creative and business solutions.
Which has the best competitive advantage?
Both companies exhibit slightly unfavorable MOATs, shedding value but showing growing profitability trends. Shopify’s larger scale contrasts with Wix’s focused platform, making their competitive advantages nuanced and dependent on future capital efficiency improvements.
Stock Comparison
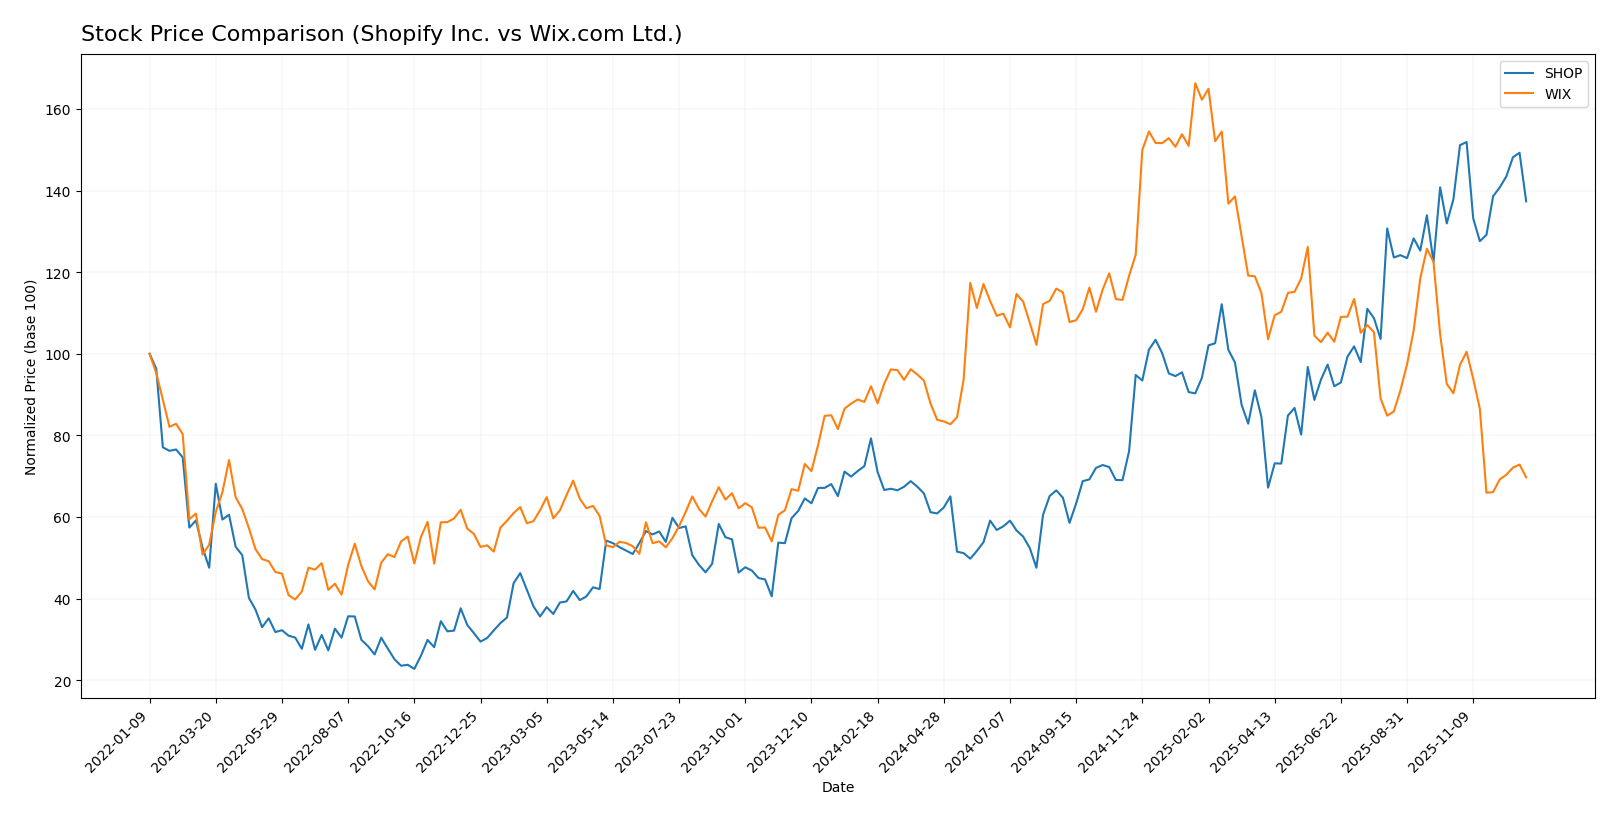
The stock price chart highlights significant divergence in performance between Shopify Inc. and Wix.com Ltd. over the past 12 months, with Shopify showing strong gains amid decelerating momentum, while Wix experienced notable declines alongside persistent downward pressure.
Trend Analysis
Shopify Inc. exhibited a bullish trend over the past year with a 73.28% price increase, despite deceleration in momentum and high volatility (32.85 std deviation). The stock reached a high of 173.86 and a low of 54.43 during this period.
Wix.com Ltd. showed a bearish trend with a 24.25% price decrease over the same timeframe. The trend also decelerated, accompanied by substantial volatility (33.13 std deviation), with prices ranging from 95.51 to 240.89.
Comparatively, Shopify delivered the highest market performance with a strong positive price change, outperforming Wix, whose stock declined significantly across the analyzed period.
Target Prices
Analysts present a bullish consensus on Shopify Inc. and Wix.com Ltd., indicating potential upside from current prices.
| Company | Target High | Target Low | Consensus |
|---|---|---|---|
| Shopify Inc. | 200 | 140 | 184.13 |
| Wix.com Ltd. | 210 | 140 | 184 |
Shopify’s consensus target of 184.13 is about 17% above its current price of 157.2 USD, while Wix’s consensus target of 184 is significantly higher than its current 100.97 USD, suggesting strong growth expectations.
Analyst Opinions Comparison
This section compares analysts’ ratings and grades for Shopify Inc. and Wix.com Ltd.:
Rating Comparison
Shopify Inc. Rating
- Rating: B, evaluated as Very Favorable by analysts.
- Discounted Cash Flow Score: Moderate at 2, indicating average valuation.
- ROE Score: Favorable at 4, showing efficient profit generation.
- ROA Score: Very Favorable at 5, strong asset utilization.
- Debt To Equity Score: Moderate at 3, balanced financial risk.
- Overall Score: Moderate at 3, reflecting balanced financial standing.
Wix.com Ltd. Rating
- Rating: C, also considered Very Favorable by analysts.
- Discounted Cash Flow Score: Moderate at 3, slightly better valuation.
- ROE Score: Very Unfavorable at 1, indicating weak equity returns.
- ROA Score: Moderate at 3, average asset efficiency.
- Debt To Equity Score: Very Unfavorable at 1, higher financial risk.
- Overall Score: Moderate at 2, slightly lower financial assessment.
Which one is the best rated?
Based strictly on the provided data, Shopify holds a higher rating of B versus Wix’s C, with stronger scores in ROE, ROA, and debt management. Wix scores better only in discounted cash flow but overall ranks slightly lower.
Scores Comparison
The scores comparison for Shopify and Wix highlights their financial stability and strength:
Shopify Scores
- Altman Z-Score: 52.35, indicating a safe zone for stability.
- Piotroski Score: 6, reflecting average financial strength.
Wix Scores
- Altman Z-Score: 2.08, placing it in the grey zone.
- Piotroski Score: 6, also reflecting average financial strength.
Which company has the best scores?
Shopify shows a significantly higher Altman Z-Score, indicating stronger financial stability than Wix. Both have identical Piotroski Scores, reflecting similar average financial strength. Overall, Shopify’s scores suggest a safer financial position.
Grades Comparison
The following summarizes the recent grades assigned to Shopify Inc. and Wix.com Ltd.:
Shopify Inc. Grades
This table displays recent grades and ratings given to Shopify Inc. by recognized financial institutions.
| Grading Company | Action | New Grade | Date |
|---|---|---|---|
| Wells Fargo | Maintain | Overweight | 2025-12-17 |
| Barclays | Maintain | Equal Weight | 2025-11-05 |
| JP Morgan | Maintain | Overweight | 2025-11-05 |
| Truist Securities | Maintain | Hold | 2025-11-05 |
| DA Davidson | Maintain | Buy | 2025-11-05 |
| CIBC | Maintain | Outperform | 2025-11-05 |
| Morgan Stanley | Maintain | Overweight | 2025-11-05 |
| Cantor Fitzgerald | Maintain | Neutral | 2025-11-05 |
| Needham | Maintain | Buy | 2025-11-05 |
| BMO Capital | Maintain | Outperform | 2025-11-05 |
Overall, Shopify’s grades are mostly positive, ranging from Hold to Buy and Outperform, indicating a generally favorable analyst consensus.
Wix.com Ltd. Grades
Presented here are the latest grades and ratings awarded to Wix.com Ltd. by established grading firms.
| Grading Company | Action | New Grade | Date |
|---|---|---|---|
| Wells Fargo | Maintain | Overweight | 2025-12-19 |
| Cantor Fitzgerald | Maintain | Overweight | 2025-12-11 |
| Benchmark | Maintain | Buy | 2025-11-20 |
| Citigroup | Maintain | Buy | 2025-11-20 |
| Wells Fargo | Maintain | Overweight | 2025-11-20 |
| Citizens | Maintain | Market Outperform | 2025-11-20 |
| Cantor Fitzgerald | Maintain | Overweight | 2025-11-20 |
| Oppenheimer | Maintain | Outperform | 2025-11-20 |
| B. Riley Securities | Maintain | Buy | 2025-11-20 |
| Evercore ISI Group | Maintain | Outperform | 2025-11-20 |
Wix.com Ltd.’s ratings are predominantly positive, with many Buy, Overweight, and Outperform grades, reflecting a strong analyst endorsement.
Which company has the best grades?
Both Shopify Inc. and Wix.com Ltd. receive favorable grades, but Wix’s ratings skew slightly higher with more consistent Buy and Outperform classifications, suggesting stronger analyst confidence that could influence investor preference.
Strengths and Weaknesses
Below is a comparison of key strengths and weaknesses for Shopify Inc. and Wix.com Ltd. based on the most recent financial and market data.
| Criterion | Shopify Inc. (SHOP) | Wix.com Ltd. (WIX) |
|---|---|---|
| Diversification | Strong, with Merchant Solutions and Subscription streams totaling over 8B USD in 2024 | Moderate, focused on Business Solutions and Creative Subscriptions with ~1.8B USD revenue in 2024 |
| Profitability | High net margin (22.74%), favorable ROE (17.47%), but ROIC below WACC indicating value destruction | Lower net margin (7.86%), negative ROE (-175.57%), ROIC near WACC, overall less profitable |
| Innovation | High fixed asset turnover (63.43), indicating efficient asset use and innovation in service delivery | Lower fixed asset turnover (3.33), but still favorable; innovation focused on creative subscription services |
| Global presence | Large global footprint with significant service revenues and subscription base worldwide | Growing global presence but smaller scale and revenue base compared to Shopify |
| Market Share | Leading market share in e-commerce platform solutions with strong growth in Merchant Solutions | Smaller market share, niche focus on creative and business website solutions |
Key takeaways: Shopify demonstrates superior profitability, scale, and diversification with a robust global presence, though it still faces challenges in capital efficiency. Wix shows potential in niche markets with growing revenues but struggles with profitability and leverage risks. Investors should weigh growth prospects against current value creation metrics.
Risk Analysis
Below is a comparison of key risks for Shopify Inc. and Wix.com Ltd. based on the most recent financial and market data of 2024.
| Metric | Shopify Inc. (SHOP) | Wix.com Ltd. (WIX) |
|---|---|---|
| Market Risk | High beta (2.83) indicates significant volatility | Moderate beta (1.42) suggests moderate volatility |
| Debt level | Low debt-to-equity (0.1), debt/assets 8.1%, low financial risk | High debt-to-equity (negative due to accounting) and debt/assets 50.7%, higher financial risk |
| Regulatory Risk | Moderate, operates globally, subject to e-commerce laws | Moderate, global presence with exposure to diverse regulations |
| Operational Risk | Platform reliability and competition risks | Platform innovation and competition risks |
| Environmental Risk | Low direct impact, but increasing pressure for sustainable operations | Similar low direct impact but faces growing sustainability expectations |
| Geopolitical Risk | Exposure to multiple regions including US, Europe, Asia | Exposure mainly Israel and global markets, geopolitically sensitive area |
Shopify faces the most impactful risks from high market volatility and a high valuation (P/E 68.2), which could lead to sharp price swings. Wix’s greatest concern is its elevated financial leverage and weaker profitability, placing it in a moderate bankruptcy risk zone. Both companies must navigate regulatory complexities and competitive pressures in the fast-evolving e-commerce and web services markets.
Which Stock to Choose?
Shopify Inc. has shown a strong income evolution with a 203% revenue growth over 2020-2024, favorable profitability metrics including a 22.74% net margin, and a solid 17.47% ROE. Its debt levels are low with a debt-to-equity ratio of 0.1, and it holds a very favorable overall rating of B.
Wix.com Ltd. exhibits moderate income growth of 79% over the same period with a 7.86% net margin. Financial ratios reveal mixed results including a negative ROE of -175.57% and higher debt levels, reflected in a 50.7% debt-to-assets ratio. Its overall rating is C, slightly less favorable than Shopify’s.
For investors tolerating growth volatility, Shopify’s robust income and profitability with a very favorable rating might appear attractive. Conversely, risk-averse investors might view Wix’s mixed ratios and moderate income growth as a cautionary signal, despite its improving profitability. The choice depends on the investor’s appetite for risk and focus on financial stability versus growth potential.
Disclaimer: Investment carries a risk of loss of initial capital. The past performance is not a reliable indicator of future results. Be sure to understand risks before making an investment decision.
Go Further
I encourage you to read the complete analyses of Shopify Inc. and Wix.com Ltd. to enhance your investment decisions: