Home > Comparison > Technology > SHOP vs U
The strategic rivalry between Shopify Inc. and Unity Software Inc. shapes the evolving landscape of the technology sector. Shopify operates as a commerce platform powerhouse, enabling seamless multi-channel retail experiences. Unity Software leads as an interactive real-time 3D content creator, powering immersive applications across devices. This head-to-head represents a clash between commerce infrastructure and digital content innovation. This analysis will identify which model delivers superior risk-adjusted returns for a diversified portfolio in 2026.
Table of contents
Companies Overview
Shopify and Unity stand as pivotal players in the software application sector, shaping commerce and interactive content markets globally.
Shopify Inc.: Global Commerce Platform Leader
Shopify dominates the e-commerce platform space by enabling merchants to manage sales across web, mobile, social, and physical storefronts. Its revenue stems from subscription solutions and merchant services like payments and fulfillment. In 2026, Shopify focuses on expanding integrated merchant solutions to deepen customer loyalty and streamline commerce operations worldwide.
Unity Software Inc.: Real-Time 3D Content Pioneer
Unity leads in interactive real-time 3D software, powering creators across mobile, PC, console, and AR/VR platforms. It generates revenue from licensing its engine and monetization tools for game developers and designers. In 2026, Unity prioritizes enhancing its platform’s capabilities to capture growing demand in immersive experiences and cross-device content creation.
Strategic Collision: Similarities & Divergences
Both companies thrive on software innovation but diverge sharply: Shopify builds a closed commerce ecosystem, while Unity fosters an open creative platform. Their battle centers on digital engagement—Shopify in retail transactions, Unity in content creation. Investors face distinct profiles: Shopify offers scalable commerce infrastructure; Unity presents growth in emerging interactive media.
Income Statement Comparison
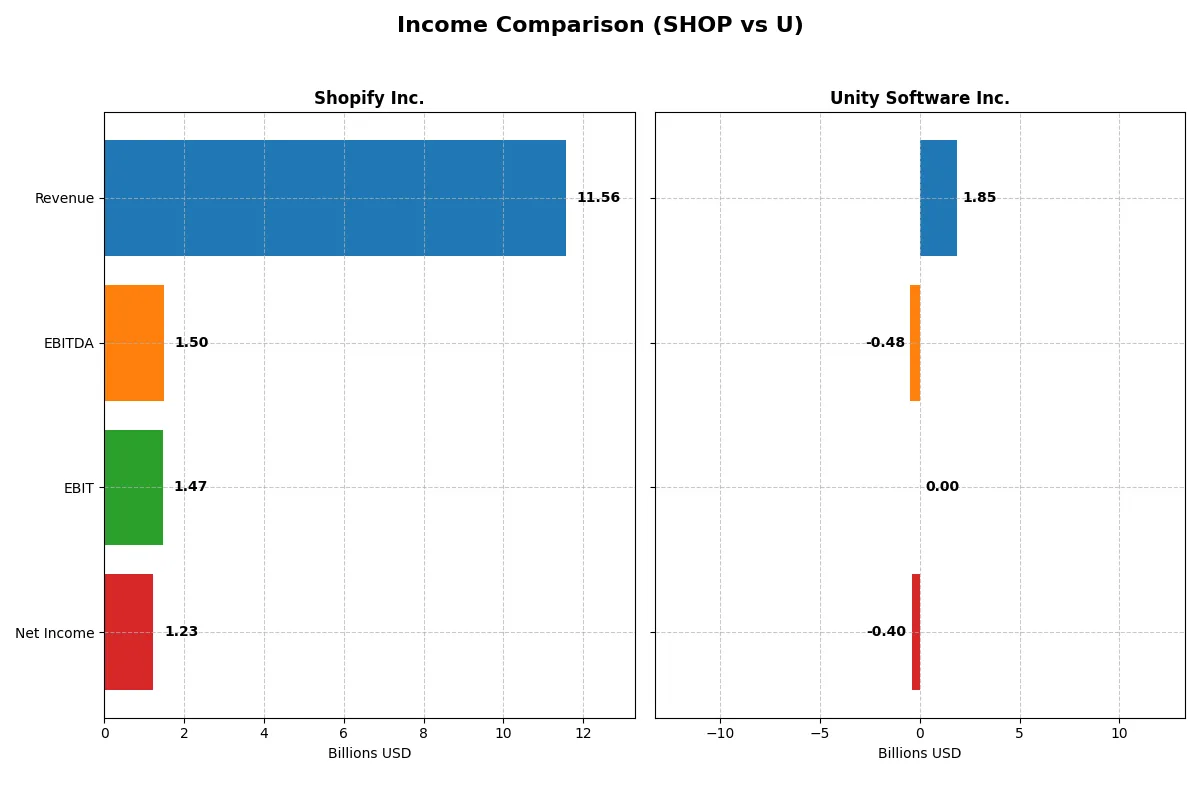
This table dissects the core profitability and scalability of both corporate engines to reveal who dominates the bottom line:
| Metric | Shopify Inc. (SHOP) | Unity Software Inc. (U) |
|---|---|---|
| Revenue | 11.56B | 1.85B |
| Cost of Revenue | 6.00B | 478M |
| Operating Expenses | 4.09B | 1.85B |
| Gross Profit | 5.56B | 1.37B |
| EBITDA | 1.50B | -479M |
| EBIT | 1.47B | 0 |
| Interest Expense | 0 | 24M |
| Net Income | 1.23B | -403M |
| EPS | 0.95 | -0.96 |
| Fiscal Year | 2025 | 2025 |
Income Statement Analysis: The Bottom-Line Duel
This income statement comparison reveals the true efficiency and profitability momentum behind two distinct corporate engines.
Shopify Inc. Analysis
Shopify’s revenue surged 30% year-over-year to 11.56B in 2025, reflecting strong top-line momentum. Gross margin remains robust at 48%, indicating solid product pricing and cost control. However, net income declined sharply to 1.23B, down 39%, signaling pressure on bottom-line efficiency despite favorable operating margins.
Unity Software Inc. Analysis
Unity’s revenue grew modestly by 2% to 1.85B, showing slower sales expansion. Its gross margin impresses at 74%, highlighting strong cost leverage. Yet, Unity reports a net loss of 403M, though this represents a 41% improvement in net margin from prior years, suggesting early signs of improving operational discipline.
Margin Strength vs. Profit Scale
Shopify dominates in revenue scale and sustains positive net income, while Unity boasts superior gross margins but remains unprofitable overall. Shopify’s large earnings base outpaces Unity’s improving yet negative bottom line. Investors seeking scale and consistent profits may favor Shopify’s profile, whereas Unity appeals to those focused on margin expansion and potential turnaround.
Financial Ratios Comparison
These vital ratios act as a diagnostic tool to expose the underlying fiscal health, valuation premiums, and capital efficiency of each company:
| Ratios | Shopify Inc. (SHOP) | Unity Software Inc. (U) |
|---|---|---|
| ROE | 9.14% | -12.44% |
| ROIC | 15.66% | -8.16% |
| P/E | 170 | -46.16 |
| P/B | 15.52 | 5.74 |
| Current Ratio | 12.86 | 1.84 |
| Quick Ratio | 12.86 | 1.84 |
| D/E | 0.014 | 0.69 |
| Debt-to-Assets | 1.24% | 32.69% |
| Interest Coverage | 0 | 19.95 |
| Asset Turnover | 0.76 | 0.27 |
| Fixed Asset Turnover | 81.96 | 27.09 |
| Payout ratio | 0 | 0 |
| Dividend yield | 0 | 0 |
| Fiscal Year | 2025 | 2025 |
Efficiency & Valuation Duel: The Vital Signs
Financial ratios serve as a company’s DNA, exposing hidden risks and operational strengths essential for informed investment choices.
Shopify Inc.
Shopify posts a strong net margin of 10.65%, but its ROE at 9.14% and ROIC at 15.66% fall short of its 16.91% WACC, signaling inefficient capital use. The stock trades at a stretched P/E of 169.9 and P/B of 15.5, reflecting high valuation. Shopify returns value through growth reinvestment, notably 13.3% R&D spend, with no dividends.
Unity Software Inc.
Unity struggles with a negative net margin of -21.78% and deeply negative returns: ROE at -12.44%, ROIC at -8.16%, both below its 11.27% WACC. Despite this, the P/E is negative but technically favorable due to losses, while P/B at 5.74 seems high relative to fundamentals. Unity also pays no dividends, heavily reinvesting over 50% in R&D.
Premium Valuation vs. Operational Challenges
Shopify’s ratios reveal high valuation but stronger profitability and capital efficiency than Unity, which suffers from deep losses and weak returns. Shopify offers a growth-focused profile with better operational metrics. Investors seeking operational resilience may favor Shopify, while those tolerant of high risk might consider Unity’s growth potential.
Which one offers the Superior Shareholder Reward?
Shopify Inc. (SHOP) and Unity Software Inc. (U) both forgo dividends, focusing on reinvestment and buybacks. Shopify’s free cash flow per share stands at $1.55 with no dividend payout, yet it sustains a robust buyback program supported by a strong operating cash flow ratio of 4.17. Unity, while also dividend-free, delivers $0.96 free cash flow per share but operates with higher leverage (debt-to-equity at 0.69) and weaker profitability. Shopify’s conservative capital allocation and low debt position make its buybacks more sustainable. I conclude Shopify offers the superior total shareholder reward in 2026 due to higher FCF, durable buybacks, and stronger financial health.
Comparative Score Analysis: The Strategic Profile
The radar chart reveals the fundamental DNA and trade-offs of Shopify Inc. and Unity Software Inc., highlighting their financial strengths and vulnerabilities:
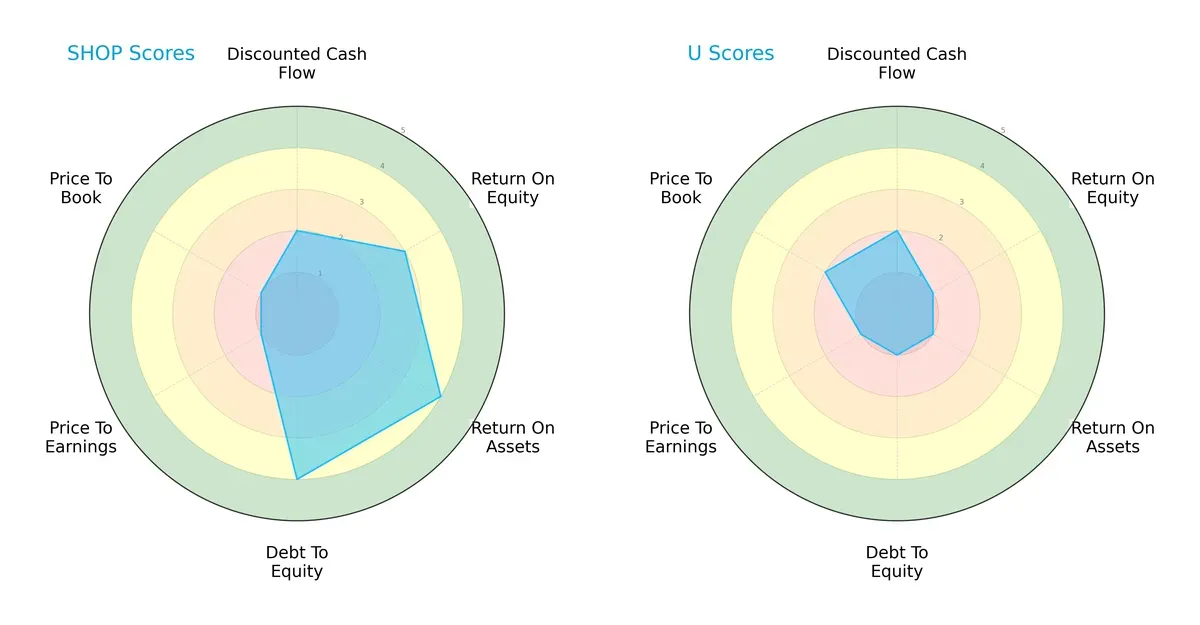
Shopify shows a balanced profile with favorable ROA and debt-to-equity scores, indicating efficient asset use and lower financial risk. Unity relies on weaker profitability and leverage metrics, with notably poor debt management. Shopify’s valuation metrics (P/E and P/B) are both very unfavorable, signaling potential overvaluation risks, while Unity’s valuation scores, though also low, slightly outperform Shopify’s. Overall, Shopify presents a more stable financial foundation, while Unity depends heavily on improving profitability.
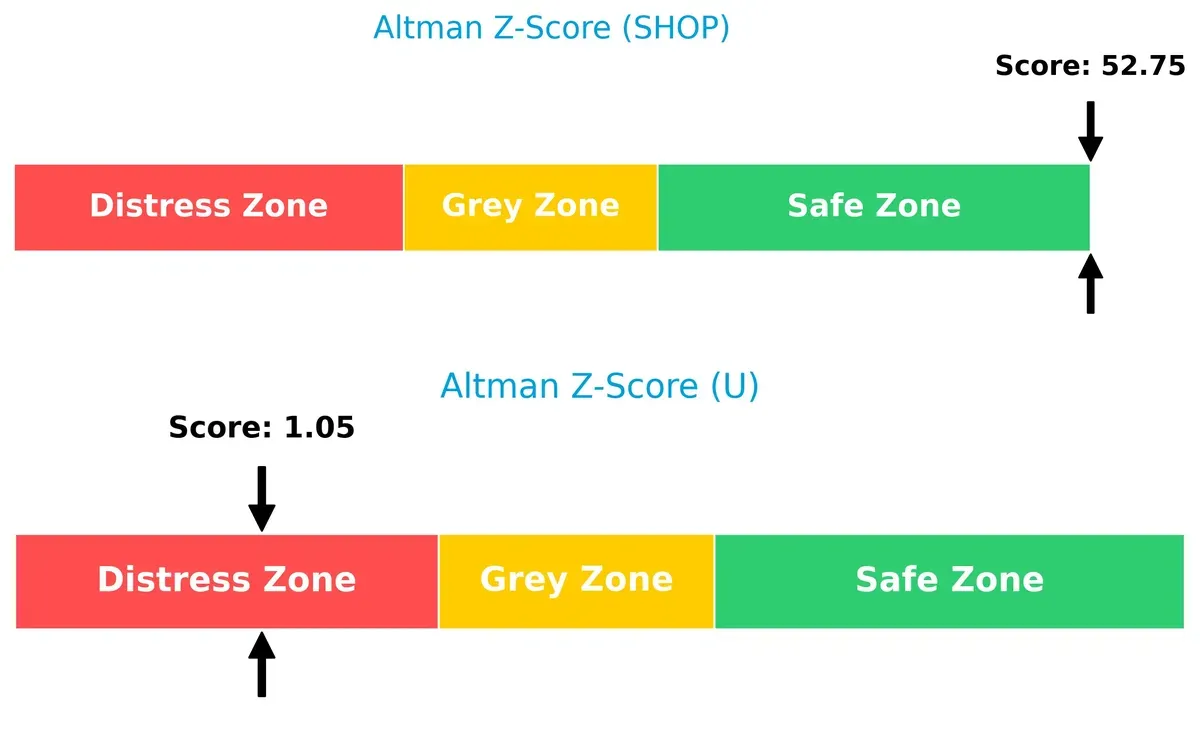
Bankruptcy Risk: Solvency Showdown
Shopify’s Altman Z-Score of 52.75 places it firmly in the safe zone, signaling robust financial health and low bankruptcy risk. Unity’s score of 1.05 lands it in the distress zone, highlighting significant solvency concerns and higher default risk in this cycle:
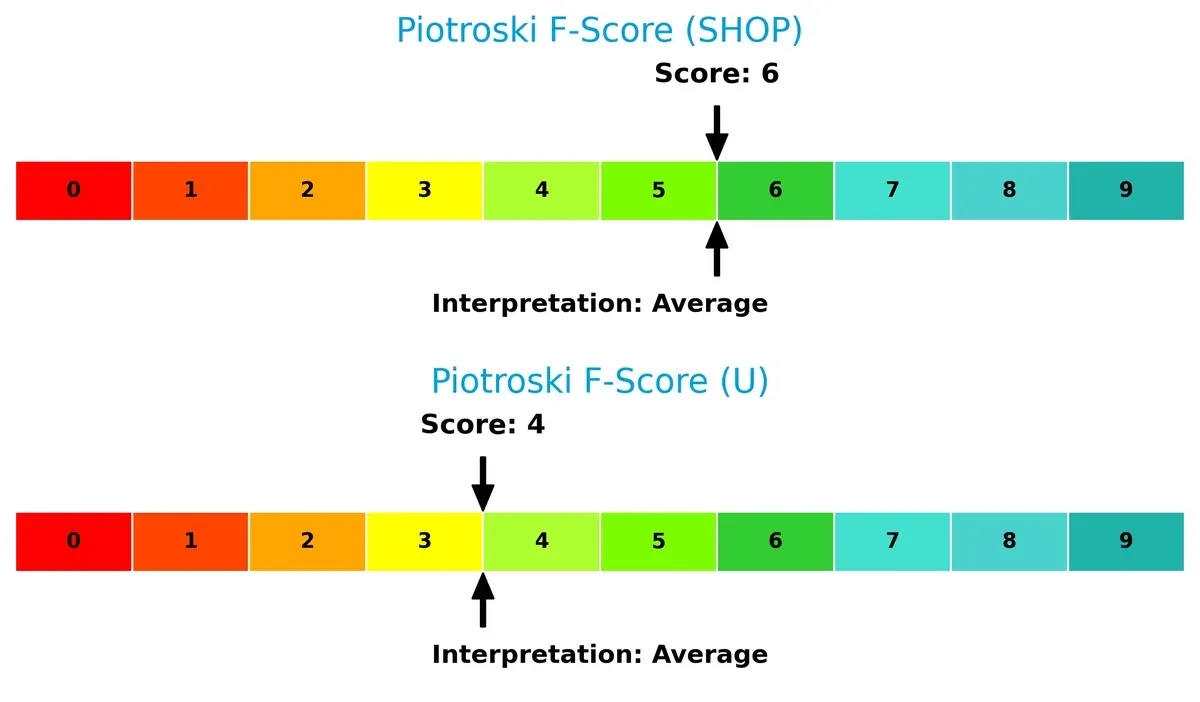
Financial Health: Quality of Operations
Both companies show average Piotroski F-Scores, with Shopify scoring 6 and Unity 4. Shopify’s higher score suggests better operational quality and financial strength. Unity’s lower score raises red flags regarding internal metrics and financial resilience:
How are the two companies positioned?
This section dissects the operational DNA of Shopify and Unity by comparing their revenue distribution by segment and internal dynamics. The goal: confront their economic moats to reveal which model offers the most resilient, sustainable advantage today.
Revenue Segmentation: The Strategic Mix
This visual comparison dissects how Shopify Inc. and Unity Software Inc. diversify their income streams and where their primary sector bets lie:
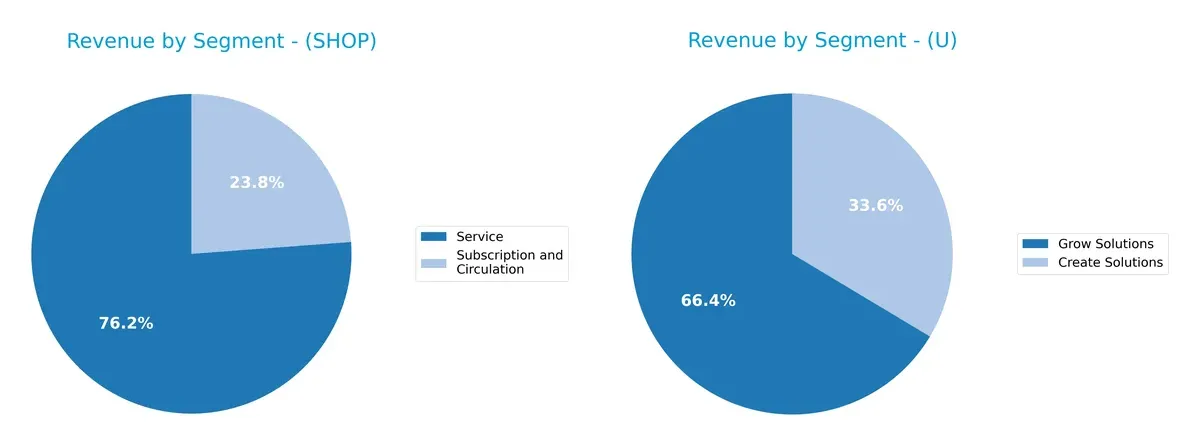
Shopify anchors its 2025 revenue largely on Services at $8.8B, with Subscription and Circulation adding $2.75B. Unity shows a more balanced mix, with Grow Solutions leading at $1.23B and Create Solutions contributing $621M. Shopify’s concentration in merchant services signals ecosystem lock-in but raises concentration risk. Unity’s diversified streams reflect strategic pivots to capture multiple segments in software development and operation.
Strengths and Weaknesses Comparison
This table compares the strengths and weaknesses of Shopify Inc. and Unity Software Inc.:
Shopify Inc. Strengths
- Strong service revenue at 8.8B in 2025
- Exceptional quick ratio at 12.86
- Very low debt-to-assets at 1.24%
- Highest fixed asset turnover of 81.96
- Global presence with significant US and EMEA revenue
Unity Software Inc. Strengths
- Balanced revenue streams in Create and Grow Solutions
- Favorable PE ratio despite negative earnings
- Current and quick ratios both at 1.84
- Adequate fixed asset turnover of 27.09
- Diverse geographic footprint including Asia Pacific and Greater China
Shopify Inc. Weaknesses
- High P/E ratio at 169.86 signals overvaluation risk
- ROIC below WACC at 15.66% vs. 16.91%
- Unfavorable return on equity at 9.14%
- Extremely high current ratio at 12.86 may indicate inefficient asset use
- No dividend yield
- Net margin positive but moderate at 10.65%
Unity Software Inc. Weaknesses
- Negative net margin at -21.78% and ROE at -12.44%
- Negative ROIC at -8.16% below WACC of 11.27%
- Negative interest coverage indicates financial strain
- Low asset turnover at 0.27
- No dividend yield
- Moderate debt levels with D/E at 0.69 and debt-to-assets at 32.69%
Both companies display distinct profiles: Shopify excels in liquidity and asset efficiency but faces valuation and capital return challenges. Unity struggles with profitability and operational efficiency, despite balanced revenue streams and moderate leverage. These contrasts highlight different strategic and financial priorities.
The Moat Duel: Analyzing Competitive Defensibility
A structural moat is the only reliable shield protecting long-term profits from relentless competitive erosion:
Shopify Inc.: Network Effects Powering Commerce Ecosystem
Shopify’s moat stems from powerful network effects linking merchants and buyers. Its high gross margin (48%) and stable EBIT margin (12.7%) confirm efficient capital use. Expansion into new markets and merchant solutions could deepen this moat in 2026.
Unity Software Inc.: Intangible Assets Driving Real-Time 3D Dominance
Unity’s intangible assets, especially its platform technology, create switching costs for developers. Despite negative net margin (-21.8%), recent EBIT margin growth signals improving capital efficiency. New AR/VR applications offer promising expansion in 2026.
Moat Strength: Network Effects vs. Intangible Assets
Both firms currently shed value as ROIC lags WACC, but Shopify’s growing profitability and vast merchant network offer a wider moat. I see Shopify better equipped to sustain market share against evolving competition.
Which stock offers better returns?
Over the past 12 months, Shopify Inc. surged 43.17%, showing a strong bullish trend despite recent deceleration and volatility. Unity Software Inc. dropped 30.79%, reflecting a bearish trend with slowing momentum.
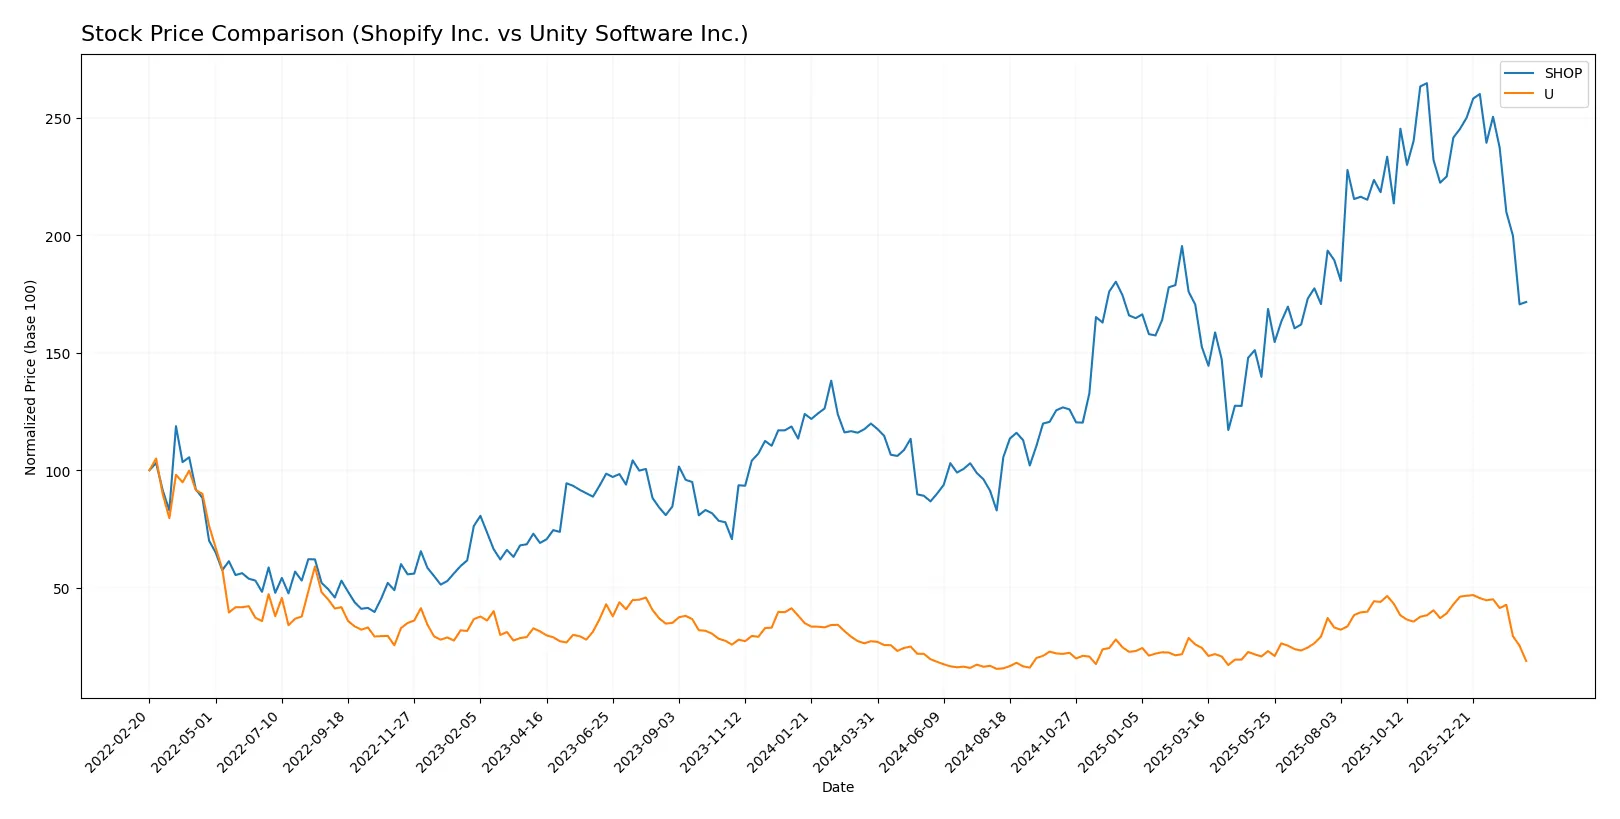
Trend Comparison
Shopify’s stock rose 43.17% over the past year, marking a bullish trend with decelerating gains and a high price volatility of 33.42. Its recent 3-month trend reversed, falling 28.96%.
Unity’s stock declined 30.79% over the past year, maintaining a bearish trend with decelerating losses and lower volatility at 9.2. The recent 3-month drop accelerated, plunging 56.07%.
Shopify outperformed Unity clearly, delivering positive market returns versus Unity’s significant losses over the last 12 months.
Target Prices
Analysts present a broad but optimistic target consensus for Shopify Inc. and Unity Software Inc.
| Company | Target Low | Target High | Consensus |
|---|---|---|---|
| Shopify Inc. | 115 | 200 | 167.04 |
| Unity Software Inc. | 26 | 60 | 37.7 |
Shopify’s consensus target of 167.04 implies a 48% upside from its current 112.7 price, signaling strong confidence. Unity’s target consensus at 37.7 suggests a nearly 102% potential gain, reflecting high growth expectations despite recent volatility.

Don’t Let Luck Decide Your Entry Point
Optimize your entry points with our advanced ProRealTime indicators. You’ll get efficient buy signals with precise price targets for maximum performance. Start outperforming now!
How do institutions grade them?
Shopify Inc. Grades
The following table summarizes recent grades issued by reputable institutions for Shopify Inc.:
| Grading Company | Action | New Grade | Date |
|---|---|---|---|
| Citigroup | Maintain | Buy | 2026-02-13 |
| Wells Fargo | Maintain | Overweight | 2026-02-12 |
| Truist Securities | Maintain | Hold | 2026-02-12 |
| UBS | Maintain | Neutral | 2026-02-12 |
| Mizuho | Upgrade | Outperform | 2026-02-12 |
| Citizens | Maintain | Market Outperform | 2026-02-12 |
| RBC Capital | Maintain | Outperform | 2026-02-12 |
| BMO Capital | Maintain | Outperform | 2026-02-12 |
| Cantor Fitzgerald | Maintain | Neutral | 2026-02-12 |
| Barclays | Maintain | Equal Weight | 2026-02-12 |
Unity Software Inc. Grades
The following table summarizes recent grades issued by reputable institutions for Unity Software Inc.:
| Grading Company | Action | New Grade | Date |
|---|---|---|---|
| Goldman Sachs | Maintain | Neutral | 2026-02-12 |
| BTIG | Maintain | Buy | 2026-02-12 |
| Needham | Maintain | Buy | 2026-02-12 |
| Wells Fargo | Maintain | Overweight | 2026-02-12 |
| Wedbush | Maintain | Outperform | 2026-02-12 |
| Macquarie | Maintain | Outperform | 2026-02-12 |
| UBS | Maintain | Neutral | 2026-02-12 |
| Citigroup | Maintain | Buy | 2026-02-12 |
| Barclays | Maintain | Equal Weight | 2026-02-12 |
| Citizens | Maintain | Market Outperform | 2026-02-12 |
Which company has the best grades?
Both companies receive a mix of Buy, Outperform, and Neutral grades from top-tier institutions. Shopify Inc. has a slight edge with an upgrade from Mizuho and multiple Outperform ratings. This could signal stronger institutional confidence and potential investor interest. Unity Software also has solid Buy and Outperform grades but lacks recent upgrades.
Risks specific to each company
The following categories identify critical pressure points and systemic threats facing Shopify Inc. and Unity Software Inc. in the 2026 market environment:
1. Market & Competition
Shopify Inc.
- Faces intense competition from e-commerce platforms and must innovate to maintain market share.
Unity Software Inc.
- Operates in a niche 3D content platform market but faces competition from emerging tech and platform providers.
2. Capital Structure & Debt
Shopify Inc.
- Maintains an extremely low debt level (D/E 0.01), minimizing financial risk.
Unity Software Inc.
- Carries moderate debt (D/E 0.69), raising concerns about leverage and interest coverage.
3. Stock Volatility
Shopify Inc.
- Exhibits high beta (2.82), indicating significant share price volatility.
Unity Software Inc.
- Also volatile with beta of 2.08, but slightly less than Shopify’s.
4. Regulatory & Legal
Shopify Inc.
- Regulatory risks tied to global e-commerce laws and data privacy requirements.
Unity Software Inc.
- Faces evolving regulations in software licensing and digital content monetization.
5. Supply Chain & Operations
Shopify Inc.
- Depends on robust logistics and fulfillment networks; disruptions could impact merchant services.
Unity Software Inc.
- Relies on technology infrastructure and developer ecosystem stability, vulnerable to platform outages.
6. ESG & Climate Transition
Shopify Inc.
- Increasing pressure to reduce carbon footprint across supply chain and data centers.
Unity Software Inc.
- Faces challenges in integrating sustainable practices within digital content creation platforms.
7. Geopolitical Exposure
Shopify Inc.
- Operates globally with exposure to trade tensions and currency fluctuations.
Unity Software Inc.
- Exposure concentrated in US and Europe; geopolitical instability could affect developer markets.
Which company shows a better risk-adjusted profile?
Shopify’s strongest risk is market competition and high valuation multiples, while Unity’s most pressing risk is financial distress from weak profitability and leverage. Shopify’s low debt and strong Altman Z-score (52.75, safe zone) contrast with Unity’s distress-level Z-score (1.05). Despite Shopify’s valuation concerns, it offers a better risk-adjusted profile. Unity’s deteriorating profitability and balance sheet highlight significantly higher financial risk, underscored by a sharp recent stock price decline (-4.9%).
Final Verdict: Which stock to choose?
Shopify Inc. (SHOP) stands out with its superpower as a cash-generating machine supported by robust operational efficiency. Its rapid revenue growth and improving profitability signal an evolving strength. The key point of vigilance remains its stretched valuation and slightly unfavorable capital returns, suggesting sensitivity to market shifts. It fits an aggressive growth portfolio seeking exposure to e-commerce innovation.
Unity Software Inc. (U) commands a strategic moat through its dominance in real-time 3D development platforms and recurring revenue potential. Despite weaker profitability and financial distress signals relative to Shopify, its improving income metrics and moderate balance sheet stability offer a cushion. It suits a GARP (Growth at a Reasonable Price) investor willing to absorb volatility for future upside in the gaming and metaverse sectors.
If you prioritize strong cash flow generation and market leadership in e-commerce infrastructure, Shopify outshines due to its scale and improving profitability trends, despite valuation risks. However, if you seek exposure to emerging tech with a strategic moat in software platforms and tolerate near-term financial challenges, Unity offers better stability in growth potential. Both represent distinct analytical scenarios tailored to differing risk appetites and investment horizons.
Disclaimer: Investment carries a risk of loss of initial capital. The past performance is not a reliable indicator of future results. Be sure to understand risks before making an investment decision.
Go Further
I encourage you to read the complete analyses of Shopify Inc. and Unity Software Inc. to enhance your investment decisions: