Home > Comparison > Technology > SHOP vs UBER
The strategic rivalry between Shopify Inc. and Uber Technologies defines the current trajectory of the technology sector. Shopify, a nimble commerce platform provider, contrasts sharply with Uber, a multifaceted mobility and delivery service operator. This head-to-head captures the tension between scalable platform innovation and diversified service ecosystems. This analysis aims to identify which corporate trajectory offers superior risk-adjusted returns for a diversified portfolio, reflecting evolving market leadership dynamics.

Table of contents
Companies Overview
Shopify and Uber dominate distinct segments of the global software application market, shaping e-commerce and mobility respectively.
Shopify Inc.: The Commerce Platform Powerhouse
Shopify Inc. leads as a commerce platform enabling merchants to manage sales across web, mobile, social, and physical channels. Its core revenue engine revolves around subscription solutions and merchant services like payment processing and shipping. In 2026, Shopify’s strategic focus remains on expanding its ecosystem to empower businesses worldwide with integrated commerce tools.
Uber Technologies, Inc.: The Mobility and Delivery Innovator
Uber Technologies, Inc. commands the ride-sharing and delivery platform space by connecting consumers with independent mobility and delivery providers. Its revenue streams span Mobility, Delivery, and Freight segments, optimizing urban transport and logistics. Uber’s 2026 strategy prioritizes scaling its multi-modal services and enhancing platform efficiency across global markets.
Strategic Collision: Similarities & Divergences
Both companies leverage technology platforms to connect users with service providers but diverge in market approach: Shopify builds an open commerce ecosystem, while Uber operates a more closed, service-specific platform. Their primary battleground lies in capturing digital transaction volume—Shopify in retail sales and Uber in urban mobility and delivery. This underpins distinct investment profiles: Shopify’s growth is tied to merchant expansion, Uber’s to service diversification and volume scaling.
Income Statement Comparison
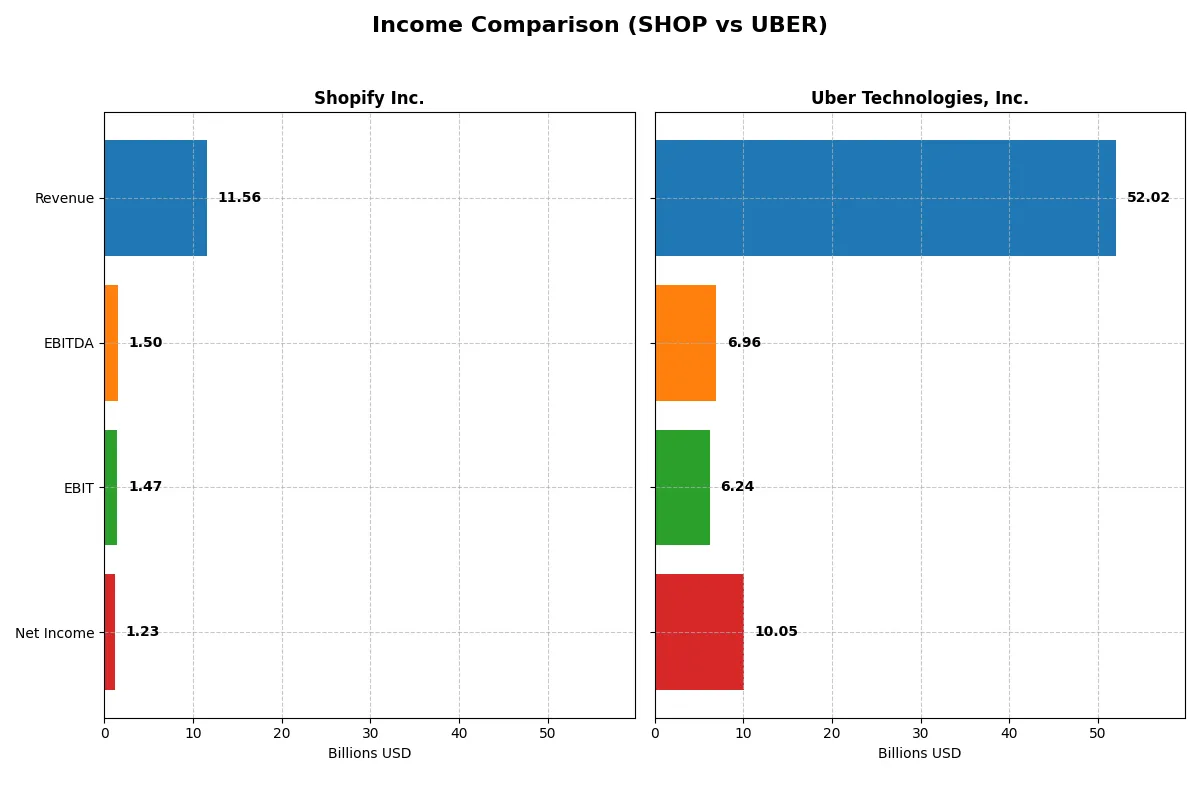
This data dissects the core profitability and scalability of both corporate engines to reveal who dominates the bottom line:
| Metric | Shopify Inc. (SHOP) | Uber Technologies, Inc. (UBER) |
|---|---|---|
| Revenue | 11.6B | 52.0B |
| Cost of Revenue | 6.0B | 31.3B |
| Operating Expenses | 4.1B | 15.1B |
| Gross Profit | 5.6B | 20.7B |
| EBITDA | 1.5B | 7.0B |
| EBIT | 1.5B | 6.2B |
| Interest Expense | 0 | 440M |
| Net Income | 1.2B | 10.1B |
| EPS | 0.95 | 4.82 |
| Fiscal Year | 2025 | 2025 |
Income Statement Analysis: The Bottom-Line Duel
This income statement comparison reveals the true efficiency and growth dynamics of Shopify and Uber’s corporate engines over recent years.
Shopify Inc. Analysis
Shopify’s revenue surged from 4.6B in 2021 to 11.6B in 2025, showcasing strong top-line growth. Gross margins hover around 48%, indicating solid production efficiency. However, net income peaked in 2021 at 2.9B and dropped to 1.2B in 2025, reflecting margin compression. The 2025 net margin of 10.7% signals profitability but reveals challenges maintaining bottom-line momentum.
Uber Technologies, Inc. Analysis
Uber’s revenue climbed impressively from 17.5B in 2021 to 52B in 2025, nearly tripling its scale. Its gross margin at roughly 40% is healthy given the sector’s capital intensity. Net income exploded from a loss of 496M in 2021 to 10B in 2025, highlighting rapid operational improvement. Uber’s 2025 net margin of 19.3% underscores superior bottom-line leverage and growing efficiency.
Revenue Expansion vs. Margin Mastery
Uber clearly outperforms Shopify in net income growth and margin improvement, with a 10B net profit dwarfing Shopify’s 1.2B despite similar EBIT margins. Uber’s ability to convert scale into profit makes it the fundamental winner in efficiency and growth. Investors seeking robust margin expansion and accelerating profitability may find Uber’s profile more compelling.
Financial Ratios Comparison
These vital ratios act as a diagnostic tool to expose the underlying fiscal health, valuation premiums, and capital efficiency of the companies compared below:
| Ratios | Shopify Inc. (SHOP) | Uber Technologies, Inc. (UBER) |
|---|---|---|
| ROE | 9.14% | 37.18% |
| ROIC | 15.66% | 11.21% |
| P/E | 169.86 | 16.85 |
| P/B | 15.52 | 6.27 |
| Current Ratio | 12.86 | 1.14 |
| Quick Ratio | 12.86 | 1.14 |
| D/E | 0.014 | 0.50 |
| Debt-to-Assets | 1.24% | 21.80% |
| Interest Coverage | 0 | 12.65 |
| Asset Turnover | 0.76 | 0.84 |
| Fixed Asset Turnover | 81.96 | 17.28 |
| Payout Ratio | 0 | 0 |
| Dividend Yield | 0 | 0 |
| Fiscal Year | 2025 | 2025 |
Efficiency & Valuation Duel: The Vital Signs
Financial ratios act as a company’s DNA, unveiling hidden operational strengths and risks that shape investment decisions.
Shopify Inc.
Shopify shows a modest 9.14% ROE and a 10.65% net margin, indicating moderate profitability. However, its P/E ratio of 169.86 signals a stretched valuation. The company retains earnings for growth, focusing heavily on R&D, with no dividend payout. High current and quick ratios suggest strong liquidity but may mask inefficient capital use.
Uber Technologies, Inc.
Uber delivers a strong 37.18% ROE and a 19.33% net margin, reflecting robust profitability and operational efficiency. Its P/E of 16.85 indicates fair valuation. Uber returns value via growth investments without dividends. Moderate leverage and solid interest coverage enhance financial stability, though a PB of 6.27 is less attractive.
Premium Valuation vs. Operational Strength
Uber balances profitability and valuation better than Shopify, whose stock appears stretched despite liquidity. Uber’s metrics suit investors prioritizing operational efficiency and fair pricing. Shopify fits those focused on growth, accepting valuation risk for long-term innovation.
Which one offers the Superior Shareholder Reward?
I compare Shopify Inc. (SHOP) and Uber Technologies, Inc. (UBER) on shareholder distributions and buybacks. Neither pays dividends, focusing instead on reinvestment and buybacks. Shopify’s zero dividend yield aligns with reinvesting 99%+ of FCF into growth and buybacks. Uber also pays no dividends but exhibits a more moderate payout with FCF coverage near 97%. Uber’s buybacks are more consistent, supporting shareholder value despite higher leverage. Shopify’s extraordinary current ratio (12.9) signals excess liquidity but limits buyback aggressiveness. Uber’s lower current ratio (1.14) and stronger operating margins imply a sustainable buyback and reinvestment balance. I see Uber offering a more attractive total return profile through disciplined buybacks and improving profitability, while Shopify’s high valuation and zero payout raise sustainability concerns.
Comparative Score Analysis: The Strategic Profile
The radar chart reveals the fundamental DNA and trade-offs of Shopify Inc. and Uber Technologies, Inc., highlighting their financial strengths and valuation risks:
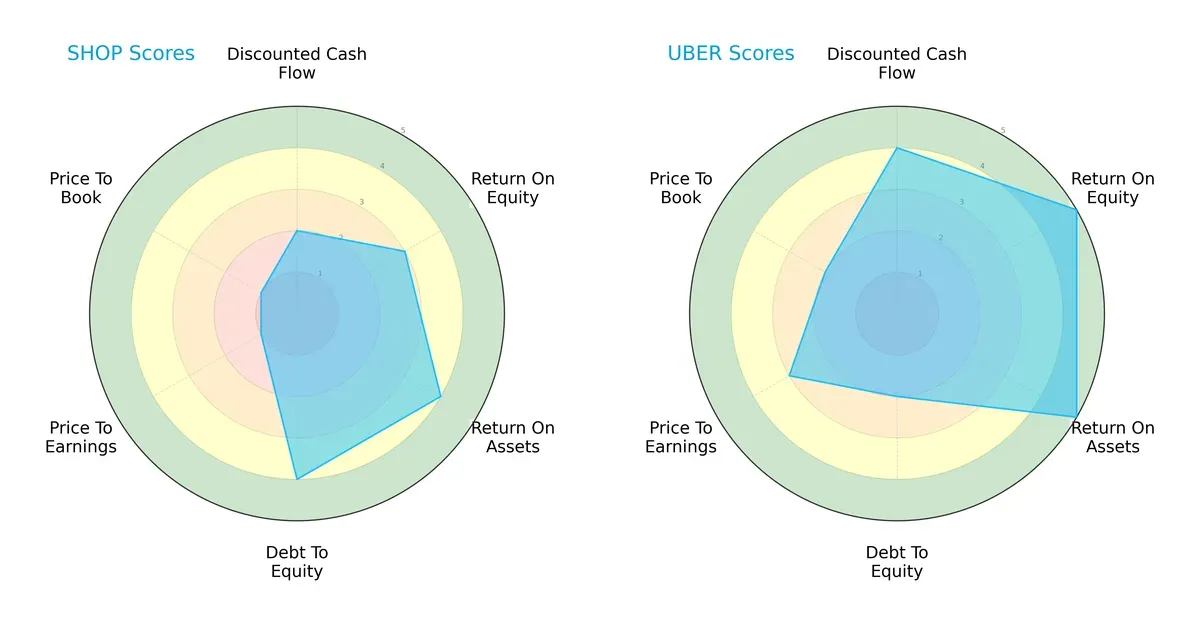
Uber dominates in discounted cash flow, return on equity, and return on assets, indicating superior profitability and asset utilization. Shopify shows strength in debt-to-equity, signaling lower financial risk. However, Shopify’s valuation scores (P/E and P/B) are very unfavorable, suggesting overvaluation. Uber’s profile appears more balanced, leveraging robust operational metrics despite higher leverage. Shopify depends heavily on a conservative capital structure but struggles with market pricing.
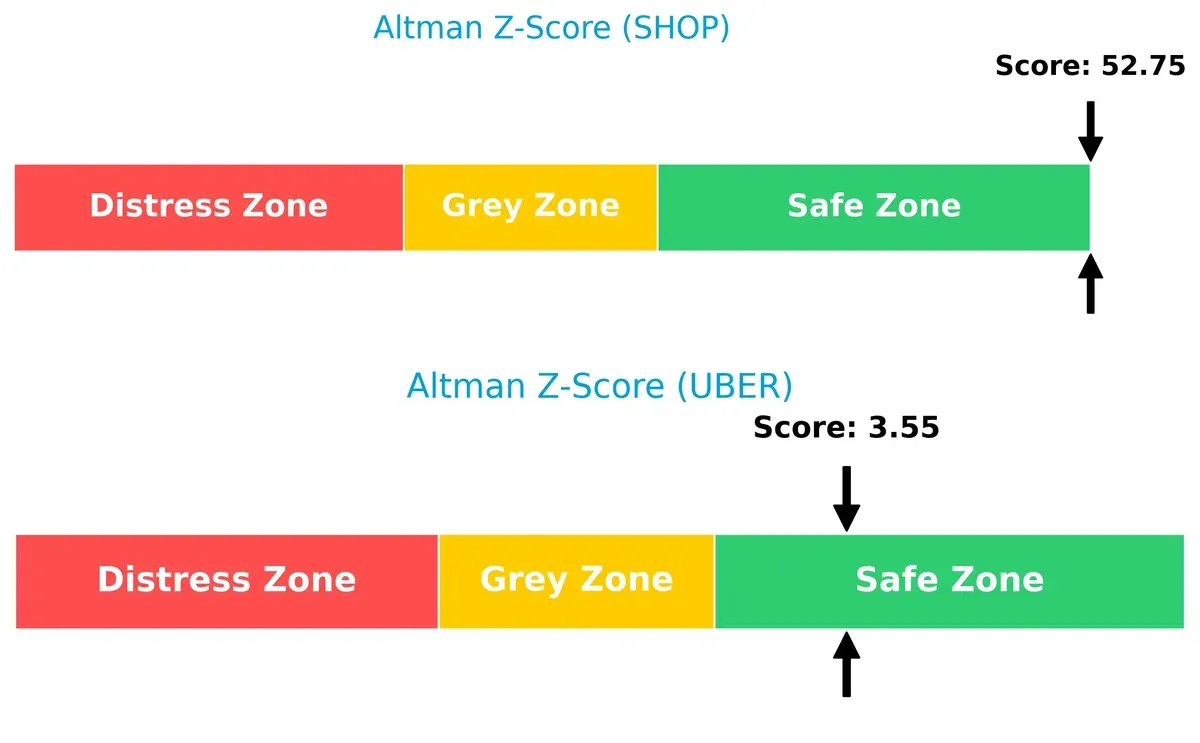
Bankruptcy Risk: Solvency Showdown
Uber’s Altman Z-Score of 3.55 versus Shopify’s 52.75 places both well within the safe zone, but Shopify’s exceptionally high score signals extraordinary financial stability and negligible bankruptcy risk in this cycle:
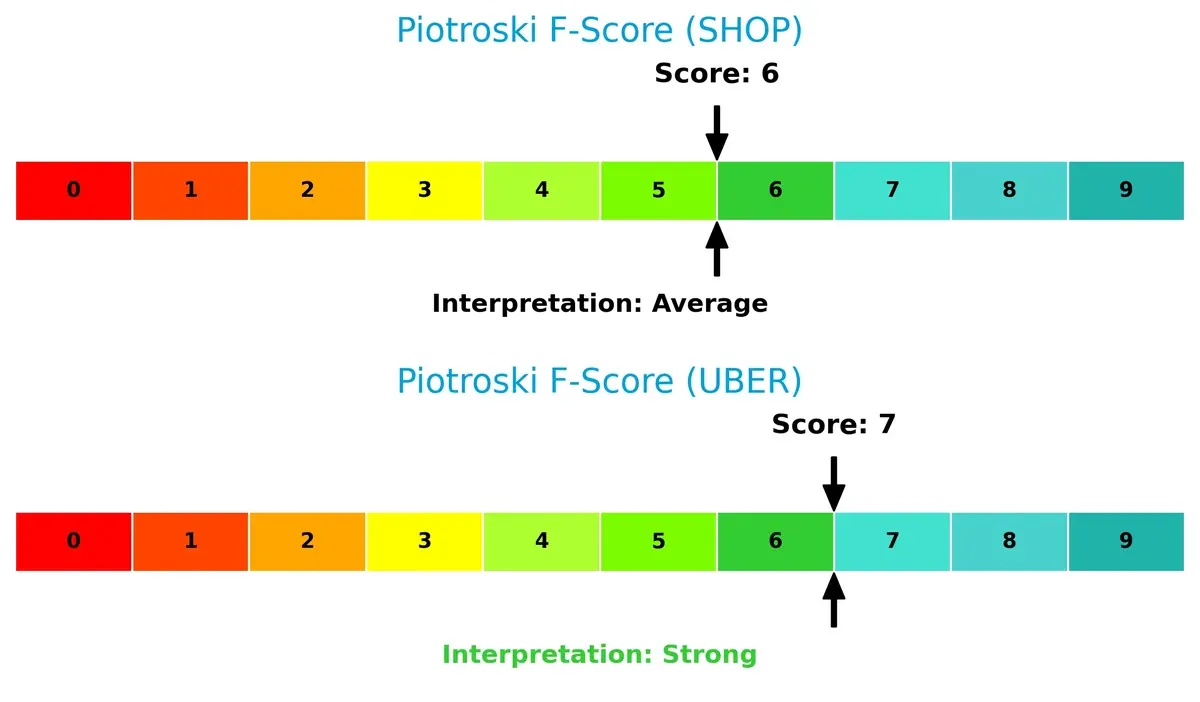
Financial Health: Quality of Operations
Uber’s Piotroski F-Score of 7 surpasses Shopify’s 6, indicating stronger internal financial health. Shopify’s average score suggests some internal operational red flags compared to Uber’s robust position:
How are the two companies positioned?
This section dissects the operational DNA of Shopify and Uber by comparing their revenue distribution by segment alongside their intrinsic strengths and weaknesses. The goal is to confront their economic moats and identify which business model delivers the most resilient and sustainable competitive advantage today.
Revenue Segmentation: The Strategic Mix
This side-by-side comparison dissects how Shopify Inc. and Uber Technologies diversify income streams and reveals their primary sector bets:
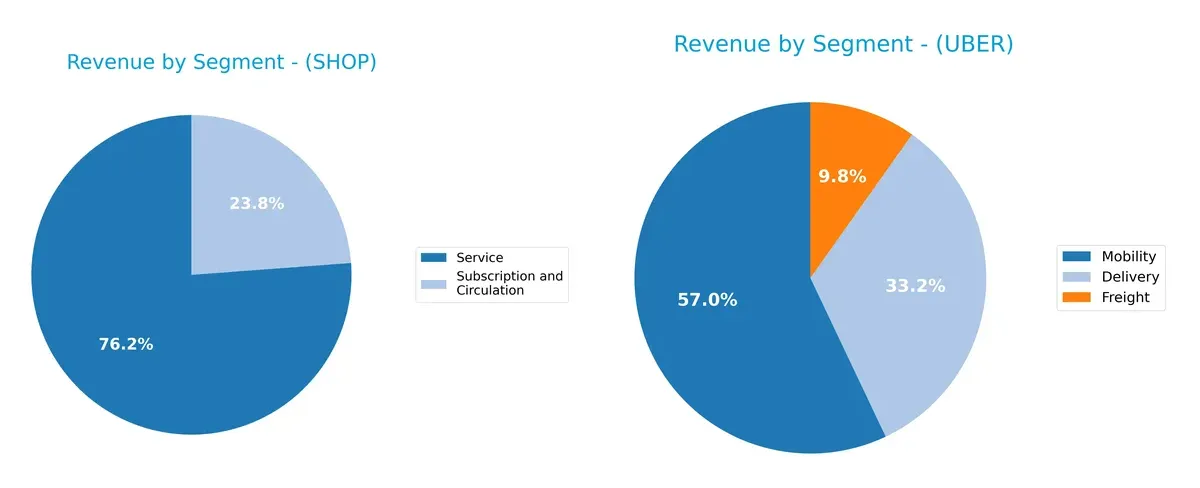
Shopify anchors revenue in two segments: Service at $8.8B and Subscription at $2.75B, showing moderate diversification. Uber dwarfs Shopify with a broader base: Mobility leads at $29.7B, followed by Delivery at $17.2B and Freight at $5.1B. Uber’s wider spread mitigates concentration risk, while Shopify’s reliance on Service highlights ecosystem lock-in but exposes it to merchant activity cycles. Uber’s infrastructure dominance signals scale advantages across transport and logistics.
Strengths and Weaknesses Comparison
This table compares the Strengths and Weaknesses of Shopify Inc. and Uber Technologies, Inc.:
Shopify Inc. Strengths
- Highly diversified revenue streams across services and subscriptions
- Extremely high current and quick ratios indicate strong short-term liquidity
- Very low debt-to-assets ratio and excellent interest coverage
- Strong fixed asset turnover suggests efficient asset use
Uber Technologies Strengths
- Robust profitability with strong net margin and ROE
- Favorable ROIC and manageable WACC support value creation
- Diverse business segments: Mobility, Delivery, Freight
- Solid global footprint with dominant US and EMEA revenue
- Good interest coverage and balanced debt ratios
Shopify Inc. Weaknesses
- Unfavorable ROE, ROIC, and WACC indicate capital inefficiency
- Extremely high P/E and P/B ratios suggest overvaluation risk
- Exceptionally high current ratio may imply excess idle assets
- No dividend yield limits income for yield-focused investors
Uber Technologies Weaknesses
- Unfavorable P/B ratio could reflect valuation concerns
- Moderate current ratio might signal tighter liquidity
- No dividend yield to attract income investors
Overall, Shopify shows strong liquidity and low leverage but struggles with capital efficiency and valuation. Uber demonstrates superior profitability and global market presence, though valuation and liquidity metrics warrant monitoring. These profiles reflect contrasting strategic priorities and financial health.
The Moat Duel: Analyzing Competitive Defensibility
A structural moat is the only true shield protecting a company’s long-term profits from relentless competitive erosion:
Shopify Inc.: Platform Ecosystem with Intangible Assets
Shopify’s moat stems from its robust commerce platform and merchant network. This drives high gross margins (~48%) and margin stability despite negative ROIC vs. WACC. New services could deepen its moat, but value destruction warns caution.
Uber Technologies, Inc.: Network Effects and Geographic Scale
Uber leverages strong network effects across global mobility and delivery. It sustains favorable margins (~19% net) and a ROIC well above WACC, proving efficient capital use. Expansion in freight and emerging markets could strengthen its advantage further.
Verdict: Platform Ecosystem vs. Network Dominance
Uber’s wider moat outpaces Shopify’s fragile value creation, thanks to consistent ROIC above cost of capital and diversified services. Uber is better equipped to defend and grow its market share in 2026.
Which stock offers better returns?
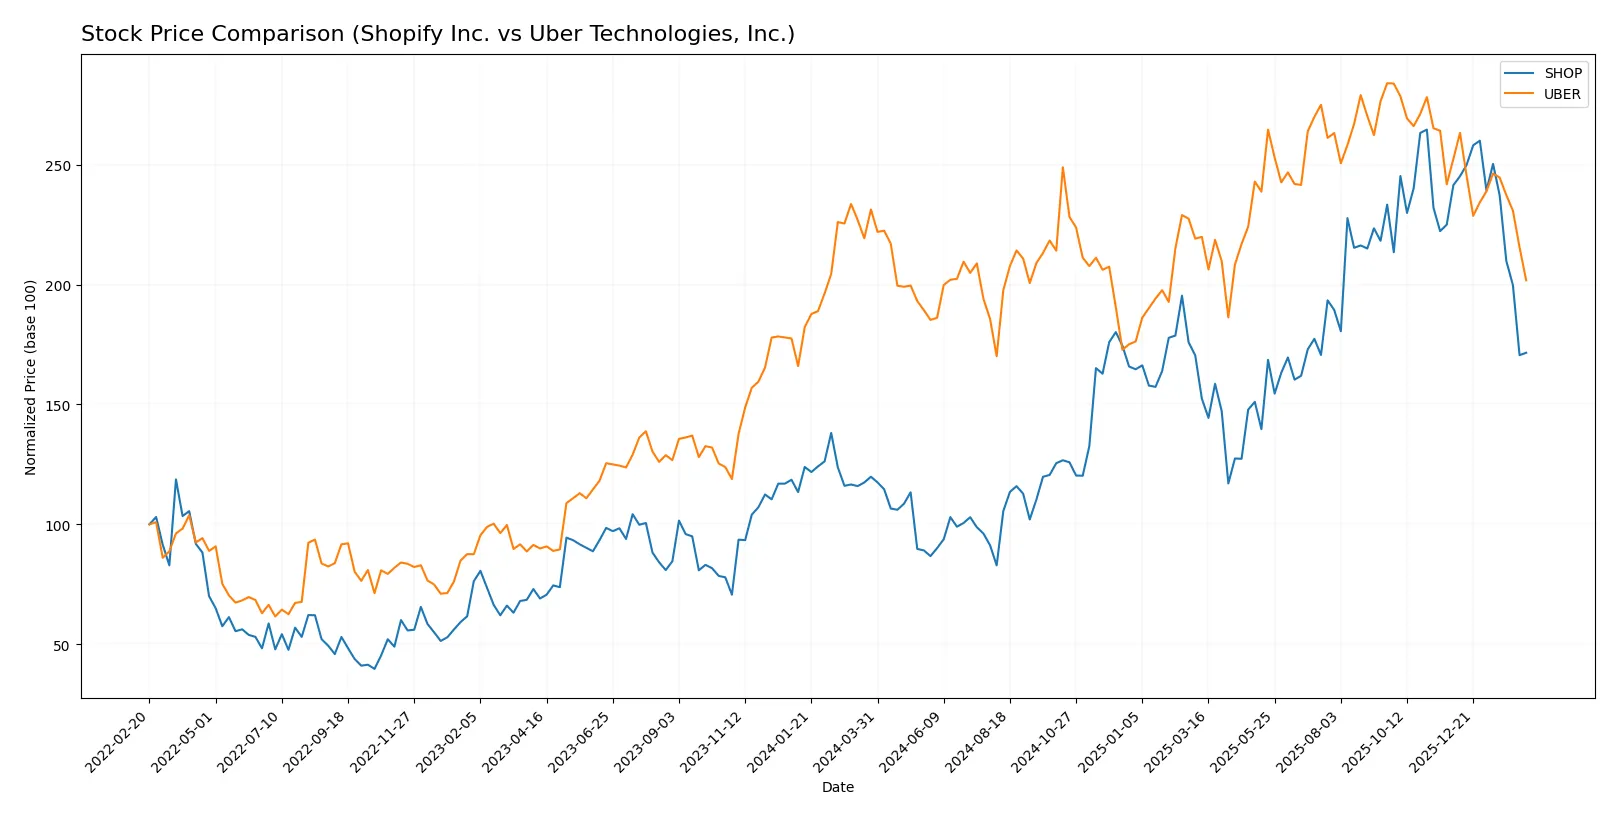
The past year showed contrasting stock movements for Shopify Inc. and Uber Technologies, Inc., with Shopify gaining significant ground despite recent pullbacks and Uber facing a consistent decline.
Trend Comparison
Shopify’s stock rose 43.17% over the past 12 months, signaling a bullish trend with decelerating momentum. Its volatility is high, with prices ranging from 54.43 to 173.86.
Uber’s stock fell 12.76% over the same period, confirming a bearish trend with deceleration. It showed lower volatility, fluctuating between 58.99 and 98.51.
Shopify outperformed Uber, delivering the highest market returns with a strong positive trend despite recent short-term weakness.
Target Prices
Analysts present a bullish consensus for Shopify Inc. and Uber Technologies, Inc., projecting significant upside from current prices.
| Company | Target Low | Target High | Consensus |
|---|---|---|---|
| Shopify Inc. | 115 | 200 | 167.04 |
| Uber Technologies, Inc. | 72 | 140 | 105.76 |
Shopify’s target consensus of 167.04 suggests a 48% premium over its 112.7 price, reflecting strong growth expectations. Uber’s consensus at 105.76 signals a 51% upside from its 69.99 price, highlighting optimism despite market volatility.

Don’t Let Luck Decide Your Entry Point
Optimize your entry points with our advanced ProRealTime indicators. You’ll get efficient buy signals with precise price targets for maximum performance. Start outperforming now!
How do institutions grade them?
Here are the latest institutional grades for Shopify Inc. and Uber Technologies, Inc.:
Shopify Inc. Grades
This table presents recent grades assigned by leading firms for Shopify Inc.
| Grading Company | Action | New Grade | Date |
|---|---|---|---|
| Citigroup | Maintain | Buy | 2026-02-13 |
| Wells Fargo | Maintain | Overweight | 2026-02-12 |
| Truist Securities | Maintain | Hold | 2026-02-12 |
| UBS | Maintain | Neutral | 2026-02-12 |
| Mizuho | Upgrade | Outperform | 2026-02-12 |
| Citizens | Maintain | Market Outperform | 2026-02-12 |
| RBC Capital | Maintain | Outperform | 2026-02-12 |
| BMO Capital | Maintain | Outperform | 2026-02-12 |
| Cantor Fitzgerald | Maintain | Neutral | 2026-02-12 |
| Barclays | Maintain | Equal Weight | 2026-02-12 |
Uber Technologies, Inc. Grades
Below are recent institutional grades issued for Uber Technologies, Inc.
| Grading Company | Action | New Grade | Date |
|---|---|---|---|
| Citigroup | Maintain | Buy | 2026-02-06 |
| Morgan Stanley | Maintain | Overweight | 2026-02-05 |
| Wedbush | Maintain | Neutral | 2026-02-05 |
| Benchmark | Maintain | Hold | 2026-02-05 |
| JP Morgan | Maintain | Overweight | 2026-02-05 |
| Citizens | Upgrade | Market Outperform | 2026-02-05 |
| RBC Capital | Maintain | Outperform | 2026-02-05 |
| Wells Fargo | Maintain | Overweight | 2026-02-05 |
| Mizuho | Maintain | Outperform | 2026-02-05 |
| Needham | Maintain | Buy | 2026-02-05 |
Which company has the best grades?
Both companies receive predominantly positive grades, including multiple Buy, Outperform, and Overweight ratings. Shopify shows a slightly broader range, including a recent upgrade to Outperform by Mizuho. This diversity may signal stronger confidence among analysts. Investors should consider how these grades align with their risk tolerance and portfolio goals.
Risks specific to each company
The following categories identify the critical pressure points and systemic threats facing both firms in the 2026 market environment:
1. Market & Competition
Shopify Inc.
- Faces intense competition in highly fragmented e-commerce software with pressure on innovation and pricing power.
Uber Technologies, Inc.
- Competes in diverse mobility, delivery, and freight markets with regulatory hurdles and established local rivals.
2. Capital Structure & Debt
Shopify Inc.
- Extremely low debt levels (D/E 0.01) reduce financial risk but high valuation metrics suggest limited margin for error.
Uber Technologies, Inc.
- Moderate debt load (D/E 0.5) manageable but requires vigilant cash flow to sustain interest coverage and growth investments.
3. Stock Volatility
Shopify Inc.
- High beta (2.82) indicates substantial stock price volatility, increasing investment risk in turbulent markets.
Uber Technologies, Inc.
- Lower beta (1.21) suggests more stable stock price movements relative to market benchmarks.
4. Regulatory & Legal
Shopify Inc.
- Subject to data privacy and e-commerce regulations globally, with compliance costs potentially rising.
Uber Technologies, Inc.
- Faces regulatory scrutiny in ride-sharing, labor classification, and food delivery sectors, elevating legal risk.
5. Supply Chain & Operations
Shopify Inc.
- Relies on third-party logistics and payment processors; disruptions could impair merchant services and customer satisfaction.
Uber Technologies, Inc.
- Operational complexity in managing thousands of independent drivers and delivery partners exposes it to scalability risks.
6. ESG & Climate Transition
Shopify Inc.
- Increasing pressure to improve carbon footprint of digital commerce infrastructure and data centers.
Uber Technologies, Inc.
- Faces challenges reducing emissions in transportation segments and meeting evolving ESG investor expectations.
7. Geopolitical Exposure
Shopify Inc.
- Exposure to global e-commerce regulations and trade policies, especially in Europe and Asia Pacific.
Uber Technologies, Inc.
- High geographic diversification but vulnerable to geopolitical tensions affecting mobility and delivery operations.
Which company shows a better risk-adjusted profile?
Uber’s moderate debt and lower stock volatility contribute to a more balanced risk profile, despite regulatory challenges. Shopify’s exceptional liquidity and minimal debt are strengths but offset by high valuation multiples and extreme stock volatility. Uber’s higher ROE and favorable cash flow metrics reflect stronger capital efficiency. However, Uber’s regulatory and operational complexities pose notable risks. Shopify’s elevated beta and expensive valuation metrics amplify market risk. Overall, Uber offers a better risk-adjusted profile given its stable financial ratios and market positioning, validated by its robust Altman Z-score and Piotroski score. Shopify’s most impactful risk is its stretched valuation; Uber’s is regulatory/legal exposure. Uber’s recent strong profitability and manageable leverage underpin my cautious preference.
Final Verdict: Which stock to choose?
Shopify Inc. shines with an unmatched ability to scale rapidly while maintaining strong cash flow conversion. Its superpower lies in relentless reinvestment into innovation, fueling growth. However, its sky-high valuation and stretched current ratio call for caution. It fits well in an aggressive growth portfolio willing to tolerate volatility for outsized gains.
Uber Technologies, Inc. benefits from a durable strategic moat anchored in network effects and recurring revenue from multiple verticals. Its robust profitability and value creation outshine Shopify’s, offering better stability. This profile suits growth-at-a-reasonable-price (GARP) investors who seek quality growth without overpaying.
If you prioritize rapid expansion and market share capture, Shopify is the compelling choice due to its innovation-driven growth engine. However, if you seek sustainable profitability and a proven competitive advantage, Uber offers a better risk-adjusted profile and commands a more reasonable valuation.
Disclaimer: Investment carries a risk of loss of initial capital. The past performance is not a reliable indicator of future results. Be sure to understand risks before making an investment decision.
Go Further
I encourage you to read the complete analyses of Shopify Inc. and Uber Technologies, Inc. to enhance your investment decisions: