Home > Comparison > Technology > SHOP vs TYL
The strategic rivalry between Shopify Inc. and Tyler Technologies defines a critical axis in the technology sector’s software-application industry. Shopify drives growth as a global commerce platform capitalizing on high-volume digital retail. Tyler, by contrast, builds durable value through specialized, integrated public sector software solutions. This analysis will assess which company’s model offers superior risk-adjusted returns, guiding investors seeking resilient exposure in today’s evolving tech landscape.
Table of contents
Companies Overview
Shopify Inc. and Tyler Technologies, Inc. represent transformative forces in the software application market, each commanding distinct niches with substantial market influence.
Shopify Inc.: Global Commerce Platform Leader
Shopify dominates e-commerce infrastructure by enabling merchants worldwide to build and manage online and physical stores. Its revenue stems from subscription solutions and merchant services, including payments and fulfillment. In 2026, Shopify emphasizes expanding its platform capabilities and merchant financing to deepen its ecosystem and accelerate growth internationally.
Tyler Technologies, Inc.: Public Sector Software Specialist
Tyler Technologies specializes in integrated public sector management software, serving government agencies across financial, judicial, and educational functions. Its revenue derives from software licenses, SaaS, and professional services. In 2026, Tyler focuses on enhancing cloud-based solutions through its AWS partnership, aiming to streamline government operations and increase recurring revenue.
Strategic Collision: Similarities & Divergences
Both companies excel in software applications but diverge sharply in target markets—Shopify targets global commerce, while Tyler serves public sector clients. Their competition lies in software innovation and client retention within specialized verticals. Shopify offers a high-growth investment with platform scalability; Tyler provides stability through government contracts and steady SaaS adoption.
Income Statement Comparison
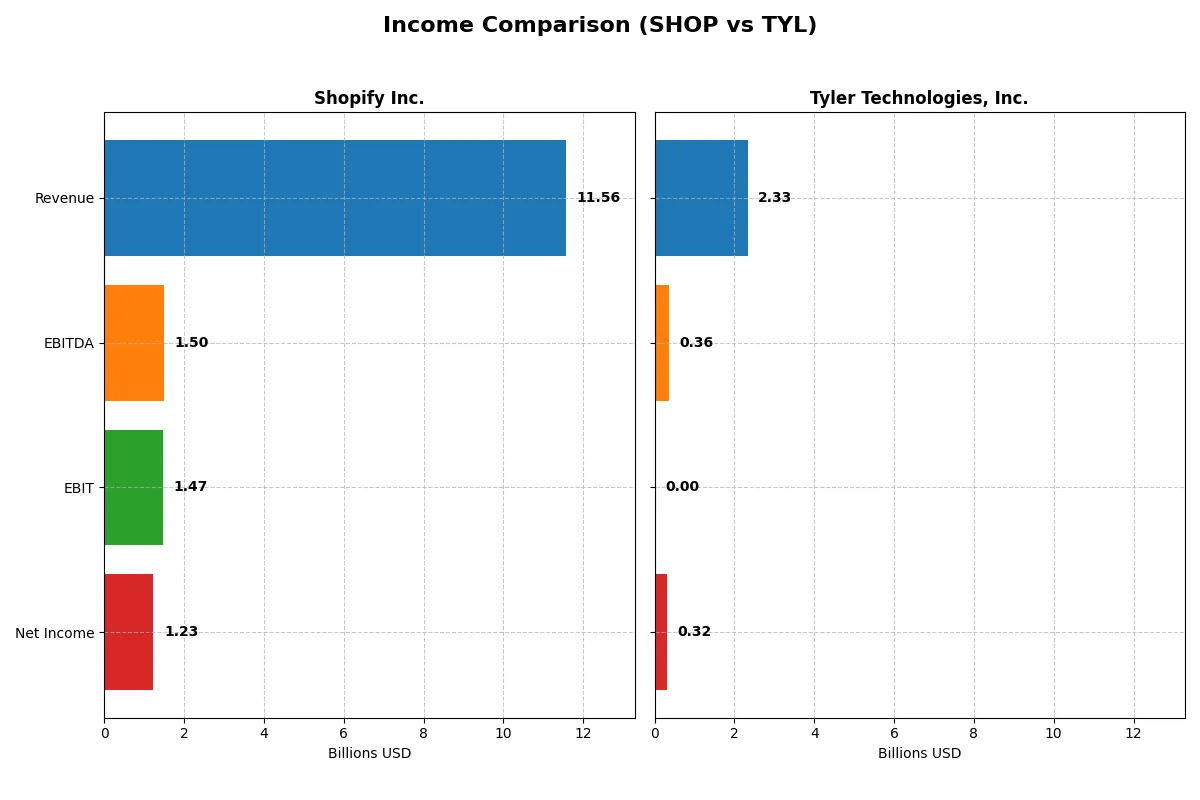
This data dissects the core profitability and scalability of both corporate engines to reveal who dominates the bottom line:
| Metric | Shopify Inc. (SHOP) | Tyler Technologies, Inc. (TYL) |
|---|---|---|
| Revenue | 11.6B | 2.3B |
| Cost of Revenue | 6.0B | 1.2B |
| Operating Expenses | 4.1B | 670M |
| Gross Profit | 5.6B | 1.1B |
| EBITDA | 1.5B | 358M |
| EBIT | 1.5B | 0 |
| Interest Expense | 0 | 5M |
| Net Income | 1.2B | 316M |
| EPS | 0.95 | 7.32 |
| Fiscal Year | 2025 | 2025 |
Income Statement Analysis: The Bottom-Line Duel
The following income statement comparison reveals the true operational efficiency and profit dynamics of two distinct corporate engines.
Shopify Inc. Analysis
Shopify’s revenue surged from 4.6B in 2021 to 11.6B in 2025, showcasing impressive top-line growth. Gross margins remain healthy near 48%, but net income fell sharply to 1.2B in 2025 from 2.9B in 2021, reflecting margin compression and rising expenses. The latest year signals strong revenue momentum, yet net margin and EPS declined significantly, indicating cost pressures despite scale.
Tyler Technologies, Inc. Analysis
Tyler’s revenue grew steadily from 1.6B in 2021 to 2.3B in 2025, a solid expansion. Gross margin held firm around 46%, while net margin improved to 13.5%, supported by controlled cost growth. Despite a one-year EBIT dip to zero in 2025, net income nearly doubled over five years, signaling consistent profitability improvement and efficient capital allocation driving EPS growth.
Margin Power vs. Revenue Scale
Shopify commands greater revenue scale and gross profit, yet suffers from declining net margins and earnings volatility. Tyler posts moderate revenue growth but sustains superior net margin expansion and steadier profit growth. Tyler’s profile offers a clearer fundamental winner in profitability, appealing to investors prioritizing margin stability over sheer scale.
Financial Ratios Comparison
These vital ratios act as a diagnostic tool to expose the underlying fiscal health, valuation premiums, and capital efficiency of the companies analyzed:
| Ratios | Shopify Inc. (SHOP) | Tyler Technologies, Inc. (TYL) |
|---|---|---|
| ROE | 9.14% | N/A |
| ROIC | 15.66% | N/A |
| P/E | 170x | 62x |
| P/B | 15.52x | N/A |
| Current Ratio | 12.86 | 0 |
| Quick Ratio | 12.86 | 0 |
| D/E | 0.014 | 0 |
| Debt-to-Assets | 1.24% | 0 |
| Interest Coverage | 0 | -71.61 |
| Asset Turnover | 0.76 | 0 |
| Fixed Asset Turnover | 82.0 | 0 |
| Payout ratio | 0% | 0% |
| Dividend yield | 0% | 0% |
| Fiscal Year | 2025 | 2025 |
Efficiency & Valuation Duel: The Vital Signs
Financial ratios serve as a company’s DNA, exposing hidden risks and operational strengths that define its market standing.
Shopify Inc.
Shopify displays moderate profitability with a 9.14% ROE and a 10.65% net margin, but its valuation is stretched, marked by a 169.86 P/E and 15.52 P/B. The firm returns no dividends, opting instead to reinvest heavily in R&D, fueling growth. Its strong quick ratio contrasts with a problematic current ratio, signaling liquidity imbalances.
Tyler Technologies, Inc.
Tyler posts a favorable 13.53% net margin but reports zero ROE and ROIC, reflecting underlying profitability concerns. The stock trades at a high 61.99 P/E, indicating expensive valuation. Tyler has no dividend yield and limited liquidity data, raising caution. Its debt levels are low, but several operational metrics are unavailable or unfavorable.
Premium Valuation vs. Operational Safety
Shopify’s high valuation and reinvestment strategy contrast with Tyler’s lack of profitability metrics and sparse liquidity data. Shopify offers more operational transparency despite stretched multiples. Investors seeking growth might prefer Shopify’s profile, while cautious investors face uncertainty with Tyler’s incomplete picture.
Which one offers the Superior Shareholder Reward?
I observe that neither Shopify Inc. (SHOP) nor Tyler Technologies, Inc. (TYL) pays dividends, focusing instead on reinvestment and buybacks. Shopify’s free cash flow per share stands at $1.55 in 2025 with no dividend payout but a strong buyback philosophy implied by a zero dividend payout ratio and high cash reserves ($4.45/share). Tyler delivers a superior free cash flow per share of $14.79 in 2025, also without dividends, but with a robust buyback program reflected in a low price-to-free-cash-flow ratio (30.7) versus Shopify’s stretched 104.2. Tyler’s modest leverage and consistent operating cash flow coverage ratios around 0.6-1.0 indicate a sustainable buyback capacity. Shopify’s sky-high P/E (170x) signals stretched valuation risking future returns. I conclude Tyler Technologies offers a more attractive total shareholder return profile in 2026 due to its sustainable buyback intensity, stronger free cash flow generation, and reasonable valuation.
Comparative Score Analysis: The Strategic Profile
The radar chart reveals the fundamental DNA and trade-offs of Shopify Inc. and Tyler Technologies, Inc., highlighting their financial strengths and valuation challenges:
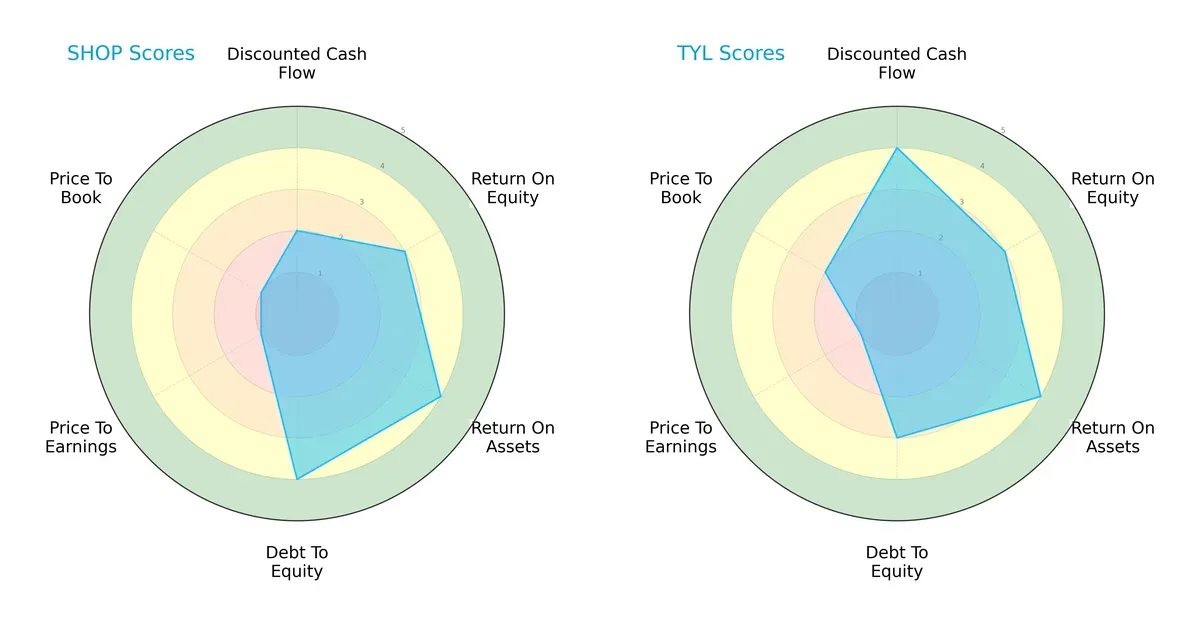
Shopify leans on a strong balance sheet with favorable debt-to-equity and return on assets scores but struggles with valuation metrics. Tyler demonstrates a robust discounted cash flow score and a slightly better price-to-book ratio, indicating more balanced financial health. Shopify’s edge is in asset efficiency, while Tyler’s strength lies in cash flow discipline.
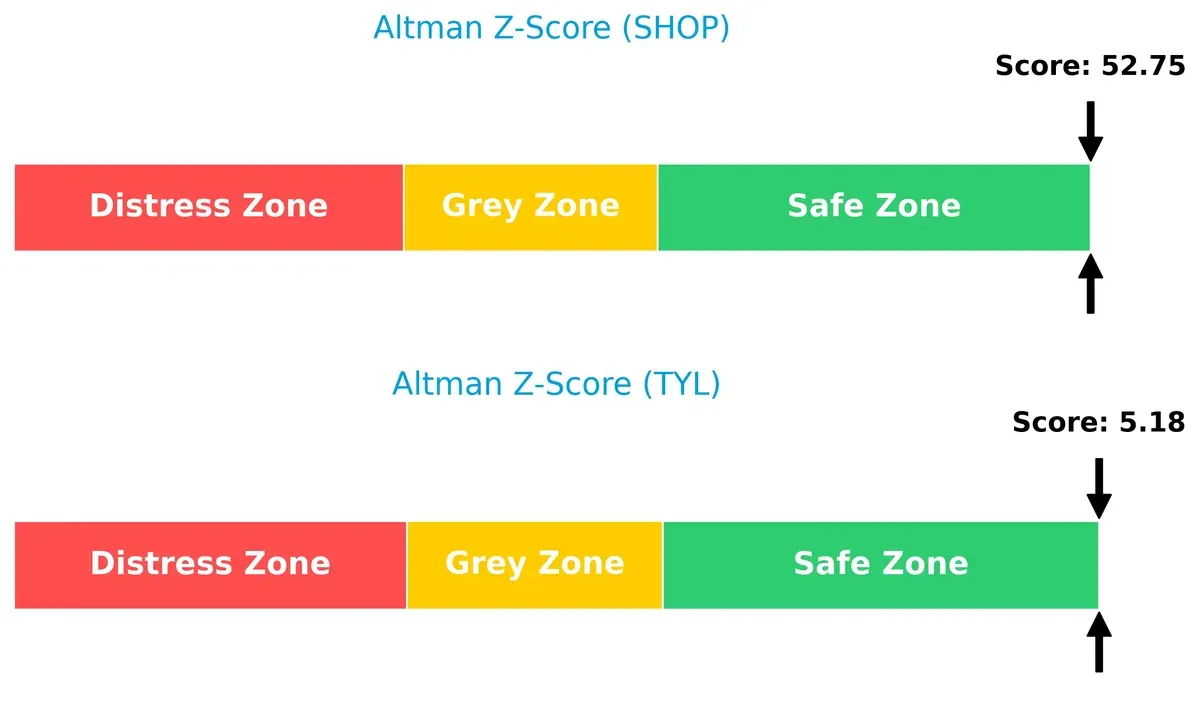
Bankruptcy Risk: Solvency Showdown
The Altman Z-Score gap strongly favors Shopify, signaling a superior buffer against bankruptcy risk and greater long-term survival potential in this cycle:
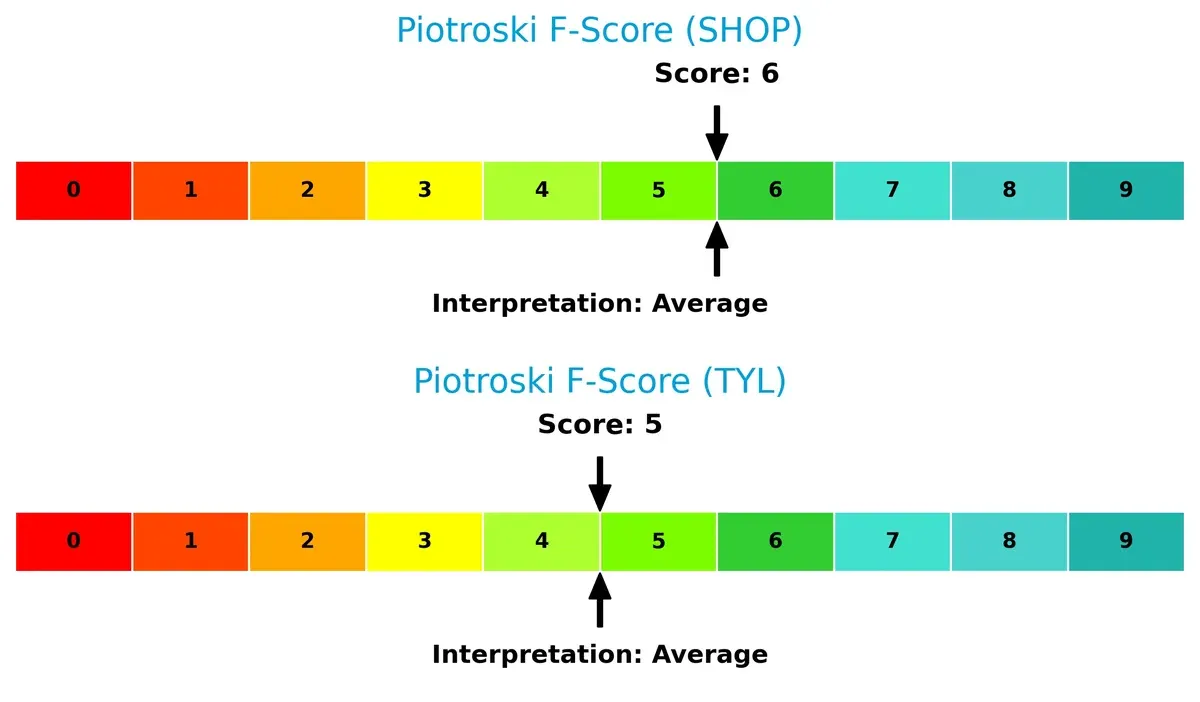
Financial Health: Quality of Operations
Both firms display average Piotroski F-Scores, with Shopify slightly ahead, suggesting marginally better internal financial health but no alarming red flags for either company at present:
How are the two companies positioned?
This section dissects the operational DNA of Shopify and Tyler by comparing their revenue distribution and internal dynamics. The goal is to confront their economic moats to identify which model delivers the most resilient competitive advantage today.
Revenue Segmentation: The Strategic Mix
This comparison dissects how Shopify Inc. and Tyler Technologies diversify their income streams and where their primary sector bets lie:
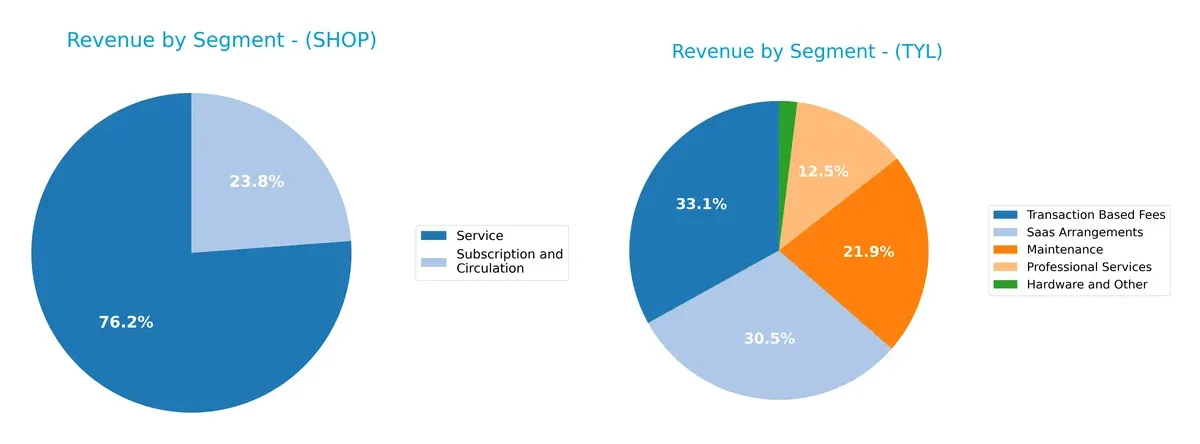
Shopify’s 2025 revenue pivots around a dominant Service segment at $8.8B, complemented by $2.75B from Subscription and Circulation, showing moderate diversification. Tyler Technologies spreads its 2024 revenue more evenly across five segments, ranging from $41M to $698M, reflecting a balanced portfolio. Shopify’s focus on merchant services anchors its ecosystem lock-in, while Tyler’s diversified model mitigates concentration risk through multiple steady streams.
Strengths and Weaknesses Comparison
This table compares the strengths and weaknesses of Shopify Inc. and Tyler Technologies, Inc.:
Shopify Inc. Strengths
- Strong service revenue of 8.8B in 2025
- High quick ratio at 12.86 indicates liquidity
- Very low debt to equity at 0.01
- High fixed asset turnover at 81.96 signals efficient asset use
Tyler Technologies, Inc. Strengths
- Diverse revenue streams including SaaS and transaction fees
- Favorable low debt to equity and debt to assets ratios
- Positive net margin at 13.53%
- Favorable PB ratio at 0 suggests undervaluation
Shopify Inc. Weaknesses
- ROIC at 15.66% below WACC at 16.91%, indicating value destruction
- High PE of 169.86 suggests overvaluation
- Unfavorable current ratio at 12.86 despite high quick ratio
- Zero dividend yield limits income appeal
Tyler Technologies, Inc. Weaknesses
- ROE and ROIC both at 0%, showing poor capital efficiency
- Unavailable WACC data limits cost of capital assessment
- Negative interest coverage ratio indicates financial stress
- Asset turnover and fixed asset turnover at 0 signal inefficiency
Both companies exhibit clear financial strengths but also notable weaknesses. Shopify’s strong liquidity and asset efficiency contrast with its valuation and capital returns challenges. Tyler shows diversified revenue and solid margins but struggles with capital efficiency and financial health metrics. These factors shape their strategic priorities and risk profiles differently.
The Moat Duel: Analyzing Competitive Defensibility
A structural moat alone protects long-term profits from competition’s relentless erosion. Let’s dissect how Shopify and Tyler Technologies defend their turf:
Shopify Inc.: Platform Network Effect Powerhouse
Shopify’s primary moat is its network effect, linking millions of merchants and buyers. Its financials show strong revenue growth but ROIC lags WACC, signaling value destruction despite margin stability. Expanding commerce services in 2026 could deepen this moat if profitability improves.
Tyler Technologies, Inc.: Niche Public Sector Software Specialist
Tyler’s moat rests on specialized public sector software and long-term government contracts, contrasting Shopify’s broad commerce platform. It delivers solid net margins and steady revenue growth, though ROIC data is unavailable. Its focus on SaaS and cloud services offers promising expansion opportunities.
Verdict: Network Effects vs. Specialized Contractual Lock-in
Shopify’s expansive network effect offers a wider moat, driving rapid top-line growth despite current profitability challenges. Tyler’s specialized, contract-based moat is narrower but more stable. Shopify is better poised to defend market share if it converts growth into sustained returns.
Which stock offers better returns?
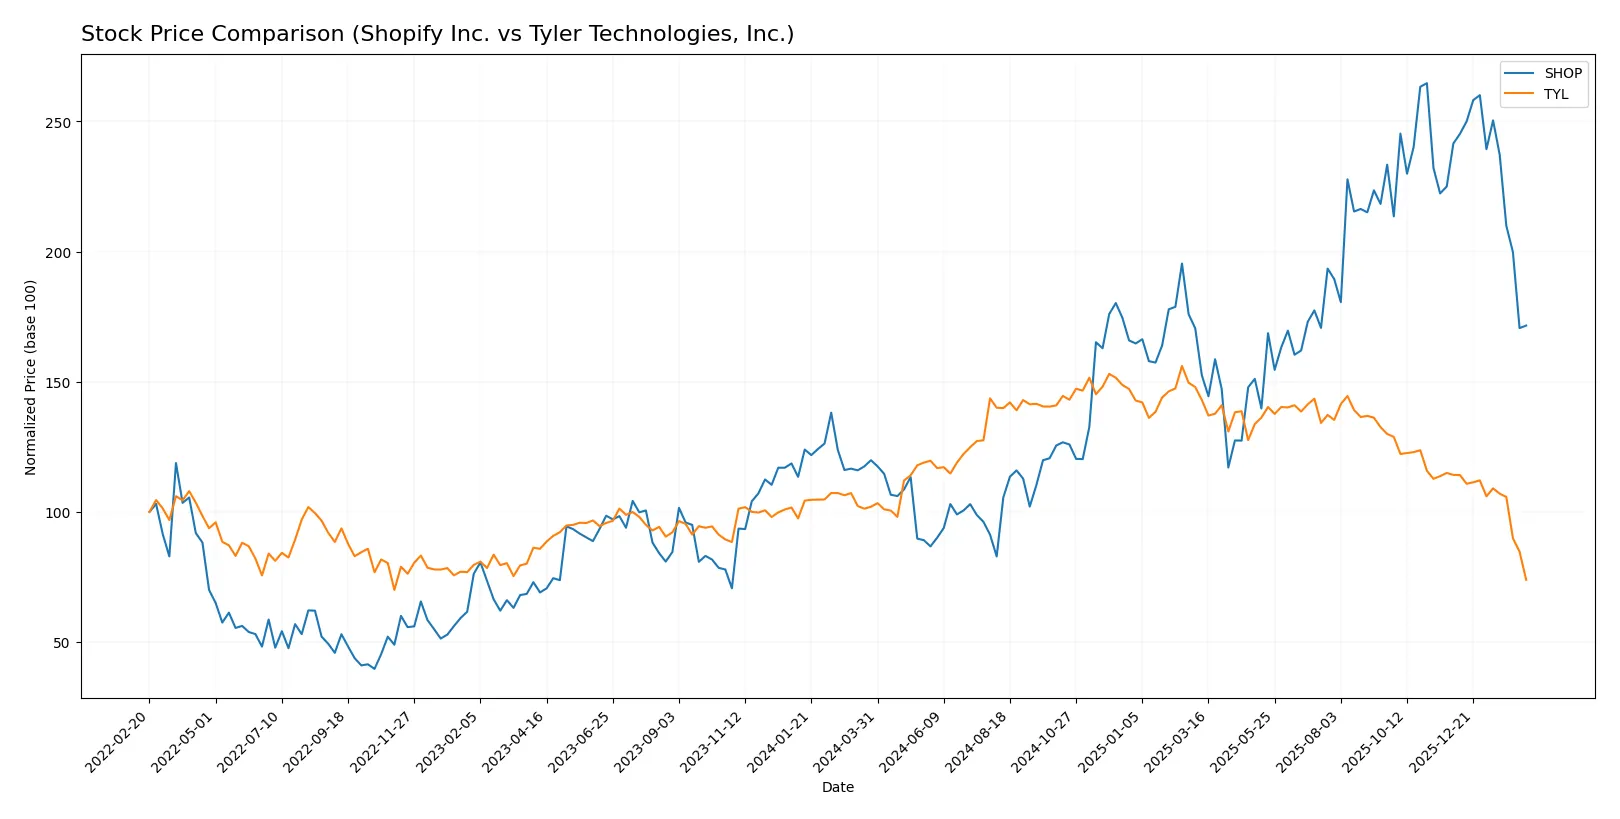
Over the past year, Shopify Inc. surged 43.17%, showing a bullish but decelerating trend, while Tyler Technologies, Inc. declined 27.51%, reflecting a bearish and decelerating trajectory.
Trend Comparison
Shopify Inc. posted a 43.17% price increase over 12 months, marking a bullish trend with decelerating momentum and a high volatility of 33.42%. The stock peaked at 173.86 and bottomed at 54.43.
Tyler Technologies, Inc. declined 27.51% in the same period, confirming a bearish trend with deceleration and higher volatility at 68.01%. Its price ranged between 303.94 and 641.7.
Shopify outperformed Tyler significantly, delivering the highest market return with strong positive momentum despite recent deceleration. Tyler showed persistent weakness and elevated volatility.
Target Prices
Analysts present a bullish consensus for both Shopify Inc. and Tyler Technologies, Inc., reflecting strong growth expectations.
| Company | Target Low | Target High | Consensus |
|---|---|---|---|
| Shopify Inc. | 115 | 200 | 167.04 |
| Tyler Technologies, Inc. | 325 | 675 | 473.91 |
Shopify’s consensus target at $167 significantly exceeds its current $113 price, signaling upside potential. Tyler Technologies’ consensus near $474 also suggests considerable appreciation from the current $304 level.

Don’t Let Luck Decide Your Entry Point
Optimize your entry points with our advanced ProRealTime indicators. You’ll get efficient buy signals with precise price targets for maximum performance. Start outperforming now!
How do institutions grade them?
Here are the latest institutional grades for Shopify Inc. and Tyler Technologies, Inc.:
Shopify Inc. Grades
The table below shows recent ratings from major financial institutions for Shopify Inc.
| Grading Company | Action | New Grade | Date |
|---|---|---|---|
| Citigroup | Maintain | Buy | 2026-02-13 |
| Wells Fargo | Maintain | Overweight | 2026-02-12 |
| Truist Securities | Maintain | Hold | 2026-02-12 |
| UBS | Maintain | Neutral | 2026-02-12 |
| Mizuho | Upgrade | Outperform | 2026-02-12 |
| Citizens | Maintain | Market Outperform | 2026-02-12 |
| RBC Capital | Maintain | Outperform | 2026-02-12 |
| BMO Capital | Maintain | Outperform | 2026-02-12 |
| Cantor Fitzgerald | Maintain | Neutral | 2026-02-12 |
| Barclays | Maintain | Equal Weight | 2026-02-12 |
Tyler Technologies, Inc. Grades
The following table summarizes the recent institutional grades for Tyler Technologies, Inc.
| Grading Company | Action | New Grade | Date |
|---|---|---|---|
| Oppenheimer | Maintain | Outperform | 2026-02-13 |
| Piper Sandler | Maintain | Overweight | 2026-02-13 |
| Needham | Maintain | Buy | 2026-02-13 |
| TD Cowen | Maintain | Buy | 2026-02-13 |
| Evercore ISI Group | Maintain | In Line | 2026-02-13 |
| Wells Fargo | Maintain | Equal Weight | 2026-02-13 |
| Barclays | Maintain | Overweight | 2026-02-13 |
| Stifel | Maintain | Buy | 2026-02-13 |
| DA Davidson | Upgrade | Buy | 2026-02-11 |
| BTIG | Maintain | Buy | 2026-02-09 |
Which company has the best grades?
Tyler Technologies holds a stronger consensus of Buy and Outperform grades. Shopify shows a broader range, including Neutral and Hold ratings. Investors may view Tyler as more favored currently, reflecting greater institutional conviction.
Risks specific to each company
The following categories identify the critical pressure points and systemic threats facing both Shopify Inc. and Tyler Technologies, Inc. in the 2026 market environment:
1. Market & Competition
Shopify Inc.
- Faces fierce competition in e-commerce platforms with high innovation demand and shifting customer preferences.
Tyler Technologies, Inc.
- Competes in niche public sector software with stable demand but faces risks from slower government budgets.
2. Capital Structure & Debt
Shopify Inc.
- Maintains very low debt levels with strong interest coverage, indicating financial flexibility.
Tyler Technologies, Inc.
- Shows minimal debt but weak interest coverage and incomplete liquidity ratios, raising caution.
3. Stock Volatility
Shopify Inc.
- Exhibits high beta (2.82), reflecting significant stock price volatility and market sensitivity.
Tyler Technologies, Inc.
- Has a low beta (0.90), indicating more stable stock price behavior and lower risk.
4. Regulatory & Legal
Shopify Inc.
- Exposure to global e-commerce regulations and data privacy laws across multiple jurisdictions.
Tyler Technologies, Inc.
- Subject to public sector compliance requirements and potential legal challenges in government contracting.
5. Supply Chain & Operations
Shopify Inc.
- Depends on complex logistics and third-party fulfillment, vulnerable to global supply chain disruptions.
Tyler Technologies, Inc.
- Operates with software delivery and cloud services, subject to technology infrastructure and vendor risks.
6. ESG & Climate Transition
Shopify Inc.
- Faces pressure to reduce carbon footprint and ensure sustainable operations in e-commerce logistics.
Tyler Technologies, Inc.
- Increasing focus on ESG compliance in public sector contracts but less direct environmental impact.
7. Geopolitical Exposure
Shopify Inc.
- Operates globally, exposed to trade tensions, currency fluctuations, and geopolitical instability.
Tyler Technologies, Inc.
- Primarily US-focused, with less exposure but concentrated regulatory and political risk domestically.
Which company shows a better risk-adjusted profile?
Shopify’s highest risk is its elevated stock volatility and market competition, while Tyler’s main risk lies in weaker financial liquidity and operational dependence on government budgets. Tyler’s stable stock and moderate leverage suggest a better risk-adjusted profile. However, Shopify’s strong balance sheet and global reach offer upside but with greater caution warranted. The stark contrast in beta and debt coverage highlights Tyler’s relative stability versus Shopify’s growth-driven risk.
Final Verdict: Which stock to choose?
Shopify Inc. impresses with its superpower as a cash-generating engine, fueled by rapid revenue growth and robust operational cash flow. However, its high valuation multiples and stretched current ratio warrant caution. It suits investors chasing aggressive growth with a tolerance for premium pricing and short-term volatility.
Tyler Technologies, Inc. stands out for its strategic moat in stable, recurring government software contracts, offering a safety cushion absent in Shopify’s hyper-growth model. Its financial profile reflects moderate risk and steady income growth, making it a fit for those seeking GARP—growth at a reasonable price—and greater stability.
If you prioritize dynamic expansion and can stomach valuation risks, Shopify’s accelerating profitability and cash flow might outshine Tyler’s steadiness. However, if you seek a more defensive stance with recurring revenue and moderate growth, Tyler offers better stability amid market turbulence, despite its recent price weakness.
Disclaimer: Investment carries a risk of loss of initial capital. The past performance is not a reliable indicator of future results. Be sure to understand risks before making an investment decision.
Go Further
I encourage you to read the complete analyses of Shopify Inc. and Tyler Technologies, Inc. to enhance your investment decisions: