Home > Comparison > Technology > SHOP vs MSTR
The strategic rivalry between Shopify Inc. and Strategy Inc. shapes the technology sector’s evolution. Shopify operates as a scalable commerce platform enabling merchants worldwide, while Strategy Inc. blends bitcoin treasury management with AI-driven enterprise analytics. This head-to-head contrasts a market-leading SaaS provider against a niche, innovation-driven analytics firm. This analysis aims to identify which trajectory delivers superior risk-adjusted returns for diversified portfolios amid shifting tech dynamics.

Table of contents
Companies Overview
Shopify Inc. and Strategy Inc. both hold influential roles in the evolving software application market.
Shopify Inc.: Global Commerce Platform Leader
Shopify Inc. dominates as a commerce platform provider, enabling merchants worldwide to manage sales across multiple channels. Its core revenue derives from subscription fees and merchant solutions like payment processing and shipping. In 2026, Shopify emphasizes expanding its ecosystem to enhance merchant services and streamline e-commerce operations globally.
Strategy Inc.: Bitcoin Treasury & AI Analytics Pioneer
Strategy Inc. operates primarily as a bitcoin treasury company combined with AI-driven enterprise analytics software. It earns revenue through securities exposure to Bitcoin and licensing its analytics platforms. The company’s 2026 focus lies in broadening AI solutions while maintaining its unique position in cryptocurrency investment services.
Strategic Collision: Similarities & Divergences
Both firms are entrenched in software applications but diverge sharply in approach—Shopify builds an open commerce ecosystem while Strategy Inc. offers specialized closed financial products. Their competition centers on digital transformation, with Shopify targeting merchants and Strategy Inc. targeting institutional investors. Their investment profiles differ markedly: Shopify is a growth-oriented platform, whereas Strategy Inc. blends fintech innovation with cryptocurrency exposure.
Income Statement Comparison
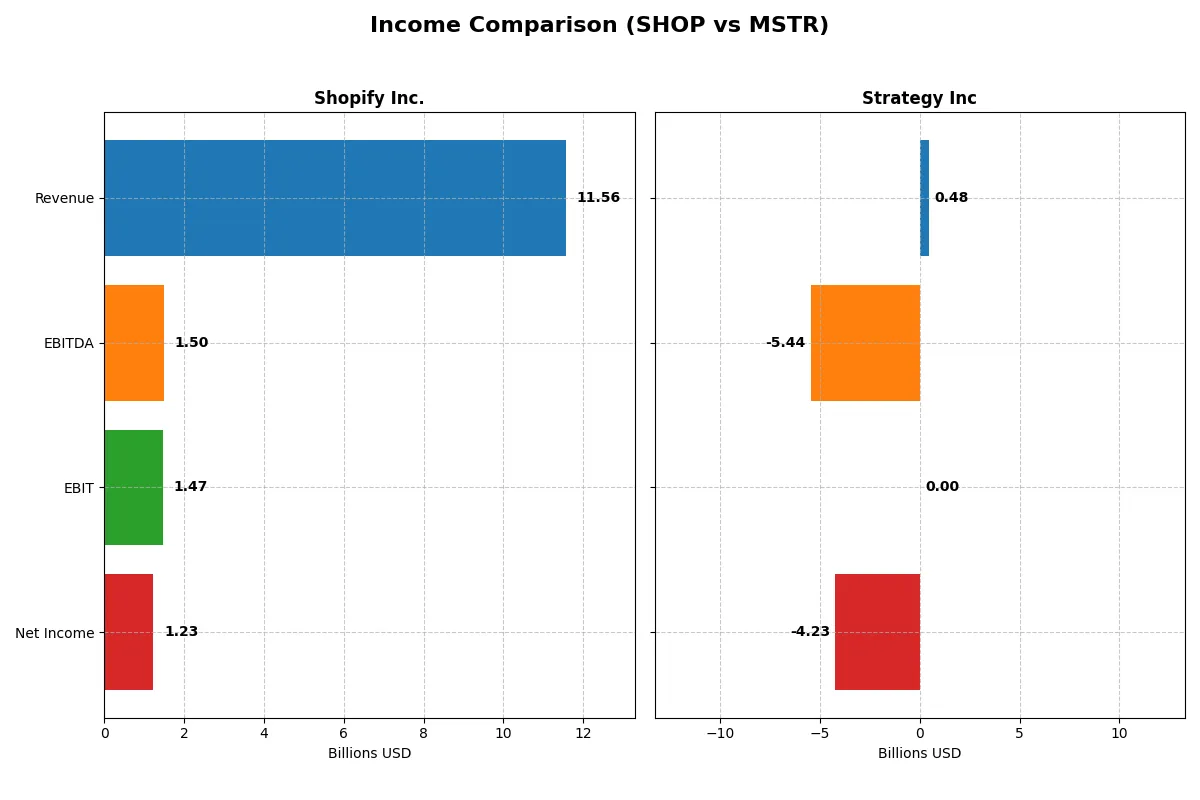
The following data dissects the core profitability and scalability of both corporate engines to reveal who dominates the bottom line:
| Metric | Shopify Inc. (SHOP) | Strategy Inc (MSTR) |
|---|---|---|
| Revenue | 11.56B | 477M |
| Cost of Revenue | 6.00B | 149M |
| Operating Expenses | 4.09B | 5.62B |
| Gross Profit | 5.56B | 328M |
| EBITDA | 1.50B | -5.44B |
| EBIT | 1.47B | 0 |
| Interest Expense | 0 | 65M |
| Net Income | 1.23B | -4.23B |
| EPS | 0.95 | -15.23 |
| Fiscal Year | 2025 | 2025 |
Income Statement Analysis: The Bottom-Line Duel
This income statement comparison reveals how each company’s financial engine drives revenue, profit, and margin efficiency over recent years.
Shopify Inc. Analysis
Shopify’s revenue surged from 4.6B in 2021 to 11.6B in 2025, demonstrating strong top-line momentum. Gross margin holds steady around 48%, reflecting disciplined cost control. Despite a 10.65% net margin in 2025, net income fell 39% year-over-year to 1.23B, signaling pressure on bottom-line growth despite expanding sales.
Strategy Inc Analysis
Strategy’s revenue remains modest near 477M in 2025, showing little growth over five years. The company posts a high gross margin of 68.7%, indicating efficient cost of goods sold. However, persistent operating losses and a net margin deeply negative at -886% in 2025 highlight significant profitability challenges and cash burn risk.
Verdict: Revenue Growth vs. Margin Strength
Shopify delivers robust revenue growth with decent margin discipline but struggles to sustain net income growth. Strategy commands superior gross margin yet suffers severe net losses, undermining profitability. For investors, Shopify’s scale and improving operational efficiency present a clearer path to sustainable earnings than Strategy’s margin advantage weighed down by losses.
Financial Ratios Comparison
These vital ratios act as a diagnostic tool to expose the underlying fiscal health, valuation premiums, and capital efficiency of the companies analyzed below:
| Ratios | Shopify Inc. (SHOP) | Strategy Inc (MSTR) |
|---|---|---|
| ROE | 9.14% | -8.29% |
| ROIC | 15.66% | -6.19% |
| P/E | 169.9 | -9.98 |
| P/B | 15.52 | 0.83 |
| Current Ratio | 12.86 | 5.62 |
| Quick Ratio | 12.86 | 5.62 |
| D/E (Debt-to-Equity) | 0.014 | 0.16 |
| Debt-to-Assets | 1.24% | 13.44% |
| Interest Coverage | 0 | 83.80 |
| Asset Turnover | 0.76 | 0.008 |
| Fixed Asset Turnover | 81.96 | 6.29 |
| Payout Ratio | 0 | 0 |
| Dividend Yield | 0% | 0% |
| Fiscal Year | 2025 | 2025 |
Efficiency & Valuation Duel: The Vital Signs
Financial ratios act as a company’s DNA, exposing hidden risks and operational strengths crucial for investment decisions.
Shopify Inc.
Shopify posts a solid 10.65% net margin but a modest 9.14% ROE, signaling profitability challenges at scale. Its P/E of 169.86 and P/B of 15.52 mark the stock as expensive and stretched. Shopify returns no dividends, instead fueling growth through significant R&D investment.
Strategy Inc
Strategy Inc suffers a severe net margin loss of -886%, with a negative ROE of -8.29%, reflecting operational distress. Its negative P/E of -9.98 and low P/B of 0.83 suggest undervaluation amid risk. The company pays no dividend, focusing on restructuring rather than shareholder returns.
Premium Valuation vs. Operational Risk
Shopify balances high valuation with operational efficiency and growth reinvestment, while Strategy Inc faces heavy losses despite cheap multiples. Shopify suits investors seeking growth with some risk tolerance. Strategy appeals more to contrarians targeting deep value amid uncertainty.
Which one offers the Superior Shareholder Reward?
Shopify Inc. (SHOP) and Strategy Inc. (MSTR) both do not pay dividends, focusing on reinvestment and buybacks to reward shareholders. Shopify’s free cash flow per share of $1.55 in 2025 supports moderate buyback potential with zero payout ratio, reflecting a reinvestment-driven growth strategy. Strategy Inc. shows negative profit margins and erratic cash flow, with no free cash flow or dividend payments, relying heavily on debt and struggling to generate operating cash. Shopify’s robust current ratio (12.9) and net margin (10.7%) contrast with Strategy’s negative margins and weak operating metrics. I find Shopify’s sustainable capital allocation and healthier cash flow profile offer a far superior total return potential in 2026.
Comparative Score Analysis: The Strategic Profile
The radar chart reveals the fundamental DNA and trade-offs of Shopify Inc. and Strategy Inc., highlighting their core financial strengths and vulnerabilities:
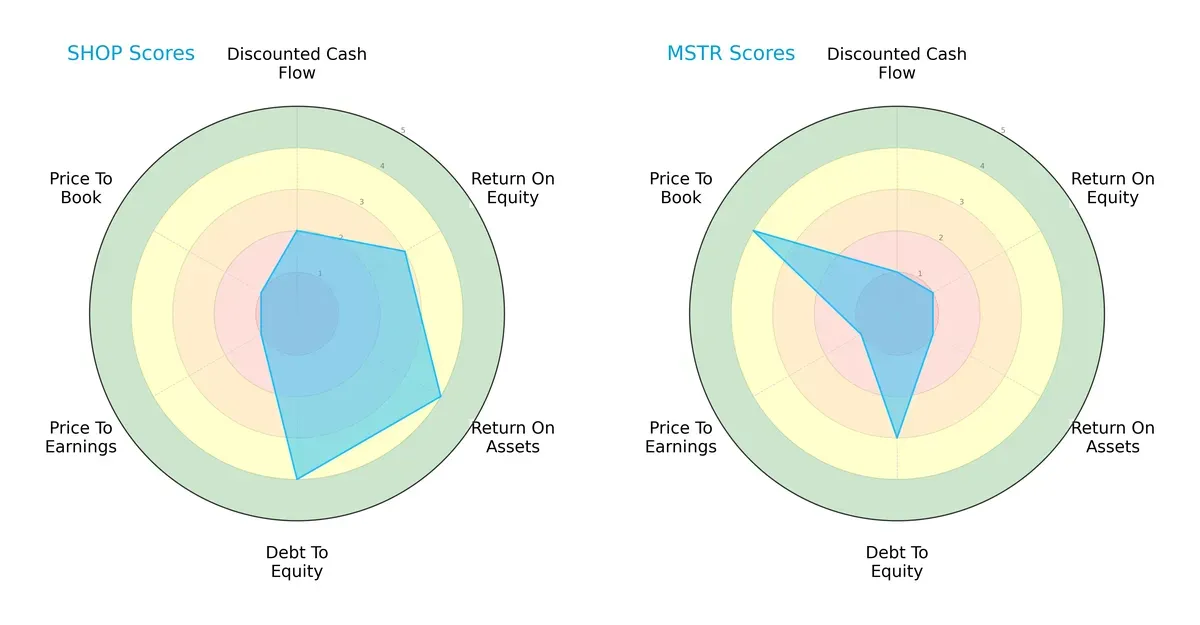
Shopify exhibits a balanced profile with favorable ROA (4) and debt-to-equity (4) scores, signaling strong asset efficiency and prudent leverage management. Strategy Inc. lags with very unfavorable DCF, ROE, and ROA scores (all 1), indicating weaker profitability and cash flow generation. However, Strategy Inc. scores well on price-to-book (4), suggesting potential undervaluation. Shopify relies on operational efficiency, while Strategy Inc. depends largely on valuation metrics, reflecting distinct investment narratives.
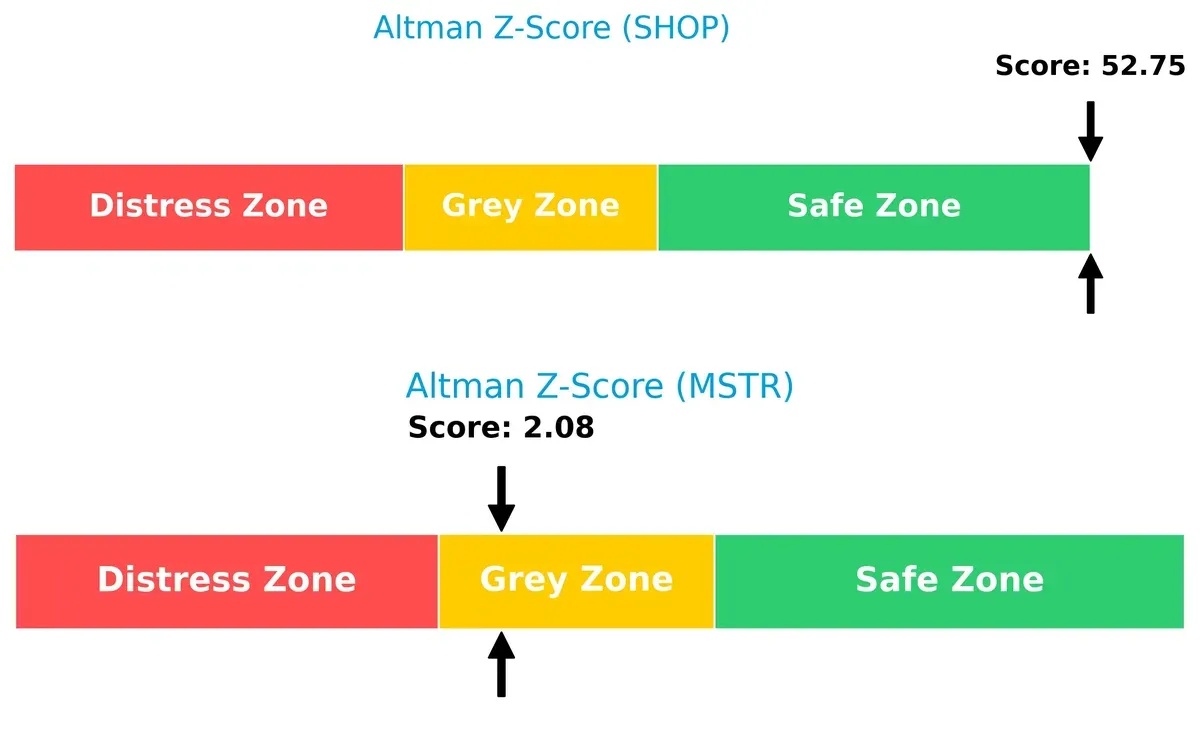
Bankruptcy Risk: Solvency Showdown
Shopify’s Altman Z-Score of 52.75 places it securely in the safe zone, while Strategy Inc.’s 2.08 situates it in the grey zone, signaling moderate bankruptcy risk in this cycle:
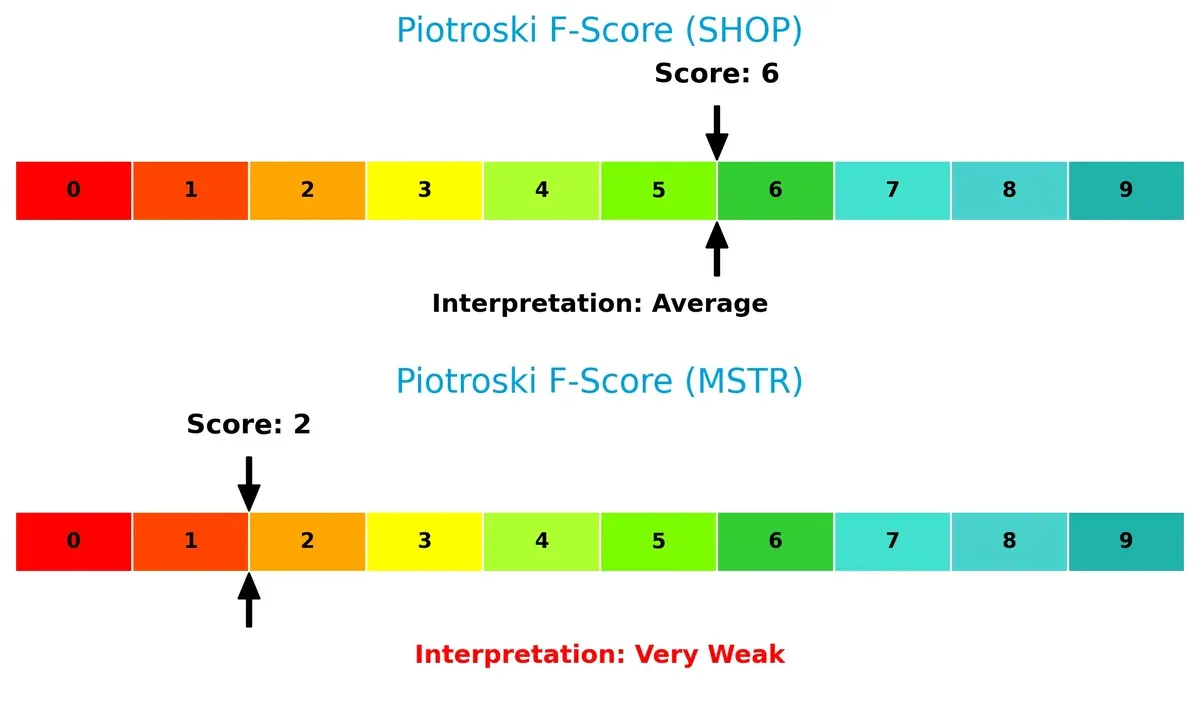
Financial Health: Quality of Operations
Shopify’s Piotroski F-Score of 6 indicates solid financial health, whereas Strategy Inc.’s score of 2 flags red alerts in operational and profitability metrics:
How are the two companies positioned?
This section dissects the operational DNA of Shopify and Strategy by comparing their revenue distribution and internal strengths and weaknesses. The goal is to confront their economic moats to identify which model offers the most resilient, sustainable advantage in today’s market.
Revenue Segmentation: The Strategic Mix
This visual comparison dissects how Shopify Inc. and Strategy Inc. diversify their income streams and where their primary sector bets lie:
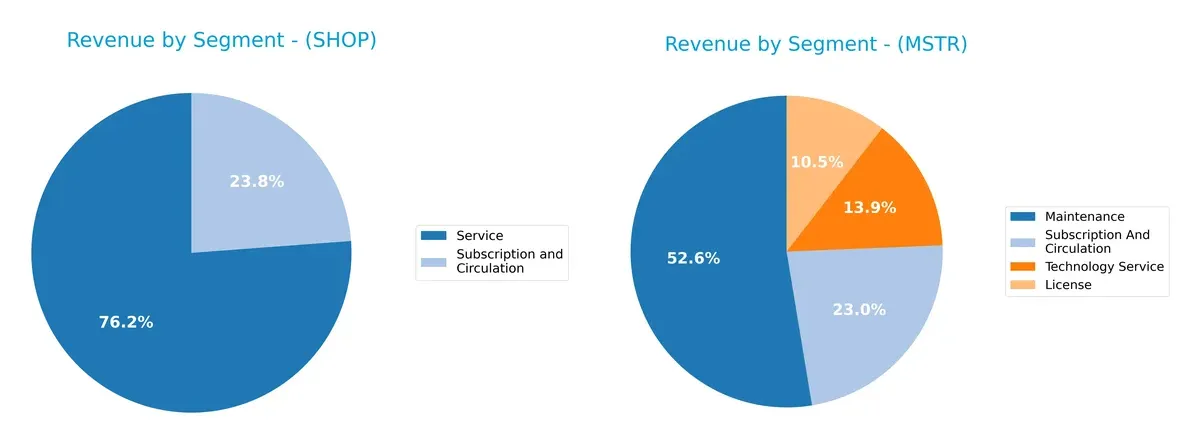
Shopify Inc. heavily leans on its Service segment with $8.8B in 2025, dwarfing Subscription and Circulation at $2.75B. Strategy Inc. shows a more balanced mix: Maintenance leads at $244M, followed by License ($49M), Technology Service ($64M), and Subscription ($107M). Shopify’s concentration in services signals robust ecosystem lock-in but raises concentration risk. Strategy’s diversified streams suggest resilience amid market shifts.
Strengths and Weaknesses Comparison
This table compares the Strengths and Weaknesses of Shopify Inc. and Strategy Inc.:
Shopify Inc. Strengths
- High net margin at 10.65%
- Very low debt-to-assets at 1.24%
- Strong fixed asset turnover at 81.96
- Diverse revenue from Services and Subscriptions
- Large global presence with significant US and EMEA sales
Strategy Inc Strengths
- Favorable P/E and P/B ratios indicating undervaluation
- Moderate debt levels with 16% debt-to-equity
- Solid fixed asset turnover at 6.29
- Revenue diversification across License, Maintenance, and Subscription
- Global presence anchored in North America and EMEA
Shopify Inc. Weaknesses
- ROIC below WACC at 15.66% vs. 16.91% indicating weak capital efficiency
- Very high P/E and P/B ratios imply overvaluation risk
- Extremely high current and quick ratios suggest inefficient asset use
- ROE under 10% signals modest shareholder returns
- No dividend yield
Strategy Inc Weaknesses
- Negative net margin at -886%
- Negative ROE and ROIC indicate poor profitability
- Interest coverage near zero signals risk in debt servicing
- Very low asset turnover at 0.01
- No dividend yield
Shopify shows strengths in profitability, asset efficiency, and global diversification but faces high valuation and capital efficiency concerns. Strategy struggles with profitability and operational efficiency despite its favorable valuation and balanced revenue streams. Both companies exhibit risks that will influence future strategic decisions.
The Moat Duel: Analyzing Competitive Defensibility
A structural moat is the only true shield protecting long-term profits from relentless competition erosion:
Shopify Inc.: Network Effects and Platform Integration
Shopify’s moat centers on network effects, linking merchants and buyers in a seamless ecosystem. This drives high ROIC and margin stability. Expansion into new markets and merchant solutions in 2026 could deepen this advantage.
Strategy Inc: Intangible Assets and AI-Driven Insights
Unlike Shopify’s broad platform, Strategy’s moat relies on proprietary AI analytics and bitcoin treasury positioning. Despite value destruction, its growing ROIC trend signals improving operational leverage and potential for market disruption in enterprise analytics.
Ecosystem Network vs. AI-Driven Intangibles: The Moat Face-Off
Shopify’s wider moat stems from entrenched network effects and diversified revenue streams. Strategy shows promise through innovation but suffers from weaker capital efficiency. Shopify is better positioned to defend its market share over the coming years.
Which stock offers better returns?
Over the past year, Shopify Inc. surged 43.17%, showing a strong bullish trend with decelerating momentum. Strategy Inc declined 12.09%, reflecting a bearish trend with deceleration.
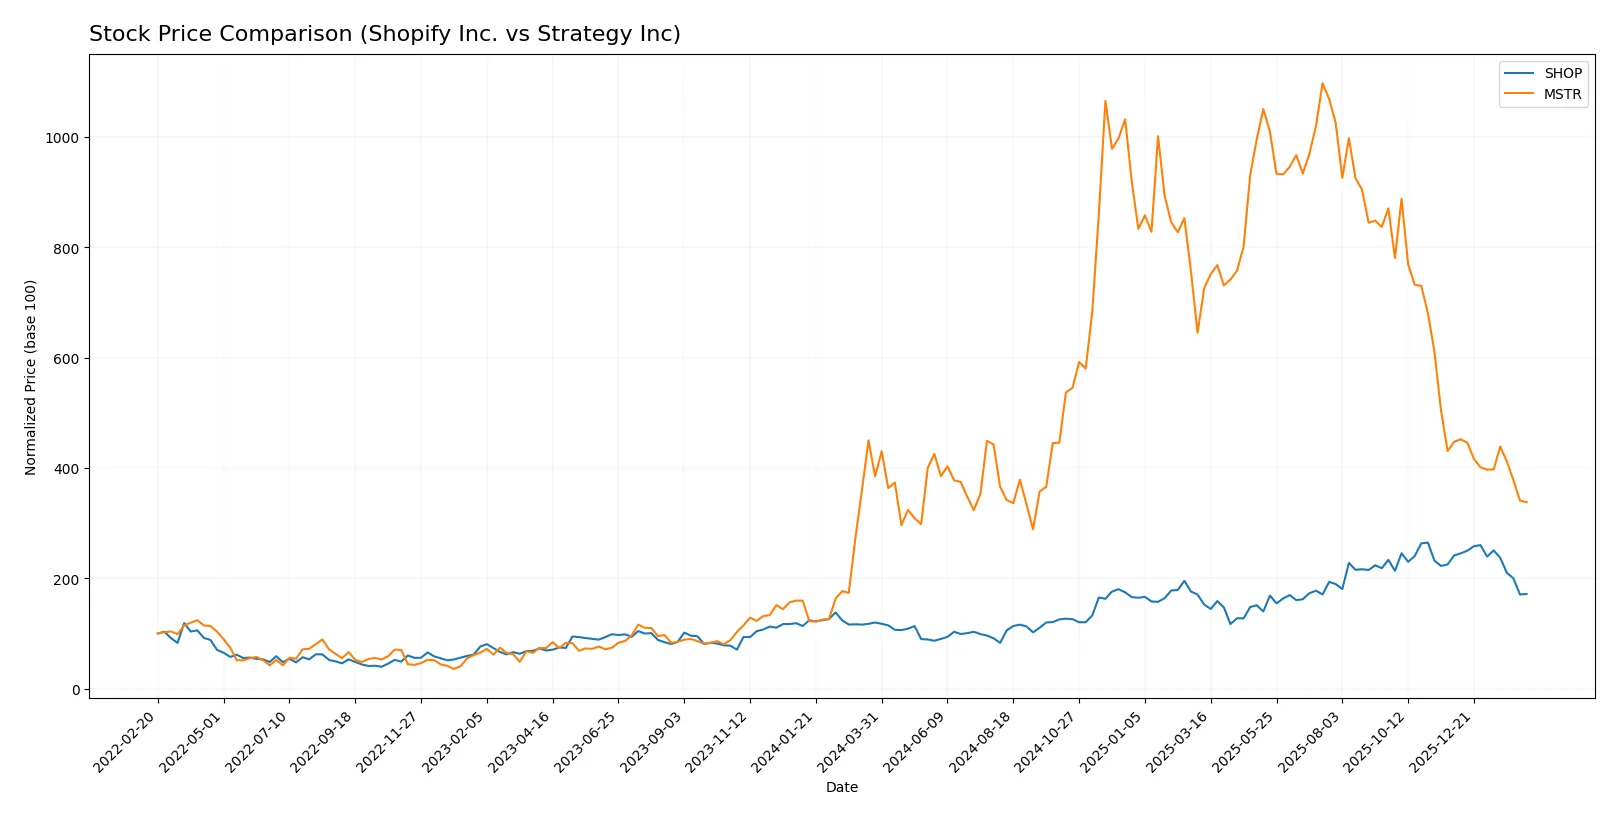
Trend Comparison
Shopify Inc. recorded a 43.17% price increase over the past 12 months, indicating a bullish trend with decelerating gains and a high of 173.86. Volatility measured by standard deviation was 33.42.
Strategy Inc’s stock fell 12.09% over the same period, confirming a bearish trend with deceleration. Its price ranged from 114.3 to 434.58, and volatility was very elevated at 101.79.
Shopify’s strong price appreciation outperformed Strategy Inc’s decline, delivering the highest market performance over the past year.
Target Prices
Analysts present a broad target price range reflecting optimism for both Shopify Inc. and Strategy Inc.
| Company | Target Low | Target High | Consensus |
|---|---|---|---|
| Shopify Inc. | 115 | 200 | 167.04 |
| Strategy Inc | 175 | 705 | 374.5 |
The consensus target prices for Shopify and Strategy exceed their current prices by 48% and 180%, respectively, indicating strong analyst expectations for growth.

Don’t Let Luck Decide Your Entry Point
Optimize your entry points with our advanced ProRealTime indicators. You’ll get efficient buy signals with precise price targets for maximum performance. Start outperforming now!
How do institutions grade them?
Shopify Inc. Grades
This table summarizes recent grades assigned to Shopify Inc. by major institutions.
| Grading Company | Action | New Grade | Date |
|---|---|---|---|
| Citigroup | Maintain | Buy | 2026-02-13 |
| Wells Fargo | Maintain | Overweight | 2026-02-12 |
| Truist Securities | Maintain | Hold | 2026-02-12 |
| UBS | Maintain | Neutral | 2026-02-12 |
| Mizuho | Upgrade | Outperform | 2026-02-12 |
| Citizens | Maintain | Market Outperform | 2026-02-12 |
| RBC Capital | Maintain | Outperform | 2026-02-12 |
| BMO Capital | Maintain | Outperform | 2026-02-12 |
| Cantor Fitzgerald | Maintain | Neutral | 2026-02-12 |
| Barclays | Maintain | Equal Weight | 2026-02-12 |
Strategy Inc Grades
This table summarizes recent grades assigned to Strategy Inc by major institutions.
| Grading Company | Action | New Grade | Date |
|---|---|---|---|
| Cantor Fitzgerald | Maintain | Overweight | 2026-02-09 |
| BTIG | Maintain | Buy | 2026-02-06 |
| Canaccord Genuity | Maintain | Buy | 2026-02-04 |
| Mizuho | Maintain | Outperform | 2026-01-16 |
| TD Cowen | Maintain | Buy | 2026-01-15 |
| Citigroup | Maintain | Buy | 2025-12-22 |
| Bernstein | Maintain | Outperform | 2025-12-08 |
| Monness, Crespi, Hardt | Upgrade | Neutral | 2025-11-10 |
| Canaccord Genuity | Maintain | Buy | 2025-11-03 |
| HC Wainwright & Co. | Maintain | Buy | 2025-11-03 |
Which company has the best grades?
Strategy Inc consistently earns strong buy and outperform ratings, reflecting higher institutional confidence. Shopify Inc shows more mixed grades, including hold and neutral. Investors might view Strategy’s grades as a sign of stronger market endorsement.
Risks specific to each company
The following categories identify the critical pressure points and systemic threats facing both firms in the 2026 market environment:
1. Market & Competition
Shopify Inc.
- Operates in a highly competitive global e-commerce platform market with constant innovation pressure.
Strategy Inc
- Faces volatility from Bitcoin exposure and competition in enterprise analytics and crypto sectors.
2. Capital Structure & Debt
Shopify Inc.
- Minimal debt with strong interest coverage signals financial stability and conservative leverage.
Strategy Inc
- Moderate debt levels with weak interest coverage increase financial risk and refinancing concerns.
3. Stock Volatility
Shopify Inc.
- Beta of 2.82 indicates high sensitivity to market swings but less extreme than Strategy.
Strategy Inc
- Beta of 3.54 shows very high stock volatility, driven by crypto asset exposure.
4. Regulatory & Legal
Shopify Inc.
- Subject to data privacy and e-commerce regulations across multiple jurisdictions.
Strategy Inc
- Faces regulatory scrutiny due to Bitcoin holdings and evolving crypto compliance frameworks.
5. Supply Chain & Operations
Shopify Inc.
- E-commerce platform depends on reliable third-party logistics and payment processors.
Strategy Inc
- Operational risk concentrated in software delivery and crypto asset management infrastructure.
6. ESG & Climate Transition
Shopify Inc.
- Growing pressure to improve ESG metrics amid global sustainability trends in tech.
Strategy Inc
- ESG risks linked to Bitcoin’s energy consumption and corporate governance challenges.
7. Geopolitical Exposure
Shopify Inc.
- Operations span multiple continents, sensitive to trade policies and cross-border regulations.
Strategy Inc
- Exposure to US and international crypto jurisdictional risks, including sanctions and legal changes.
Which company shows a better risk-adjusted profile?
Shopify’s primary risk rests in fierce market competition and innovation demands, while Strategy’s biggest risk is its precarious financial health tied to Bitcoin volatility. Shopify’s robust balance sheet and safer Altman Z-Score place it ahead on risk-adjusted grounds. Strategy’s negative margins and weak Piotroski score highlight financial distress. The stark contrast in interest coverage and Altman Z-Score underscores Shopify’s relative resilience versus Strategy’s vulnerability.
Final Verdict: Which stock to choose?
Shopify Inc. wields unmatched efficiency as its superpower, demonstrated by strong cash flow generation and operational scalability. Its main point of vigilance lies in a valuation that appears stretched relative to fundamentals. This stock fits best within aggressive growth portfolios willing to endure volatility for potential market leadership gains.
Strategy Inc’s strategic moat centers on its niche technology offerings with recurring revenue streams, providing a degree of safety absent in Shopify’s rapid expansion profile. While it faces challenges in profitability and asset utilization, it could appeal to investors seeking a GARP (Growth at a Reasonable Price) approach with some margin of capital preservation.
If you prioritize high-growth potential and market dominance, Shopify outshines due to its accelerating profitability trends despite a lofty valuation. However, if you seek stability with a focus on recurring revenue and lower valuation risk, Strategy Inc offers better stability but requires acceptance of ongoing profitability headwinds. Both present distinct analytical scenarios depending on your risk tolerance and growth objectives.
Disclaimer: Investment carries a risk of loss of initial capital. The past performance is not a reliable indicator of future results. Be sure to understand risks before making an investment decision.
Go Further
I encourage you to read the complete analyses of Shopify Inc. and Strategy Inc to enhance your investment decisions: