In the fast-evolving software application industry, Shopify Inc. and monday.com Ltd. stand out with distinct yet overlapping market approaches. Shopify excels in comprehensive e-commerce solutions, while monday.com leads with innovative cloud-based work management platforms. Both companies emphasize scalable innovation to capture global demand. This article will analyze their strengths and risks to help you decide which company deserves a place in your investment portfolio.

Table of contents
Companies Overview
I will begin the comparison between Shopify Inc. and monday.com Ltd. by providing an overview of these two companies and their main differences.
Shopify Inc. Overview
Shopify Inc. is a commerce company headquartered in Ottawa, Canada, offering a comprehensive commerce platform and services worldwide. Its platform enables merchants to manage, market, and sell products via multiple sales channels, including online storefronts, physical stores, and social media. Shopify also provides merchant solutions such as payment processing, shipping, and financing, positioning itself as a leader in the e-commerce software application industry.
monday.com Ltd. Overview
monday.com Ltd., based in Tel Aviv, Israel, develops cloud-based software applications focused on work management through its Work OS platform. The platform enables users to build customized applications for marketing, CRM, project management, and software development. Serving a variety of organizations including educational and government institutions, monday.com operates internationally within the software application sector, emphasizing modular and visual work solutions.
Key similarities and differences
Both Shopify and monday.com operate in the software application industry with a global footprint, offering cloud-based solutions to enhance business operations. Shopify targets e-commerce merchants with a broad commerce platform, while monday.com focuses on work management and customizable application building. Shopify’s market cap is substantially larger at approximately 205B USD compared to monday.com’s 6.6B USD, reflecting differences in scale and market focus.
Income Statement Comparison
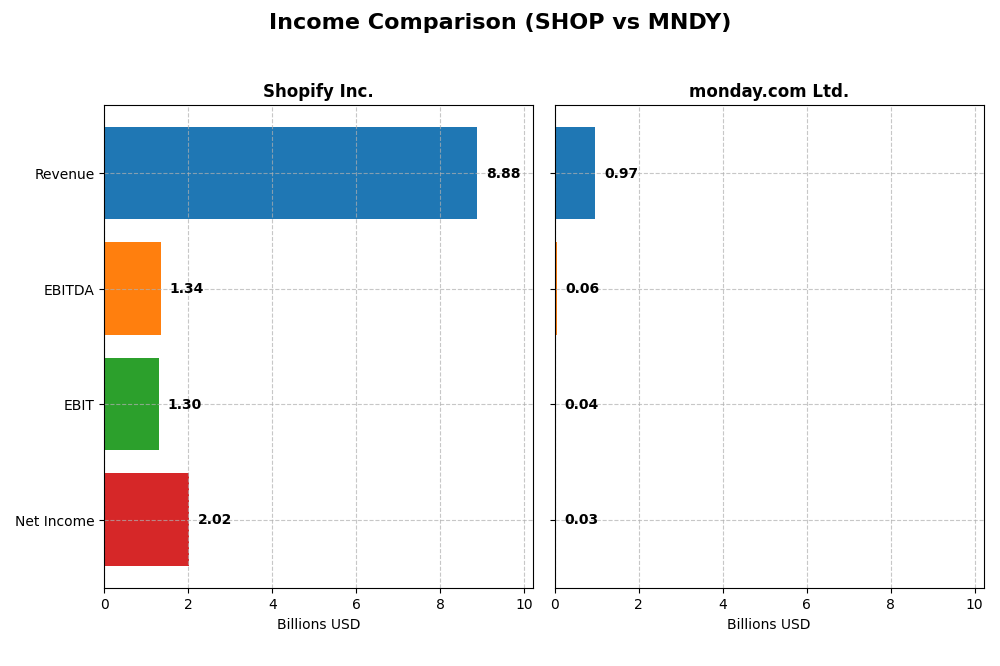
Below is a side-by-side income statement comparison for Shopify Inc. and monday.com Ltd. based on their most recent fiscal year 2024 data.
| Metric | Shopify Inc. (SHOP) | monday.com Ltd. (MNDY) |
|---|---|---|
| Market Cap | 205B | 6.56B |
| Revenue | 8.88B | 972M |
| EBITDA | 1.34B | 58M |
| EBIT | 1.30B | 40M |
| Net Income | 2.02B | 32M |
| EPS | 1.56 | 0.65 |
| Fiscal Year | 2024 | 2024 |
Income Statement Interpretations
Shopify Inc.
Shopify displayed strong revenue growth from 2020 to 2024, with a 203% increase, accompanied by a significant net income rise of 532%. Its gross margin remained favorable at 50.36%, and net margin improved to 22.74%. In 2024, revenue surged by 26%, with net income and EPS growth exceeding 1100%, indicating a robust recovery and margin expansion.
monday.com Ltd.
monday.com experienced rapid revenue growth of 503% over the period, with net income increasing by 121%. The company’s gross margin stands out at 89.33%, though its EBIT margin and net margin remain moderate at 4.09% and 3.33%, respectively. In 2024, revenue grew 33%, with substantial improvements in net margin and EPS, despite relatively modest profitability.
Which one has the stronger fundamentals?
Shopify exhibits stronger fundamentals with higher and more stable margins, especially net and EBIT margins, alongside robust profitability growth. monday.com shows impressive top-line growth and very high gross margins but lower operating and net margins. Both have favorable income trends, yet Shopify’s superior margin profile and net income growth suggest a stronger earnings foundation.
Financial Ratios Comparison
The table below presents a side-by-side comparison of key financial ratios for Shopify Inc. (SHOP) and monday.com Ltd. (MNDY) based on their most recent fiscal year data for 2024.
| Ratios | Shopify Inc. (SHOP) | monday.com Ltd. (MNDY) |
|---|---|---|
| ROE | 17.5% | 3.1% |
| ROIC | 7.5% | -1.7% |
| P/E | 68.2 | 363.0 |
| P/B | 11.9 | 11.4 |
| Current Ratio | 3.71 | 2.66 |
| Quick Ratio | 3.70 | 2.66 |
| D/E | 0.097 | 0.103 |
| Debt-to-Assets | 8.1% | 6.3% |
| Interest Coverage | 0 | 0 |
| Asset Turnover | 0.64 | 0.58 |
| Fixed Asset Turnover | 63.4 | 7.13 |
| Payout ratio | 0 | 0 |
| Dividend yield | 0 | 0 |
Interpretation of the Ratios
Shopify Inc.
Shopify displays a mixed ratio profile with strong net margin (22.74%) and ROE (17.47%) but unfavorable valuations including a high P/E of 68.18 and a P/B of 11.91. The company maintains a low debt level and excellent interest coverage, yet its current ratio is considered unfavorable. Shopify does not pay dividends, reflecting a growth-focused reinvestment strategy.
monday.com Ltd.
monday.com shows weaker profitability ratios such as net margin (3.33%) and ROE (3.14%), both unfavorable, with a very high P/E of 362.98. The company maintains favorable liquidity and low debt levels, supporting financial stability despite low returns. monday.com also does not pay dividends, likely due to reinvestment and expansion priorities common in its growth phase.
Which one has the best ratios?
Shopify’s ratios are slightly more favorable overall, benefiting from stronger profitability and robust capital structure despite valuation concerns and liquidity issues. monday.com’s ratios reflect more pronounced profitability challenges and higher valuation multiples, resulting in a neutral overall assessment. Both companies avoid dividend payouts, focusing on reinvestment.
Strategic Positioning
This section compares the strategic positioning of Shopify Inc. and monday.com Ltd. in terms of market position, key segments, and exposure to technological disruption:
Shopify Inc.
- Leading commerce platform with high market cap and strong global presence; faces competitive pressure in software applications.
- Focuses on commerce platform services including merchant solutions and subscriptions driving revenue growth.
- Faces technological disruption risks typical for cloud-based commerce and software platforms.
monday.com Ltd.
- Smaller market cap, operates in software applications with moderate competitive pressure.
- Develops Work OS with modular work management tools for diverse business needs.
- Exposed to disruption in cloud-based work operating systems and modular software tools.
Shopify Inc. vs monday.com Ltd. Positioning
Shopify has a diversified commerce platform addressing multiple merchant needs globally, while monday.com concentrates on modular work OS solutions for various industries. Shopify’s scale offers broad market reach; monday.com focuses on specialized software applications, reflecting different business drivers and segment focus.
Which has the best competitive advantage?
Both companies are currently shedding value with slightly unfavorable moats, despite growing ROIC trends. Shopify’s larger scale contrasts with monday.com’s focused product, but neither shows a strong sustainable competitive advantage based on the MOAT evaluation.
Stock Comparison
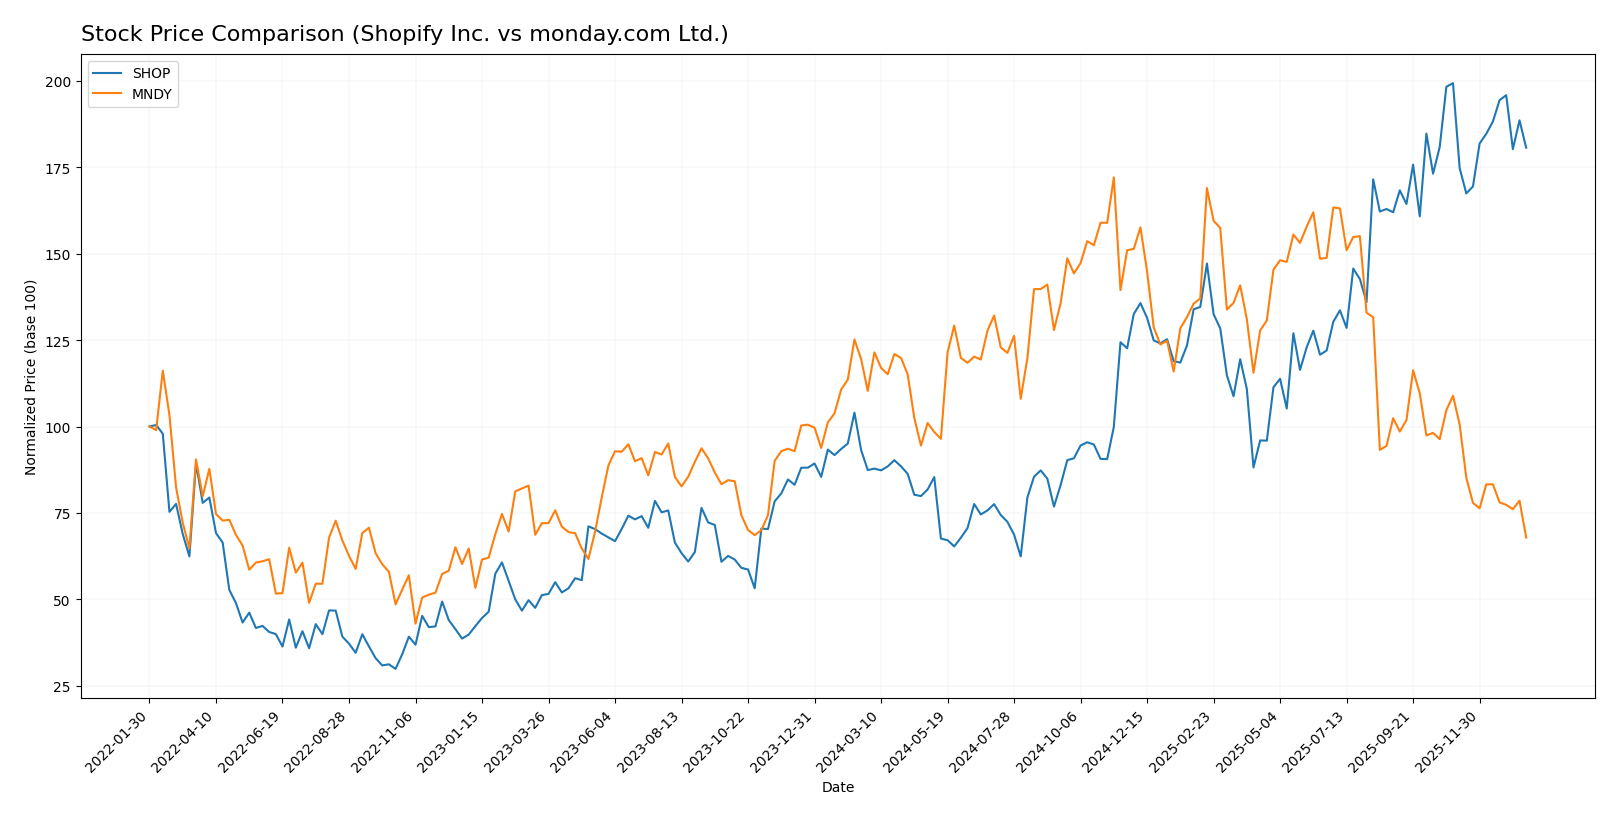
The past year reveals contrasting stock price movements: Shopify Inc. (SHOP) exhibits a strong 106.69% bullish trend with decelerating momentum, while monday.com Ltd. (MNDY) shows a -38.47% bearish trend also with deceleration.
Trend Analysis
Shopify Inc. (SHOP) experienced a bullish trend over the past 12 months, with a 106.69% price increase and decelerating acceleration; its price ranged between 54.43 and 173.86, showing moderate volatility (std dev 33.71).
monday.com Ltd. (MNDY) recorded a bearish trend with a -38.47% decline over the same period, also decelerating; its price fluctuated from 127.92 to 324.31 with higher volatility (std dev 47.29).
Comparing both, Shopify delivered the highest market performance with a strong upward trend, while monday.com faced significant declines and weaker buyer dominance.
Target Prices
The latest analyst consensus indicates a positive outlook for both Shopify Inc. and monday.com Ltd.
| Company | Target High | Target Low | Consensus |
|---|---|---|---|
| Shopify Inc. | 200 | 140 | 186.24 |
| monday.com Ltd. | 330 | 194 | 264.42 |
Analysts expect Shopify’s stock to rise above its current price of $157.38, while monday.com’s consensus target is significantly higher than its present price of $128.14, suggesting potential upside for both stocks.
Analyst Opinions Comparison
This section compares analysts’ ratings and grades for Shopify Inc. and monday.com Ltd.:
Rating Comparison
SHOP Rating
- Rating: B, considered very favorable overall by analysts.
- Discounted Cash Flow Score: Moderate at 3, indicating balanced valuation.
- ROE Score: Favorable at 4, showing efficient profit generation from equity.
- ROA Score: Very favorable at 5, strong asset utilization.
- Debt To Equity Score: Moderate at 3, reflecting balanced financial risk.
- Overall Score: Moderate at 3, indicating average overall financial strength.
MNDY Rating
- Rating: B-, also very favorable but slightly lower than SHOP’s rating.
- Discounted Cash Flow Score: Favorable at 4, suggesting better valuation outlook.
- ROE Score: Moderate at 3, indicating average efficiency in equity returns.
- ROA Score: Moderate at 3, moderate effectiveness in using assets.
- Debt To Equity Score: Moderate at 3, similar financial risk profile.
- Overall Score: Moderate at 3, same overall financial strength as SHOP.
Which one is the best rated?
Based on the data, Shopify holds a higher rating of B compared to monday.com’s B-. Shopify also scores better on ROE and ROA, while monday.com has a slightly better discounted cash flow score. Overall, Shopify is better rated due to stronger profitability and asset use scores.
Scores Comparison
Here is a comparison of the Altman Z-Score and Piotroski Score for Shopify Inc. and monday.com Ltd.:
SHOP Scores
- Altman Z-Score: 50.42, indicating a strong safe zone
- Piotroski Score: 6, reflecting average financial health
MNDY Scores
- Altman Z-Score: 6.33, also in the safe zone
- Piotroski Score: 5, indicating average financial health
Which company has the best scores?
Shopify exhibits a notably higher Altman Z-Score, suggesting stronger financial stability compared to monday.com. Both companies have similar average Piotroski Scores, indicating comparable financial strength on that metric.
Grades Comparison
Here is the grades comparison for Shopify Inc. and monday.com Ltd.:
Shopify Inc. Grades
This table summarizes recent grades and rating actions from reputable grading companies for Shopify Inc.
| Grading Company | Action | New Grade | Date |
|---|---|---|---|
| Scotiabank | Upgrade | Sector Outperform | 2026-01-08 |
| Wolfe Research | Downgrade | Peer Perform | 2026-01-06 |
| Wells Fargo | Maintain | Overweight | 2025-12-17 |
| Truist Securities | Maintain | Hold | 2025-11-05 |
| CIBC | Maintain | Outperform | 2025-11-05 |
| Cantor Fitzgerald | Maintain | Neutral | 2025-11-05 |
| DA Davidson | Maintain | Buy | 2025-11-05 |
| Scotiabank | Maintain | Sector Perform | 2025-11-05 |
| Needham | Maintain | Buy | 2025-11-05 |
| JP Morgan | Maintain | Overweight | 2025-11-05 |
Shopify’s grades show a mix of positive and neutral stances, with recent upgrades balanced by some downgrades, indicating varied analyst sentiment.
monday.com Ltd. Grades
The following table details monday.com Ltd.’s recent grading actions by recognized grading companies.
| Grading Company | Action | New Grade | Date |
|---|---|---|---|
| Barclays | Maintain | Overweight | 2026-01-12 |
| Jefferies | Maintain | Buy | 2026-01-05 |
| Citigroup | Maintain | Buy | 2025-12-23 |
| Tigress Financial | Maintain | Buy | 2025-12-11 |
| JP Morgan | Maintain | Overweight | 2025-11-11 |
| Morgan Stanley | Maintain | Overweight | 2025-11-11 |
| Piper Sandler | Maintain | Overweight | 2025-11-11 |
| Canaccord Genuity | Maintain | Buy | 2025-11-11 |
| Baird | Maintain | Outperform | 2025-11-11 |
| Citigroup | Maintain | Buy | 2025-11-11 |
monday.com’s grades consistently reflect a positive outlook with no recent downgrades, implying steady analyst confidence.
Which company has the best grades?
Both Shopify and monday.com have a consensus “Buy” rating, but monday.com’s grades are more uniformly positive and stable, while Shopify shows some mixed signals. This suggests monday.com currently enjoys stronger analyst conviction, which may influence investor confidence and portfolio risk assessment.
Strengths and Weaknesses
Below is a comparison of key strengths and weaknesses for Shopify Inc. (SHOP) and monday.com Ltd. (MNDY) based on the latest financial and strategic data.
| Criterion | Shopify Inc. (SHOP) | monday.com Ltd. (MNDY) |
|---|---|---|
| Diversification | Strong revenue diversification: Merchant Solutions and Subscription Services growing steadily, reaching $6.53B and $2.35B respectively in 2024 | Limited diversification; primarily focused on project management software |
| Profitability | Favorable net margin of 22.74%, ROE 17.47%, but ROIC below WACC indicating value destruction despite improving profitability | Low profitability with net margin at 3.33%, ROE 3.14%, and negative ROIC, signaling ongoing value erosion |
| Innovation | High fixed asset turnover (63.43) and strong asset utilization suggest efficient innovation deployment | Moderate fixed asset turnover (7.13), indicating some operational efficiency but less than Shopify |
| Global presence | Extensive global operations supported by strong subscription and merchant services | Growing global presence but smaller scale compared to Shopify |
| Market Share | Leading e-commerce platform with expanding market share in merchant solutions | Niche market player in work operating systems, smaller market share |
Key takeaways: Shopify shows strong diversification and profitability metrics with improving returns, though it currently destroys value relative to capital costs. monday.com faces challenges in profitability and value creation but maintains a solid operational base. Both companies present growth potential but require cautious evaluation of capital efficiency.
Risk Analysis
Below is a comparative risk analysis table for Shopify Inc. (SHOP) and monday.com Ltd. (MNDY) based on the most recent 2024 data and 2026 market context.
| Metric | Shopify Inc. (SHOP) | monday.com Ltd. (MNDY) |
|---|---|---|
| Market Risk | High beta (2.84) indicates high volatility; PE of 68.18 suggests overvaluation risk. | Moderate beta (1.255) with very high PE (362.98) implies valuation risk and sensitivity to market swings. |
| Debt level | Low debt-to-equity (0.1) and debt-to-assets (8.09%) indicate strong balance sheet. | Similarly low debt-to-equity (0.1) and debt-to-assets (6.29%), financially stable. |
| Regulatory Risk | Moderate, operating globally with varied compliance requirements, including data privacy. | Moderate, with exposure to international regulations including EU and Middle East jurisdictions. |
| Operational Risk | Larger scale with 8,100 employees; complexity in global e-commerce operations. | Smaller scale (2,508 employees), but dependence on cloud infrastructure poses some operational concentration risk. |
| Environmental Risk | Moderate, as software provider with limited direct environmental impact but growing ESG expectations. | Similar moderate risk, with focus on cloud services and energy consumption in data centers. |
| Geopolitical Risk | Exposure to US, Canada, Europe, Asia pacific with potential trade tensions and supply chain disruptions. | Headquartered in Israel, with moderate geopolitical sensitivity; global client base adds diversification risk. |
In summary, the most impactful risks for Shopify include high market volatility and valuation, alongside geopolitical exposure due to its global footprint. monday.com faces significant valuation risk with an exceptionally high PE ratio and moderate geopolitical risks tied to its location. Both companies maintain low debt levels, reducing financial distress risk. Investors should monitor market conditions and geopolitical developments closely, as these factors are the most likely to affect stock performance in 2026.
Which Stock to Choose?
Shopify Inc. (SHOP) shows a strong income evolution with favorable growth in revenue and net margin. Its financial ratios are slightly favorable, highlighting solid profitability and low debt levels. The company holds a very favorable B rating, though with some valuation concerns.
monday.com Ltd. (MNDY) displays favorable revenue growth and a high gross margin but neutral overall income statement evaluation. Financial ratios are neutral, with moderate profitability and low debt. The B- rating is very favorable, yet valuation metrics remain high and less attractive.
For investors, Shopify’s slightly favorable financial ratios and very favorable rating might appeal to those seeking growth with improving profitability despite some valuation risks. monday.com’s neutral financial stance and favorable rating could suit investors with a preference for moderate stability and steady revenue growth.
Disclaimer: Investment carries a risk of loss of initial capital. The past performance is not a reliable indicator of future results. Be sure to understand risks before making an investment decision.
Go Further
I encourage you to read the complete analyses of Shopify Inc. and monday.com Ltd. to enhance your investment decisions: