In the dynamic utilities sector, Sempra and The AES Corporation stand out as influential players driving energy innovation and infrastructure. Both companies operate diversified utilities with significant market overlap in electricity and natural gas services, yet they differ in geographic reach and technological focus. This comparison aims to help you, the investor, identify which company offers the most compelling opportunity for your portfolio in 2026.
Table of contents
Companies Overview
I will begin the comparison between Sempra and The AES Corporation by providing an overview of these two companies and their main differences.
Sempra Overview
Sempra is an energy-services holding company operating primarily in the United States. It provides electric and natural gas services to millions of customers across Southern California, Texas, and other regions. Its business includes regulated transmission and distribution operations, with a vast network of transmission lines and substations. Founded in 1998 and headquartered in San Diego, Sempra focuses on diversified utilities with an emphasis on reliable energy delivery.
The AES Corporation Overview
The AES Corporation is a diversified power generation and utility company with a global footprint including the Americas, Europe, and Asia. It owns and operates power plants using various fuels such as coal, gas, hydro, wind, solar, and biomass, serving both wholesale and end-user customers. Founded in 1981 and based in Arlington, Virginia, AES emphasizes a broad generation portfolio alongside utility operations, integrating renewables and energy storage technologies.
Key similarities and differences
Both Sempra and AES operate in the diversified utilities sector, focusing on electricity and energy services. Sempra’s operations are more concentrated in regulated transmission and distribution within the US, while AES has a more international presence with a varied generation portfolio incorporating multiple fuel sources and renewables. Sempra’s scale is larger by market capitalization and employee count, whereas AES emphasizes broader geographic diversification and generation technologies.
Income Statement Comparison
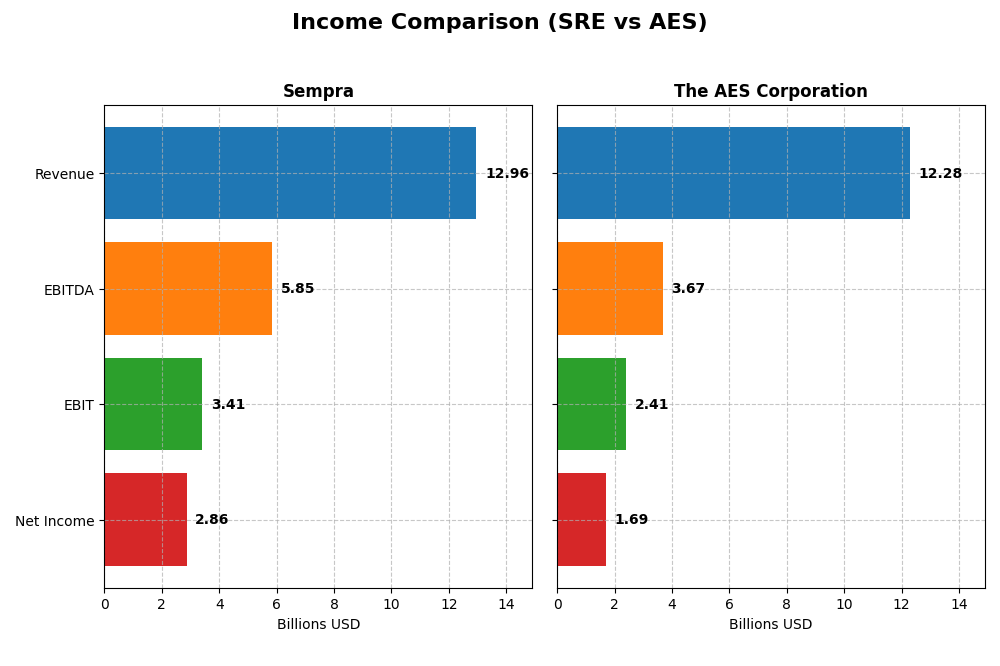
This table presents a side-by-side comparison of key income statement metrics for Sempra and The AES Corporation for their most recent fiscal year, 2024.
| Metric | Sempra | The AES Corporation |
|---|---|---|
| Market Cap | 58B | 10.2B |
| Revenue | 12.96B | 12.28B |
| EBITDA | 5.85B | 3.68B |
| EBIT | 3.41B | 2.41B |
| Net Income | 2.86B | 1.69B |
| EPS | 4.44 | 2.38 |
| Fiscal Year | 2024 | 2024 |
Income Statement Interpretations
Sempra
Sempra’s revenue showed overall growth of 14.13% from 2020 to 2024 but declined by 18% in the last year, with net income decreasing 27.23% over the period. Margins remain strong with a favorable gross margin of 27.2% and net margin of 22.09%, though interest expense at 10.06% is unfavorable. The 2024 year saw lower revenue and earnings but a 13.51% improvement in net margin.
The AES Corporation
AES experienced a 27.09% revenue growth over 2020-2024 and a remarkable 3820.93% net income increase. Gross margin is neutral at 18.86%, while EBIT and net margins are favorable at 19.64% and 13.73%, respectively. Despite a 3.14% revenue decline in 2024, AES posted strong EBIT growth of 71.48% and a net margin surge of 619.28%, reflecting improved operational efficiency.
Which one has the stronger fundamentals?
AES demonstrates stronger fundamentals with consistent favorable growth across net income, margins, and earnings per share over the period, alongside a significant rebound in 2024 performance. Conversely, Sempra, while maintaining higher absolute margins, faces revenue declines and unfavorable long-term net income trends, coupled with a relatively high interest expense burden.
Financial Ratios Comparison
The following table presents key financial ratios for Sempra and The AES Corporation based on their most recent fiscal year data as of 2024.
| Ratios | Sempra (SRE) | The AES Corporation (AES) |
|---|---|---|
| ROE | 9.16% | 46.27% |
| ROIC | 2.94% | 4.46% |
| P/E | 19.43 | 5.39 |
| P/B | 1.78 | 2.49 |
| Current Ratio | 0.55 | 0.80 |
| Quick Ratio | 0.49 | 0.73 |
| D/E (Debt-to-Equity) | 1.15 | 7.96 |
| Debt-to-Assets | 37.3% | 61.2% |
| Interest Coverage | 2.17 | 1.34 |
| Asset Turnover | 0.13 | 0.26 |
| Fixed Asset Turnover | 0.21 | 0.37 |
| Payout Ratio | 53.9% | 28.6% |
| Dividend Yield | 2.78% | 5.32% |
Interpretation of the Ratios
Sempra
Sempra shows a mixed ratio profile with a strong net margin of 22.09% and favorable dividend yield at 2.78%, but weak returns on equity (9.16%) and invested capital (2.94%). The company faces liquidity concerns with a low current ratio of 0.55 and high debt leverage (D/E 1.15). Dividend payouts appear sustainable given free cash flow coverage, yet capital efficiency is limited.
The AES Corporation
AES exhibits strong profitability with a high ROE of 46.27% and favorable net margin at 13.73%, but it struggles with high debt levels (D/E 7.96) and weak interest coverage (1.59), raising financial risk concerns. The dividend yield is moderate at 5.32% but rated neutral, suggesting cautious dividend sustainability. Liquidity ratios remain below 1, indicating potential short-term constraints.
Which one has the best ratios?
Sempra’s ratios show a slightly unfavorable global view, balancing strong profitability with liquidity and efficiency weaknesses. AES’s ratios are overall unfavorable, mainly due to excessive leverage and interest coverage issues, despite higher profitability metrics. Both companies face challenges, with Sempra showing marginally better risk management across its ratios.
Strategic Positioning
This section compares the strategic positioning of Sempra and AES, focusing on market position, key segments, and exposure to technological disruption:
Sempra
- Leading US diversified utilities company with large regulated electric and natural gas operations facing moderate competition.
- Key segments include regulated electricity and natural gas services primarily in California and Texas.
- Limited explicit exposure to technological disruption mentioned; operates traditional electric and gas transmission systems.
The AES Corporation
- Diversified power generation and utility company operating globally with exposure to various regional markets.
- Key segments cover energy infrastructure, renewables, utilities, and new energy technologies worldwide.
- Active in renewables and new energy technologies, indicating higher exposure to evolving energy innovations.
Sempra vs The AES Corporation Positioning
Sempra focuses on regulated utilities in specific US regions with stable business drivers, while AES pursues a more diversified global portfolio including renewables and emerging technologies. Sempra’s concentration offers regulatory stability; AES’s diversification exposes it to varied market risks and innovation opportunities.
Which has the best competitive advantage?
Based on MOAT evaluation, both companies are shedding value; however, AES shows improving profitability with a growing ROIC trend, whereas Sempra faces declining returns, indicating a comparatively stronger competitive position for AES.
Stock Comparison
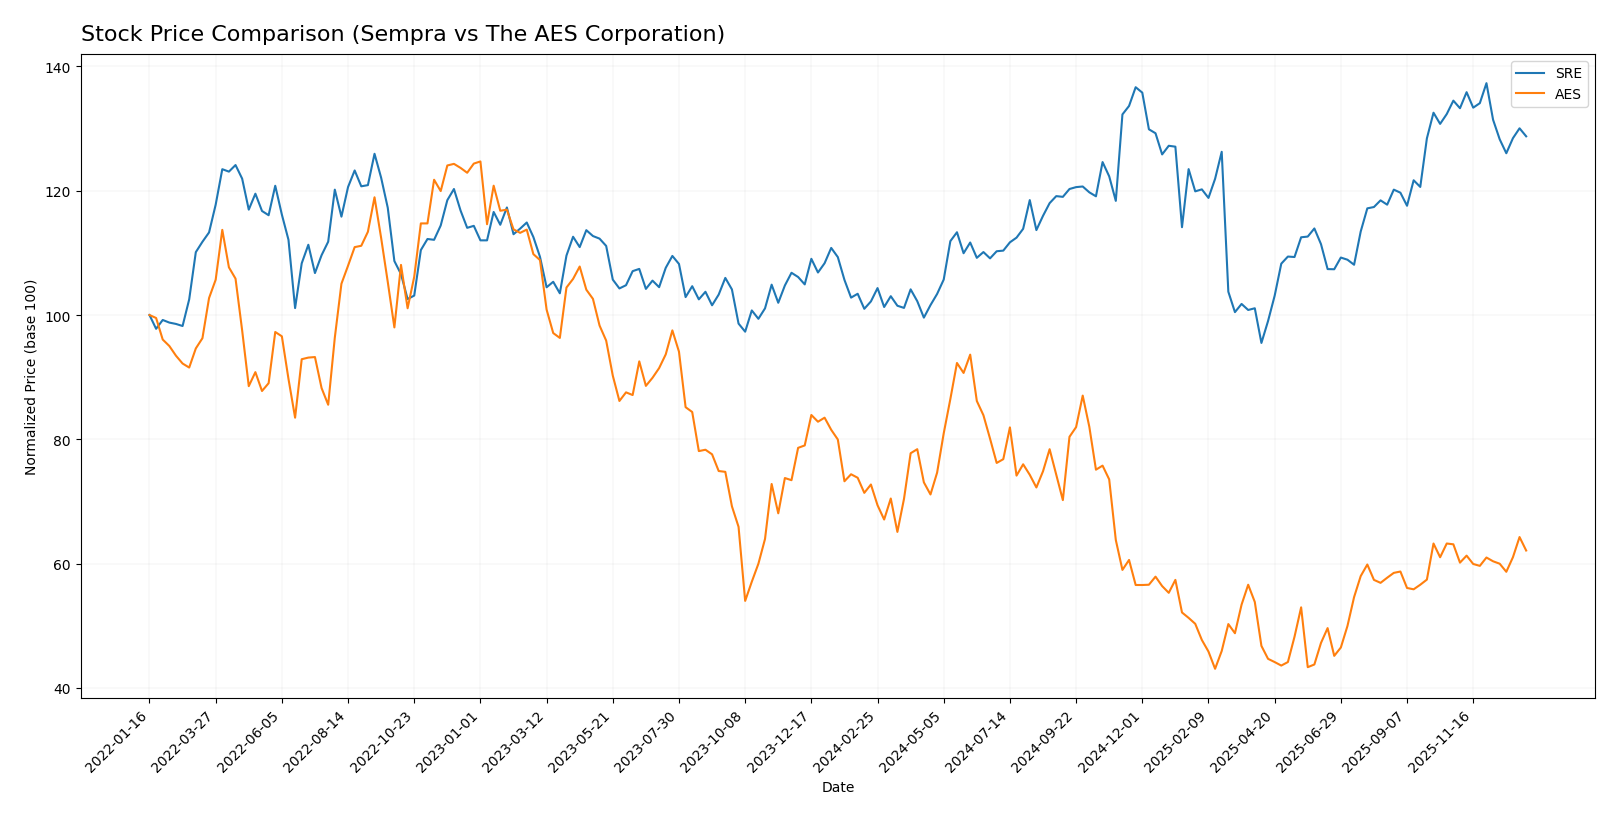
The stock price chart of Sempra (SRE) and The AES Corporation (AES) over the past 12 months reveals significant price movements and contrasting trading dynamics, highlighting a strong bullish trend for Sempra and a sustained bearish trajectory for AES.
Trend Analysis
Sempra’s stock exhibited a bullish trend over the past year with a 26.0% price increase, though the upward momentum showed deceleration. The stock traded between a low of 65.88 and a high of 94.72, with notable volatility indicated by a 7.44 standard deviation.
The AES Corporation experienced a bearish trend with a 14.61% price decline over the same period. The downward trend accelerated, with prices ranging from 9.93 to 21.59 and a lower volatility at 2.96 standard deviation.
Comparing the two stocks, Sempra delivered the highest market performance with a significant positive price change, while AES recorded a notable loss, reflecting divergent investor sentiment and market positioning.
Target Prices
Here is the current analyst consensus on target prices for Sempra and The AES Corporation.
| Company | Target High | Target Low | Consensus |
|---|---|---|---|
| Sempra | 115 | 89 | 100.25 |
| The AES Corporation | 24 | 15 | 17.8 |
Analysts expect Sempra’s stock to appreciate from its current price of 88.82 USD towards the consensus target near 100.25 USD. The AES Corporation’s target consensus of 17.8 USD suggests modest upside potential from its current price of 14.32 USD.
Analyst Opinions Comparison
This section compares analysts’ ratings and grades for Sempra and The AES Corporation:
Rating Comparison
SRE Rating
- Rating: C+ indicates a very favorable overall assessment by analysts.
- Discounted Cash Flow Score: 1, considered very unfavorable for valuation.
- ROE Score: 3, a moderate rating for profitability from shareholders’ equity.
- ROA Score: 3, moderate efficiency in asset utilization.
- Debt To Equity Score: 2, moderate financial risk level.
- Overall Score: 2, a moderate summary score of financial standing.
AES Rating
- Rating: A- reflects a very favorable overall evaluation from analysts.
- Discounted Cash Flow Score: 5, rated very favorable for future cash flow.
- ROE Score: 5, very favorable indicating strong profit generation efficiency.
- ROA Score: 3, moderate efficiency in using assets to generate earnings.
- Debt To Equity Score: 1, very unfavorable indicating higher financial leverage.
- Overall Score: 4, favorable overall financial standing.
Which one is the best rated?
AES is better rated than Sempra based on the provided data, with a higher rating (A- vs. C+), superior discounted cash flow, ROE, and overall scores. However, AES shows a less favorable debt to equity score compared to Sempra.
Scores Comparison
Here is a comparison of the Altman Z-Score and Piotroski Score for Sempra and The AES Corporation:
Sempra Scores
- Altman Z-Score: 1.13, indicating financial distress
- Piotroski Score: 7, reflecting strong financial health
The AES Corporation Scores
- Altman Z-Score: 0.51, indicating financial distress
- Piotroski Score: 5, reflecting average financial health
Which company has the best scores?
Sempra has a higher Piotroski Score at 7 versus AES’s 5, indicating stronger financial health. Both companies are in the distress zone for Altman Z-Score, but Sempra’s score is higher than AES’s.
Grades Comparison
Here is a comparison of recent grades assigned to Sempra and The AES Corporation by reputable grading companies:
Sempra Grades
The following table shows recent grades from major financial institutions for Sempra:
| Grading Company | Action | New Grade | Date |
|---|---|---|---|
| UBS | Maintain | Neutral | 2025-12-17 |
| Citigroup | Maintain | Neutral | 2025-11-24 |
| Goldman Sachs | Upgrade | Buy | 2025-11-14 |
| Barclays | Maintain | Overweight | 2025-11-06 |
| UBS | Maintain | Neutral | 2025-11-06 |
| BMO Capital | Maintain | Outperform | 2025-10-22 |
| Jefferies | Maintain | Hold | 2025-10-22 |
| Barclays | Upgrade | Overweight | 2025-10-20 |
| BMO Capital | Maintain | Outperform | 2025-09-25 |
| Morgan Stanley | Maintain | Overweight | 2025-09-24 |
Overall, Sempra’s grades show a predominance of positive ratings including “Buy,” “Overweight,” and “Outperform,” with several neutral and hold opinions maintained.
The AES Corporation Grades
Recent grades for The AES Corporation from recognized financial firms are as follows:
| Grading Company | Action | New Grade | Date |
|---|---|---|---|
| Argus Research | Upgrade | Buy | 2025-12-05 |
| Jefferies | Upgrade | Hold | 2025-11-18 |
| Mizuho | Maintain | Outperform | 2025-11-06 |
| Morgan Stanley | Maintain | Overweight | 2025-10-22 |
| Barclays | Maintain | Overweight | 2025-10-21 |
| Susquehanna | Maintain | Positive | 2025-10-13 |
| Barclays | Maintain | Overweight | 2025-07-22 |
| JP Morgan | Maintain | Overweight | 2025-07-22 |
| Susquehanna | Maintain | Positive | 2025-07-21 |
| Argus Research | Downgrade | Hold | 2025-05-27 |
AES has mostly favorable grades such as “Buy,” “Outperform,” “Overweight,” and “Positive,” with a few hold ratings and a single sell rating noted.
Which company has the best grades?
Both Sempra and The AES Corporation have received predominantly positive grades from reliable sources, with consensus ratings of “Buy.” Sempra shows a slightly stronger presence of “Outperform” and “Buy” grades, while AES has a broader mix including “Positive” and “Overweight” ratings. Investors may interpret these patterns as generally favorable but nuanced differences in analyst confidence and outlook.
Strengths and Weaknesses
Below is a comparative overview of key strengths and weaknesses for Sempra and The AES Corporation based on the most recent data.
| Criterion | Sempra | The AES Corporation |
|---|---|---|
| Diversification | Moderate: Mainly electricity and So Cal Gas segments; limited recent diversification | Moderate to high: Diverse energy infrastructure, renewables, and utilities segments |
| Profitability | Mixed: High net margin (22.1%), but ROIC (2.94%) below WACC (5.65%), value destroying | Mixed: Lower net margin (13.7%), ROIC (4.46%) below WACC (4.87%), but improving profitability trend |
| Innovation | Limited visibility on innovation; stable traditional energy focus | Focus on new energy technologies and renewables, indicating stronger innovation efforts |
| Global presence | Primarily U.S.-focused, especially California gas utilities | More global footprint with operations in Americas and other regions |
| Market Share | Strong position in Southern California gas market | Growing share in renewables and energy infrastructure globally |
Key takeaways: Sempra shows strong local market dominance but struggles with declining profitability and limited diversification. AES has a broader and more innovative portfolio with improving returns, though still shedding value overall. Both require cautious evaluation regarding capital efficiency and growth prospects.
Risk Analysis
Below is a comparative risk table for Sempra and The AES Corporation based on the most recent data from 2024.
| Metric | Sempra (SRE) | The AES Corporation (AES) |
|---|---|---|
| Market Risk | Beta 0.75 (lower volatility) | Beta 0.97 (higher volatility) |
| Debt Level | Moderate (D/E 1.15, Debt/Assets 37%) | High (D/E 7.96, Debt/Assets 61%) |
| Regulatory Risk | Moderate (US utilities, regulated segments) | Higher due to international exposure |
| Operational Risk | Extensive infrastructure, aging assets | Diverse generation portfolio, including renewables |
| Environmental Risk | Natural gas and electric distribution | Coal and gas exposure, plus renewables |
| Geopolitical Risk | Primarily US-focused | International operations in Latin America, Europe, Asia |
Sempra shows moderate debt and lower beta, indicating less market volatility but faces operational risks from aging infrastructure. AES’s high leverage and broad international exposure elevate financial and geopolitical risks. Notably, AES’s Altman Z-score indicates severe financial distress, heightening bankruptcy risk, while Sempra also remains in distress but with stronger operational cash flow. Investors should weigh AES’s growth potential against its elevated risk profile and consider Sempra’s more stable yet slightly unfavorable financial health.
Which Stock to Choose?
Sempra’s income shows mixed signals with a 14.13% revenue growth over 2020-2024 but declining net income and EPS. Its financial ratios lean slightly unfavorable with a 22.09% net margin but weak ROE and ROIC, and moderate debt levels. The company’s rating is moderate to very favorable with a C+ grade, yet Altman Z-score signals financial distress.
The AES Corporation displays a more favorable income dynamic, with strong overall growth in net income and EPS, and a 27.09% revenue increase over the period. Financial ratios show a robust ROE of 46.27% and favorable P/E but high debt indicators and unfavorable interest coverage. AES’s rating is more positive with an A- grade, though its Altman Z-score also places it in the distress zone.
For investors, AES might appear more attractive for those focused on growth given its strong income and ROE performance, despite high leverage risks. Conversely, Sempra could be seen as more suitable for those with a moderate risk tolerance valuing steadier margins and dividend yield. Both companies exhibit signs of financial stress, suggesting caution is warranted.
Disclaimer: Investment carries a risk of loss of initial capital. The past performance is not a reliable indicator of future results. Be sure to understand risks before making an investment decision.
Go Further
I encourage you to read the complete analyses of Sempra and The AES Corporation to enhance your investment decisions: