In the dynamic world of data storage, Western Digital Corporation (WDC) and Seagate Technology Holdings plc (STX) stand as two titans competing for market leadership. Both companies operate in the computer hardware industry, offering advanced HDD and SSD solutions that power everything from personal devices to massive data centers. Their innovation strategies and global reach make them natural rivals. In this article, I will analyze their strengths to help you decide which stock deserves a place in your portfolio.
Table of contents
Companies Overview
I will begin the comparison between Western Digital Corporation and Seagate Technology Holdings plc by providing an overview of these two companies and their main differences.
Western Digital Corporation Overview
Western Digital Corporation, headquartered in San Jose, California, develops, manufactures, and sells data storage devices and solutions globally. Its offerings include HDDs, SSDs, and flash-based embedded storage for client devices, automotive, IoT, and enterprise applications. Western Digital also provides data center storage platforms and client solutions under brands like G-Technology, SanDisk, and WD, serving OEMs, distributors, and retailers.
Seagate Technology Holdings plc Overview
Seagate Technology, based in Dublin, Ireland, delivers data storage technology and solutions internationally, including enterprise nearline HDDs and SSDs, video and image drives, and external storage products under brands like LaCie. Its portfolio covers mass capacity storage, legacy applications, and the Lyve edge-to-cloud platform. Seagate primarily sells to OEMs, distributors, and retailers, focusing on scalable storage for diverse markets.
Key similarities and differences
Both companies operate in the computer hardware sector, focusing on data storage devices and solutions with global reach. Western Digital has a broader product range including automotive and IoT storage, while Seagate emphasizes mass capacity and nearline enterprise storage, along with edge-to-cloud solutions. Western Digital employs 51K staff versus Seagate’s 30K, and their market caps are $74.3B and $67.7B respectively, reflecting their scale differences.
Income Statement Comparison
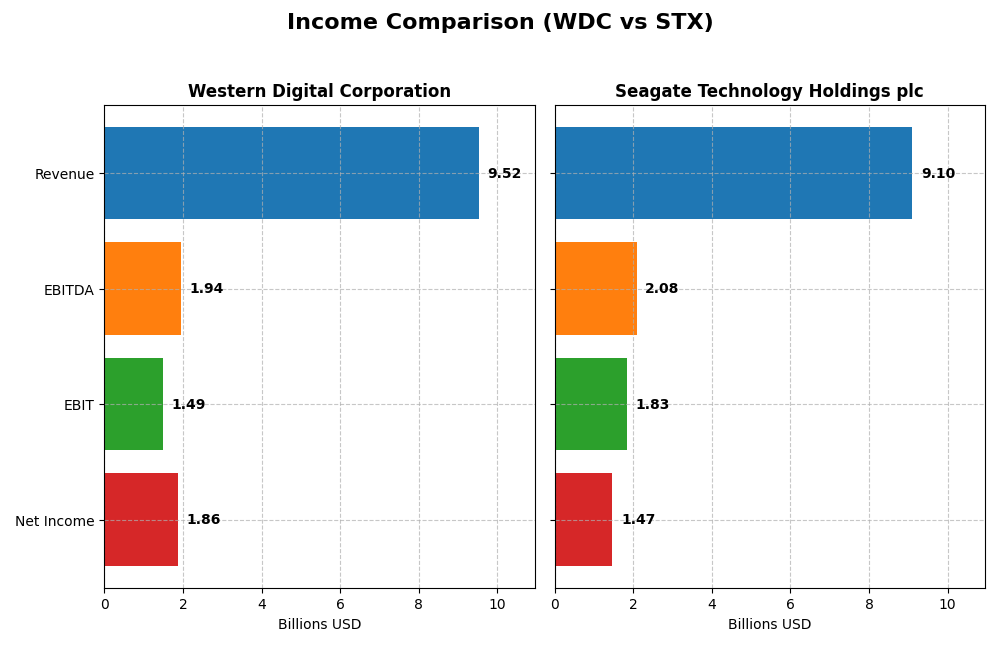
This table presents the latest fiscal year income statement figures for Western Digital Corporation and Seagate Technology Holdings plc, highlighting key financial metrics for 2025.
| Metric | Western Digital Corporation | Seagate Technology Holdings plc |
|---|---|---|
| Market Cap | 74.3B | 67.7B |
| Revenue | 9.52B | 9.10B |
| EBITDA | 1.94B | 2.09B |
| EBIT | 1.49B | 1.83B |
| Net Income | 1.86B | 1.47B |
| EPS | 5.31 | 6.93 |
| Fiscal Year | 2025 | 2025 |
Income Statement Interpretations
Western Digital Corporation
Western Digital’s revenue showed a decline of 43.74% over 2021-2025 but rebounded sharply in 2025 with a 50.7% growth year-over-year. Net income rose by 126.67% over the period, with a robust 254.75% improvement in net margin. The 2025 fiscal year highlighted significant margin recovery, supported by a favorable gross margin of 38.78% and an EBIT margin of 15.62%.
Seagate Technology Holdings plc
Seagate’s revenue declined by 14.83% between 2021 and 2025, yet it experienced a 38.86% increase in revenue during the last year. Net income grew modestly by 11.8% over the overall period, with a 31.26% increase in net margin. In 2025, Seagate reported a solid EBIT margin of 20.16% and maintained a favorable net margin of 16.15%, reflecting improved profitability despite the revenue contraction.
Which one has the stronger fundamentals?
Both Western Digital and Seagate exhibit favorable income statements with over 92% positive indicators. Western Digital shows more pronounced net income and margin growth overall and in the latest year, despite a steeper revenue decline. Seagate presents a steadier revenue trend and higher EBIT margin but more modest income growth. The fundamentals suggest both companies are financially sound, with Western Digital showing stronger recent profitability gains.
Financial Ratios Comparison
The following table presents a side-by-side comparison of key financial ratios for Western Digital Corporation (WDC) and Seagate Technology Holdings plc (STX) based on their most recent fiscal year data (2025).
| Ratios | Western Digital Corporation (WDC) | Seagate Technology Holdings plc (STX) |
|---|---|---|
| ROE | 35.0% | -3.2% |
| ROIC | 21.5% | 33.8% |
| P/E | 11.8 | 20.4 |
| P/B | 4.14 | -66.2 |
| Current Ratio | 1.08 | 1.38 |
| Quick Ratio | 0.84 | 0.84 |
| D/E (Debt-to-Equity) | 0.96 | -11.9 |
| Debt-to-Assets | 36.3% | 67.0% |
| Interest Coverage | 6.54 | 5.89 |
| Asset Turnover | 0.68 | 1.13 |
| Fixed Asset Turnover | 4.06 | 5.49 |
| Payout Ratio | 2.36% | 40.8% |
| Dividend Yield | 0.20% | 2.00% |
Interpretation of the Ratios
Western Digital Corporation
Western Digital shows slightly favorable ratios with strong net margin at 19.55% and impressive returns on equity (35.04%) and invested capital (21.53%). Concerns include a high price-to-book ratio (4.14) and a weak dividend yield of 0.2%. The company pays dividends, but the low yield suggests cautious monitoring of payout sustainability and buyback activities.
Seagate Technology Holdings plc
Seagate’s ratios are generally favorable, with solid returns on invested capital (33.76%) and asset turnover (1.13). However, a deeply negative return on equity (-324.28%) and a high debt-to-assets ratio (66.97%) raise concerns. The firm pays a higher dividend yield of 2.0%, supported by share buybacks, though care is needed given financial leverage.
Which one has the best ratios?
Seagate displays a higher proportion of favorable ratios (57.14%) compared to Western Digital’s 35.71%, reflecting stronger operational efficiency and dividend yield. Nonetheless, both face notable challenges: Western Digital’s valuation metrics and Seagate’s leverage and negative equity returns require investor vigilance in risk management.
Strategic Positioning
This section compares the strategic positioning of Western Digital Corporation and Seagate Technology Holdings plc, including Market position, Key segments, and exposure to technological disruption:
Western Digital Corporation
- Large market cap of $74.3B, facing competitive pressure in computer hardware sector.
- Diversified segments: client devices, cloud storage, retail products drive revenues.
- Exposed to disruption through evolving data storage technologies and cloud demand.
Seagate Technology Holdings plc
- Market cap of $67.7B in computer hardware, also under competitive pressure.
- Focused on mass capacity storage products and legacy applications.
- Faces disruption risks in shifting storage technologies and edge-to-cloud platforms.
Western Digital Corporation vs Seagate Technology Holdings plc Positioning
Western Digital shows a diversified revenue base across client devices, cloud, and retail, while Seagate concentrates on mass capacity storage and legacy solutions. Western Digital’s broader segment spread offers varied business drivers, Seagate’s focus may limit growth scope.
Which has the best competitive advantage?
Both companies demonstrate very favorable moats with growing ROIC trends, indicating durable competitive advantages; Seagate has a higher ROIC premium but Western Digital’s broader segment exposure balances potential risks.
Stock Comparison
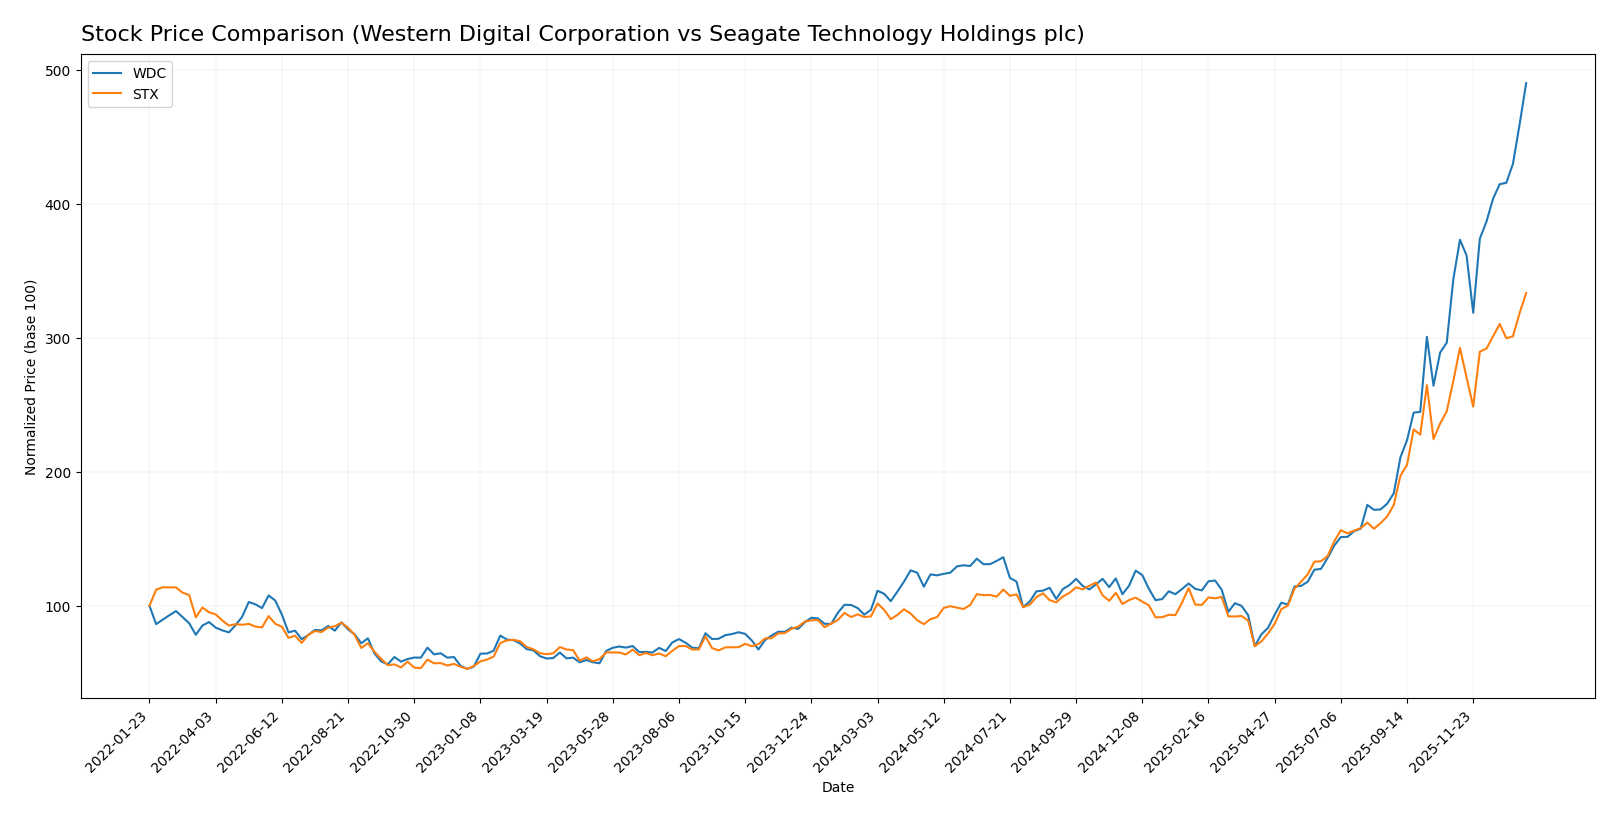
The stock prices of Western Digital Corporation (WDC) and Seagate Technology Holdings plc (STX) have both shown significant upward movements over the past 12 months, with notable acceleration in their trends and strong buyer dominance in trading volumes.
Trend Analysis
Western Digital Corporation (WDC) experienced a bullish trend over the past year, with a 405.19% price increase and accelerating momentum. The stock ranged between 30.54 and 214.0, showing moderate volatility with a standard deviation of 42.58.
Seagate Technology Holdings plc (STX) also showed a bullish trend, rising 261.95% over the year with acceleration. Its price fluctuated between 66.73 and 318.44, exhibiting higher volatility at a 65.54 standard deviation.
Comparing both, WDC delivered the highest market performance with a 405.19% gain versus STX’s 261.95%, reflecting stronger price appreciation over the analyzed period.
Target Prices
Analysts provide a clear consensus on target prices for Western Digital Corporation and Seagate Technology Holdings plc.
| Company | Target High | Target Low | Consensus |
|---|---|---|---|
| Western Digital Corporation | 250 | 135 | 191.3 |
| Seagate Technology Holdings plc | 400 | 150 | 285.54 |
The consensus target prices suggest moderate upside potential for Western Digital, with a consensus below its current price of 214 USD. Seagate’s consensus target indicates a possible downside, as it is below the current price of 318.44 USD. Overall, analysts expect cautious price adjustments relative to current market levels.
Analyst Opinions Comparison
This section compares analysts’ ratings and grades for Western Digital Corporation and Seagate Technology Holdings plc:
Rating Comparison
WDC Rating
- Rating: B, considered Very Favorable overall.
- Discounted Cash Flow Score: 1, rated Very Unfavorable for overvaluation risk.
- ROE Score: 5, Very Favorable for efficient profit generation from equity.
- ROA Score: 5, Very Favorable for asset utilization effectiveness.
- Debt To Equity Score: 1, Very Unfavorable indicating higher financial risk.
- Overall Score: 3, Moderate financial standing.
STX Rating
- Rating: C+, also considered Very Favorable overall.
- Discounted Cash Flow Score: 3, Moderate valuation outlook.
- ROE Score: 1, Very Unfavorable, low efficiency in generating equity returns.
- ROA Score: 5, Very Favorable, strong asset utilization.
- Debt To Equity Score: 1, Very Unfavorable, similar financial risk profile.
- Overall Score: 2, Moderate but lower than WDC.
Which one is the best rated?
Based strictly on provided data, WDC holds a better overall rating (B) and a higher overall score (3) than STX, which has a C+ rating and overall score of 2. WDC outperforms notably in ROE, while both share similar risks in debt levels.
Scores Comparison
Here is a comparison of the Altman Z-Score and Piotroski Score for both companies:
WDC Scores
- Altman Z-Score: 6.09, indicating a safe zone from bankruptcy risk.
- Piotroski Score: 6, reflecting an average level of financial strength.
STX Scores
- Altman Z-Score: 4.67, also placing the company in a safe zone.
- Piotroski Score: 6, similarly indicating average financial health.
Which company has the best scores?
Both WDC and STX are in the safe zone according to their Altman Z-Scores, with WDC having a higher score. Their Piotroski Scores are identical at 6, showing average financial strength for both.
Grades Comparison
Here is the comparison of recent grades and ratings for Western Digital Corporation and Seagate Technology Holdings plc:
Western Digital Corporation Grades
The following table presents recent grades from reputable grading companies for Western Digital Corporation:
| Grading Company | Action | New Grade | Date |
|---|---|---|---|
| Morgan Stanley | Maintain | Overweight | 2025-12-17 |
| Citigroup | Maintain | Buy | 2025-12-02 |
| B of A Securities | Maintain | Buy | 2025-11-20 |
| Loop Capital | Maintain | Buy | 2025-11-10 |
| Benchmark | Maintain | Buy | 2025-10-31 |
| UBS | Maintain | Neutral | 2025-10-31 |
| Mizuho | Maintain | Outperform | 2025-10-31 |
| Citigroup | Maintain | Buy | 2025-10-31 |
| B of A Securities | Maintain | Buy | 2025-10-31 |
| JP Morgan | Maintain | Overweight | 2025-10-31 |
Western Digital shows a consistent pattern of Buy and Overweight grades, with occasional Neutral and Outperform ratings, reflecting overall positive analyst sentiment.
Seagate Technology Holdings plc Grades
The following table presents recent grades from reputable grading companies for Seagate Technology Holdings plc:
| Grading Company | Action | New Grade | Date |
|---|---|---|---|
| Morgan Stanley | Maintain | Overweight | 2025-12-17 |
| Citigroup | Maintain | Buy | 2025-12-02 |
| B of A Securities | Maintain | Buy | 2025-11-20 |
| Loop Capital | Maintain | Buy | 2025-11-10 |
| Cantor Fitzgerald | Maintain | Overweight | 2025-11-06 |
| Barclays | Maintain | Equal Weight | 2025-10-29 |
| Citigroup | Maintain | Buy | 2025-10-29 |
| Susquehanna | Maintain | Negative | 2025-10-29 |
| Benchmark | Maintain | Buy | 2025-10-29 |
| Rosenblatt | Maintain | Buy | 2025-10-29 |
Seagate Technology’s grades generally lean toward Buy and Overweight, but include some diversity with Equal Weight and a Negative rating, indicating mixed analyst opinions.
Which company has the best grades?
Both Western Digital and Seagate Technology have consensus ratings of “Buy,” but Western Digital exhibits a more uniform positive outlook across grading companies. Seagate presents slightly more rating variability, which could imply moderately higher analyst uncertainty affecting investor perception.
Strengths and Weaknesses
Below is a comparison of key strengths and weaknesses for Western Digital Corporation (WDC) and Seagate Technology Holdings plc (STX) based on the most recent financial and operational data.
| Criterion | Western Digital Corporation (WDC) | Seagate Technology Holdings plc (STX) |
|---|---|---|
| Diversification | Moderate: Revenue spread across Client Devices ($556M), Cloud ($8.34B), Retail Products ($623M) segments, indicating some diversification. | Limited segment data available; product diversification unclear but known focus on storage solutions. |
| Profitability | Favorable: Net margin 19.55%, ROIC 21.53%, ROE 35.04%, indicating strong profitability and efficient capital use. | Mixed: Net margin 16.15%, very high ROIC 33.76%, but negative ROE (-324.28%) signals instability in equity returns. |
| Innovation | Very Favorable moat with growing ROIC (+328.7%), showing durable competitive advantage and increasing profitability. | Very Favorable moat with positive ROIC trend (+39.6%), indicating solid innovation and competitive positioning. |
| Global presence | Strong, supported by diversified revenue streams including significant Cloud segment sales. | Strong global presence, though revenue segmentation data is limited. |
| Market Share | Solid, with competitive advantage reflected in financial metrics and product segments. | Strong market position, especially reflected in high ROIC and favorable financial ratios. |
Key takeaways: Both companies demonstrate durable competitive advantages with growing profitability. WDC shows more diversification and stable profitability, while STX offers higher ROIC but exhibits equity return volatility. Investors should weigh diversification against potential risks in equity performance.
Risk Analysis
Below is a table summarizing key risks for Western Digital Corporation (WDC) and Seagate Technology Holdings plc (STX) as of 2025-2026:
| Metric | Western Digital Corporation (WDC) | Seagate Technology Holdings plc (STX) |
|---|---|---|
| Market Risk | High beta (1.845) indicates volatility; tech sector sensitivity | Moderately high beta (1.619); cyclical demand risk |
| Debt level | Moderate debt ratio (DE ~0.96); neutral risk | Higher debt to assets (67%); unfavorable leverage |
| Regulatory Risk | Moderate; US and global tech regulations | Moderate; EU and US regulations impact operations |
| Operational Risk | Medium; supply chain and tech innovation challenges | Medium; manufacturing scale and legacy product lines |
| Environmental Risk | Moderate; sustainability initiatives ongoing | Moderate; focus on energy efficiency but legacy impact |
| Geopolitical Risk | Exposure to China and international markets | Exposure to international trade tensions, including Asia |
Western Digital faces pronounced market volatility and moderate leverage risk, while Seagate’s higher debt levels and international exposure are the most impactful risks. Both companies operate in a competitive, regulation-sensitive tech hardware industry with ongoing innovation and supply chain pressures. Cautious monitoring of debt management and geopolitical developments is essential.
Which Stock to Choose?
Western Digital Corporation (WDC) shows a favorable income evolution with strong recent growth in revenue and profits. Its financial ratios are slightly favorable overall, highlighted by a high ROE of 35% and solid profitability, balanced by moderate debt and a “B” rating. The company demonstrates a very favorable moat with ROIC well above WACC and growing, supported by a safe Altman Z-Score and average Piotroski score.
Seagate Technology Holdings plc (STX) also reports favorable income growth and profitability, with a global ratios evaluation rated favorable, despite a negative ROE and high debt to assets. Its rating is “C+” but still very favorable, and it maintains a very favorable moat with ROIC exceeding WACC, a safe Altman Z-Score, and an average Piotroski score. STX exhibits stronger asset turnover and dividend yield compared to WDC.
For investors prioritizing growth and strong equity returns, WDC’s robust ROE, improving income metrics, and durable competitive advantage might appear more appealing. Conversely, those valuing operational efficiency, cash flow quality, and dividend yield could find STX’s profile more suitable given its favorable overall ratios and cash conversion metrics. Ultimately, the choice could depend on the investor’s risk tolerance and strategy focus.
Disclaimer: Investment carries a risk of loss of initial capital. The past performance is not a reliable indicator of future results. Be sure to understand risks before making an investment decision.
Go Further
I encourage you to read the complete analyses of Western Digital Corporation and Seagate Technology Holdings plc to enhance your investment decisions: