Home > Comparison > Technology > STX vs SMCI
The strategic rivalry between Seagate Technology Holdings plc and Super Micro Computer, Inc. shapes the future of the computer hardware sector. Seagate operates as a mass capacity storage technology leader with a capital-intensive model, while Super Micro focuses on modular, high-performance server and storage solutions with a nimble, service-oriented approach. This head-to-head highlights a clash between scale-driven manufacturing and agile innovation. This analysis will reveal which trajectory offers a superior risk-adjusted return for diversified portfolios.

Table of contents
Companies Overview
Seagate Technology and Super Micro Computer shape the computer hardware landscape with distinct market approaches.
Seagate Technology Holdings plc: Data Storage Innovator
Seagate dominates in mass capacity storage products, including HDDs, SSDs, and network-attached drives. Its core revenue comes from selling to OEMs and retailers globally. In 2026, Seagate focuses strategically on expanding its Lyve edge-to-cloud platform, reinforcing its leadership in scalable storage solutions.
Super Micro Computer, Inc.: Modular Server Systems Leader
Super Micro excels in high-performance server and storage solutions built on modular, open architecture. It generates revenue through direct and indirect sales of servers, subsystems, and management software. Its 2026 strategy zeroes in on serving enterprise data centers and emerging markets like AI, 5G, and edge computing with tailored integration services.
Strategic Collision: Similarities & Divergences
Seagate pursues a product-centric ecosystem focused on storage capacity, while Super Micro champions an open, modular infrastructure enabling customization. Both compete fiercely in data storage and server markets but target different customer bases—Seagate prioritizes OEMs; Super Micro targets cloud and AI sectors. Their investment profiles diverge: Seagate offers scale and legacy strength, Super Micro emphasizes innovation and agility.
Income Statement Comparison
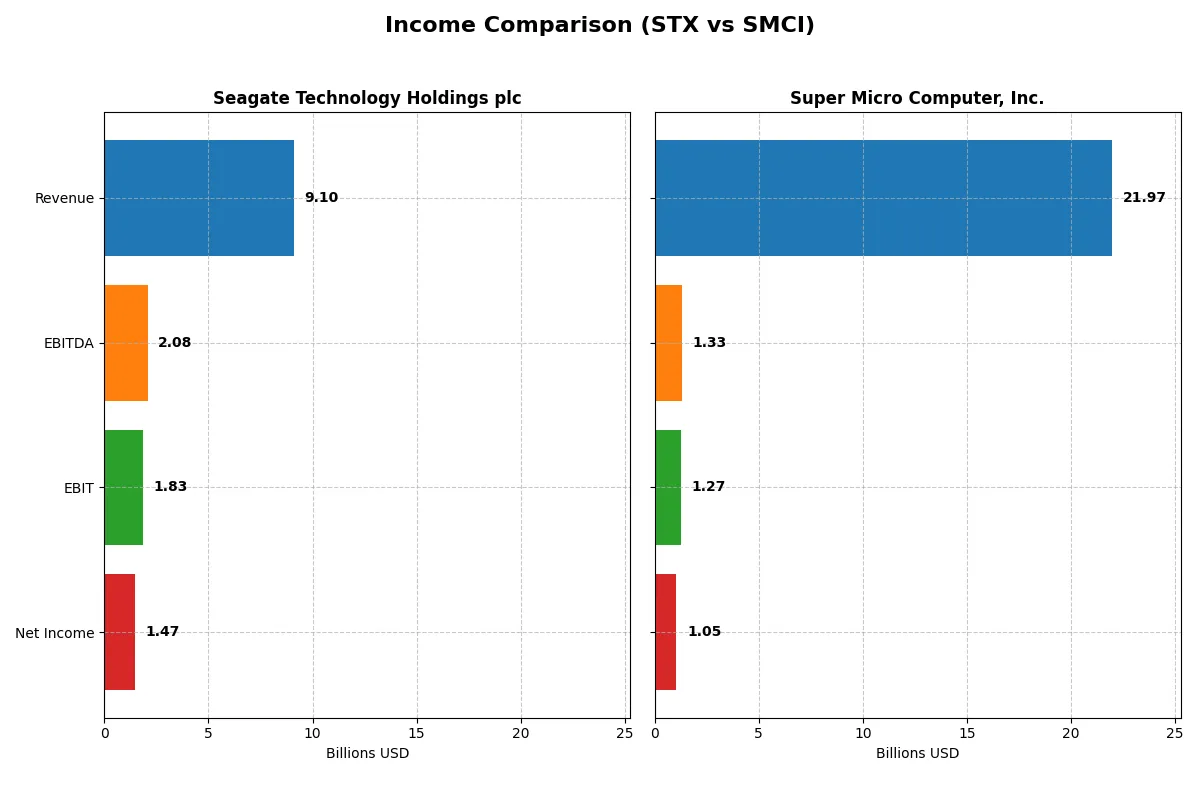
This data dissects the core profitability and scalability of both corporate engines to reveal who dominates the bottom line:
| Metric | Seagate Technology Holdings plc (STX) | Super Micro Computer, Inc. (SMCI) |
|---|---|---|
| Revenue | 9.1B | 21.97B |
| Cost of Revenue | 5.9B | 19.54B |
| Operating Expenses | 1.31B | 1.18B |
| Gross Profit | 3.2B | 2.43B |
| EBITDA | 2.09B | 1.33B |
| EBIT | 1.83B | 1.27B |
| Interest Expense | 321M | 60M |
| Net Income | 1.47B | 1.05B |
| EPS | 6.93 | 1.77 |
| Fiscal Year | 2025 | 2025 |
Income Statement Analysis: The Bottom-Line Duel
This income statement comparison reveals which company operates with greater efficiency and profitability in the current market landscape.
Seagate Technology Holdings plc Analysis
Seagate’s revenue shows a dip from 11.7B in 2022 to 9.1B in 2025, yet net income climbs to 1.47B in 2025 from a loss in 2023. It sustains strong gross and net margins at 35.18% and 16.15%, respectively, reflecting a robust cost structure and improving profitability momentum in 2025.
Super Micro Computer, Inc. Analysis
Super Micro’s revenue surges from 3.6B in 2021 to 21.97B in 2025, accompanied by solid net income growth to 1.05B. Margins remain modest, with gross margin at 11.06% and net margin at 4.77%. The latest year shows significant top-line expansion but margin pressure limits bottom-line efficiency.
Margin Strength vs. Revenue Growth Scale
Seagate leads with superior margin health and profitability despite lower revenue growth, signaling operational efficiency and resilience. Super Micro impresses with rapid revenue expansion but struggles to convert sales into strong profits. Investors seeking margin power and stable earnings may favor Seagate’s profile over Super Micro’s high-growth yet thinner-margin approach.
Financial Ratios Comparison
These vital ratios act as a diagnostic tool to expose the underlying fiscal health, valuation premiums, and capital efficiency of the companies compared below:
| Ratios | Seagate Technology Holdings plc (STX) | Super Micro Computer, Inc. (SMCI) |
|---|---|---|
| ROE | -3.24% | 16.64% |
| ROIC | 33.76% | 9.26% |
| P/E | 20.41 | 27.74 |
| P/B | -66.19 | 4.62 |
| Current Ratio | 1.38 | 5.25 |
| Quick Ratio | 0.84 | 3.25 |
| D/E (Debt-to-Equity) | -11.86 | 0.76 |
| Debt-to-Assets | 67.0% | 34.1% |
| Interest Coverage | 5.89 | 21.03 |
| Asset Turnover | 1.13 | 1.57 |
| Fixed Asset Turnover | 5.49 | 27.53 |
| Payout Ratio | 40.8% | 0% |
| Dividend Yield | 2.00% | 0% |
| Fiscal Year | 2025 | 2025 |
Efficiency & Valuation Duel: The Vital Signs
Financial ratios act as a company’s DNA, uncovering hidden risks and revealing operational strengths critical to investors’ decisions.
Seagate Technology Holdings plc
Seagate shows mixed signals with a strong net margin of 16.15% but a deeply negative ROE at -324%, indicating shareholder returns are under pressure. Its P/E of 20.41 suggests a fairly valued stock. The company supports shareholders with a 2% dividend yield, balancing reinvestment and income.
Super Micro Computer, Inc.
Super Micro posts a positive ROE of 16.64% but struggles with a low net margin of 4.77%, signaling less profitability per dollar of sales. A P/E of 27.74 marks the stock as expensive relative to earnings. The firm does not pay dividends, likely reinvesting for growth and operational expansion.
Balanced Profitability vs. Valuation Stretch
Seagate offers a more favorable overall ratio profile, with better profitability and shareholder returns, despite its negative ROE anomaly. Super Micro’s higher valuation and weaker margins suggest greater risk for less immediate reward. Investors seeking stable income might prefer Seagate; growth-oriented profiles might tolerate Super Micro’s premium.
Which one offers the Superior Shareholder Reward?
Seagate Technology (STX) pays a 2.0% dividend yield with a 41% payout ratio, supported by 75% FCF coverage. Its buybacks are moderate but steady, balancing cash returns with debt levels. Super Micro Computer (SMCI) pays no dividends, focusing on aggressive reinvestment and robust buybacks fueled by high free cash flow and low leverage. Historically, Seagate’s distribution is more balanced and sustainable amid market cycles. SMCI’s growth-driven model risks cash flow volatility but offers higher capital appreciation potential. In 2026, I favor STX for income-focused investors seeking durable returns; SMCI suits growth seekers willing to tolerate higher risk.
Comparative Score Analysis: The Strategic Profile
The radar chart reveals the fundamental DNA and trade-offs of Seagate Technology and Super Micro Computer, highlighting their distinct financial strengths and weaknesses:
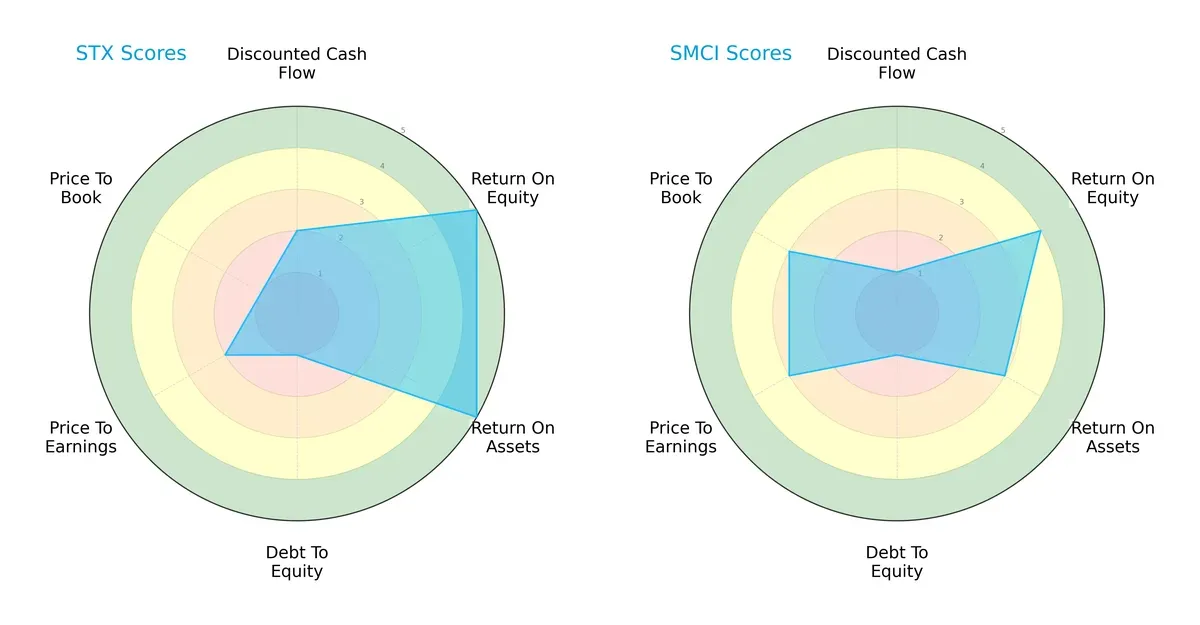
Seagate Technology dominates in profitability with high ROE (5) and ROA (5) scores, showing operational efficiency. However, it suffers from a weak balance sheet, reflected in a very unfavorable debt-to-equity (1) and price-to-book (1) score. Super Micro Computer displays a more moderate but balanced profile, with decent valuation metrics (P/E 3, P/B 3) and moderate asset returns, though its discounted cash flow score is very unfavorable (1). Seagate leans on profit generation; Super Micro offers a more valuation-focused edge.
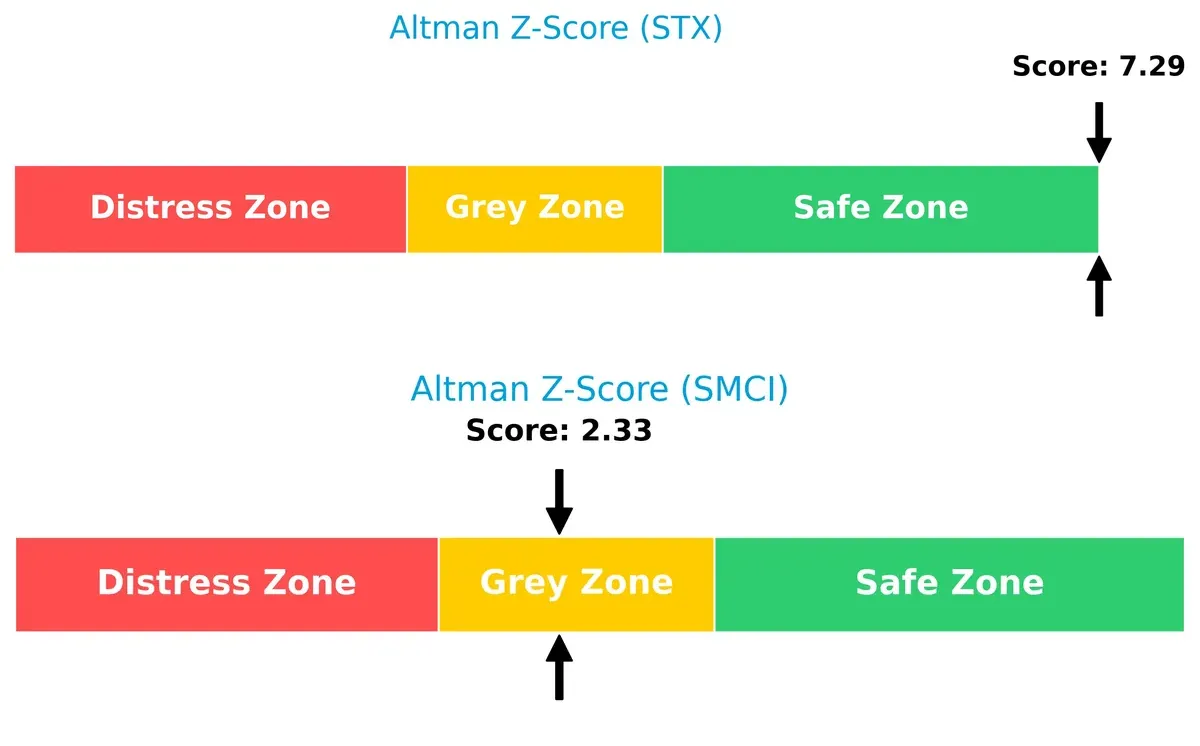
Bankruptcy Risk: Solvency Showdown
Seagate’s Altman Z-Score of 7.3 places it comfortably in the safe zone, signaling strong solvency and low bankruptcy risk. Super Micro’s 2.3 score situates it in the grey zone, indicating moderate distress risk and caution for long-term survival in this cycle:
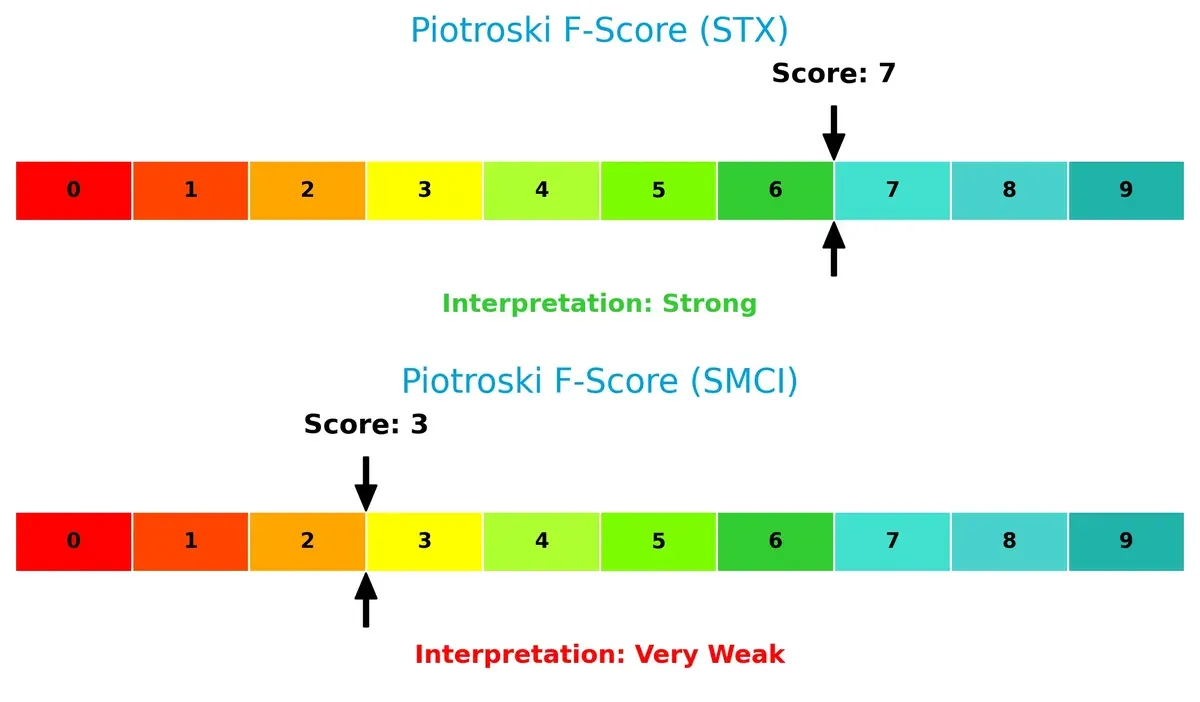
Financial Health: Quality of Operations
Seagate’s Piotroski F-Score of 7 signals strong financial health and robust internal metrics. In contrast, Super Micro’s score of 3 flags potential red flags in profitability, liquidity, or efficiency, demanding investor vigilance:
How are the two companies positioned?
This section dissects the operational DNA of Seagate Technology (STX) and Super Micro Computer (SMCI) by comparing revenue distribution and internal strengths and weaknesses. The goal is to confront their economic moats, revealing which model sustains the most resilient competitive advantage today.
Revenue Segmentation: The Strategic Mix
This visual comparison dissects how Seagate Technology Holdings plc and Super Micro Computer, Inc. diversify their income streams and reveals where their primary sector bets lie:
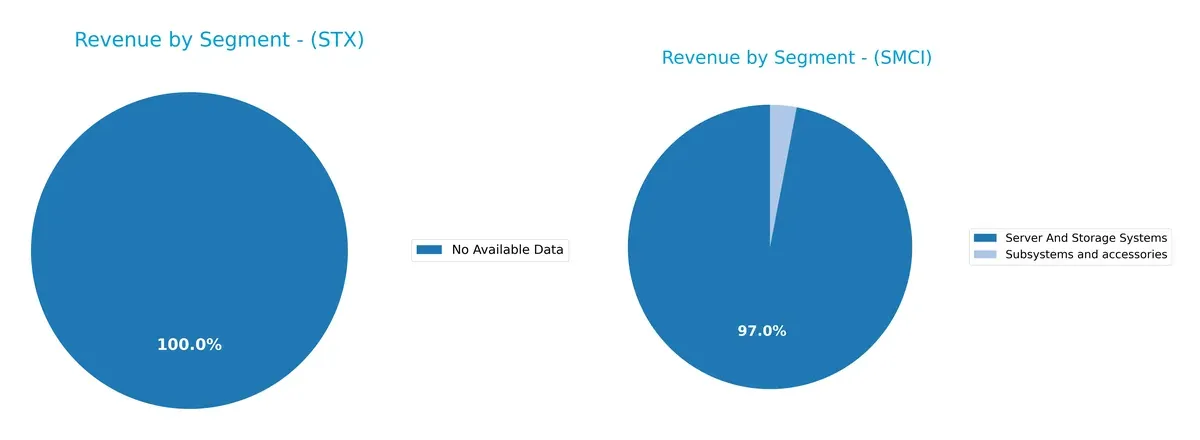
Seagate Technology lacks sufficient data for segmentation analysis. Super Micro pivots heavily on “Server And Storage Systems,” generating $21.3B in 2025, dwarfing its $660M from “Subsystems and accessories.” This concentration signals a deep infrastructure focus but raises concentration risk. In contrast, Seagate’s unknown segmentation prevents direct comparison, limiting insight into its strategic diversification or ecosystem lock-in.
Strengths and Weaknesses Comparison
This table compares the strengths and weaknesses of Seagate Technology Holdings plc and Super Micro Computer, Inc.:
Seagate Technology Holdings plc Strengths
- Favorable net margin at 16.15%
- Strong ROIC at 33.76% above WACC
- High fixed asset turnover at 5.49
- Favorable dividend yield at 2.0%
- Solid interest coverage at 5.71
- Balanced global presence including US and Singapore
Super Micro Computer, Inc. Strengths
- Favorable ROE at 16.64%
- High fixed asset turnover at 27.53
- Strong interest coverage at 21.34
- High asset turnover at 1.57
- Growing revenue in Server And Storage Systems segment
- Favorable quick ratio at 3.25
Seagate Technology Holdings plc Weaknesses
- Unfavorable ROE at -324.28%
- High debt to assets ratio at 67%
- WACC higher than ROE
- Negative price-to-book ratio
- Neutral current and quick ratios
- High leverage indicated by negative debt/equity ratio
Super Micro Computer, Inc. Weaknesses
- Unfavorable net margin at 4.77%
- Unfavorable P/E at 27.74 and P/B at 4.62
- Neutral debt/equity and debt to assets ratios
- Unfavorable current ratio at 5.25
- Zero dividend yield
- Mixed profitability metrics with neutral ROIC and WACC
Seagate shows strengths in profitability and asset efficiency but faces leverage and return on equity challenges. Super Micro exhibits operational efficiency and growth but contends with lower margins and valuation concerns. Both must balance financial health with market expansion strategies.
The Moat Duel: Analyzing Competitive Defensibility
A structural moat is the only true shield protecting long-term profits from relentless competitive erosion:
Seagate Technology Holdings plc: Cost Advantage and Scale Moat
Seagate leverages cost advantages through scale and efficient capital use, reflected in a strong 22.5% ROIC above WACC. Margin stability and product diversification deepen its moat in 2026.
Super Micro Computer, Inc.: Modular Architecture and Niche Focus
Super Micro’s moat stems from its modular, open architecture catering to niche markets. Despite growing ROIC, it currently sheds value with a negative spread versus WACC, limiting its moat breadth versus Seagate.
Cost Efficiency vs. Innovation Flexibility: The Moat Showdown
Seagate’s wide cost moat and superior capital returns outmatch Super Micro’s narrower, innovation-driven advantage. Seagate stands better poised to defend market share amid intensifying industry competition.
Which stock offers better returns?
The past year shows starkly diverging price dynamics between Seagate Technology Holdings plc and Super Micro Computer, Inc., with Seagate accelerating strongly while Super Micro faces persistent declines.
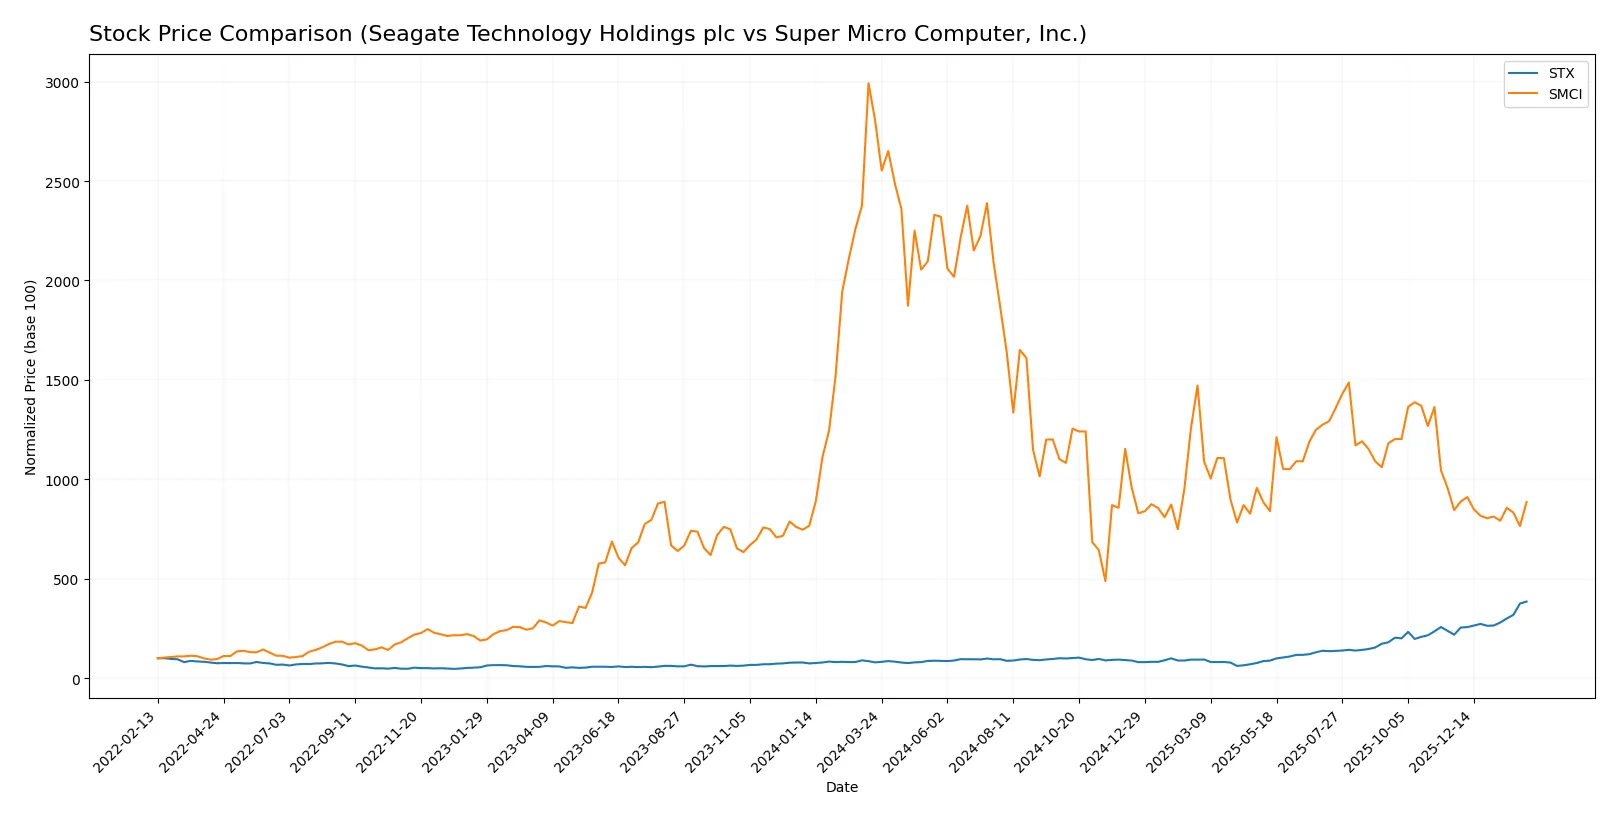
Trend Comparison
Seagate Technology Holdings plc’s stock surged 386.72% over the past year, showing a bullish trend with accelerating momentum and high volatility, hitting a peak at 418.63.
Super Micro Computer, Inc. declined 68.41% over the same period, reflecting a bearish trend with accelerating downward pressure and lower volatility, bottoming at 18.58.
Seagate’s stock outperformed Super Micro significantly, delivering the highest market returns with strong buyer dominance and increasing volume trends.
Target Prices
The consensus target prices reflect bullish analyst expectations for both Seagate Technology and Super Micro Computer.
| Company | Target Low | Target High | Consensus |
|---|---|---|---|
| Seagate Technology Holdings plc | 270 | 505 | 407.2 |
| Super Micro Computer, Inc. | 26 | 64 | 47.13 |
Analysts expect Seagate’s shares to appreciate modestly from the current 419 USD price, while Super Micro’s consensus target implies a significant upside from 33.76 USD.

Don’t Let Luck Decide Your Entry Point
Optimize your entry points with our advanced ProRealTime indicators. You’ll get efficient buy signals with precise price targets for maximum performance. Start outperforming now!
How do institutions grade them?
Seagate Technology Holdings plc Grades
The following table summarizes recent grades assigned to Seagate Technology Holdings plc by major institutions:
| Grading Company | Action | New Grade | Date |
|---|---|---|---|
| Cantor Fitzgerald | Maintain | Overweight | 2026-02-04 |
| Citigroup | Maintain | Buy | 2026-01-29 |
| Baird | Maintain | Outperform | 2026-01-29 |
| Rosenblatt | Maintain | Buy | 2026-01-28 |
| UBS | Maintain | Neutral | 2026-01-28 |
| Barclays | Maintain | Equal Weight | 2026-01-28 |
| Mizuho | Maintain | Outperform | 2026-01-28 |
| Goldman Sachs | Maintain | Buy | 2026-01-28 |
| Wells Fargo | Maintain | Equal Weight | 2026-01-28 |
| Cantor Fitzgerald | Maintain | Overweight | 2026-01-28 |
Super Micro Computer, Inc. Grades
The following table summarizes recent grades assigned to Super Micro Computer, Inc. by major institutions:
| Grading Company | Action | New Grade | Date |
|---|---|---|---|
| Barclays | Maintain | Equal Weight | 2024-10-02 |
| Loop Capital | Maintain | Buy | 2024-09-23 |
| JP Morgan | Downgrade | Neutral | 2024-09-06 |
| Barclays | Downgrade | Equal Weight | 2024-09-04 |
| Barclays | Maintain | Overweight | 2024-08-28 |
| Wells Fargo | Maintain | Equal Weight | 2024-08-28 |
| CFRA | Downgrade | Hold | 2024-08-28 |
| Goldman Sachs | Maintain | Neutral | 2024-08-08 |
| Wells Fargo | Maintain | Equal Weight | 2024-08-07 |
| Rosenblatt | Maintain | Buy | 2024-08-07 |
Which company has the best grades?
Seagate Technology holds consistently stronger grades with multiple “Buy” and “Outperform” ratings in early 2026. Super Micro Computer’s grades show more downgrades and neutral stances in 2024. Investors may view Seagate’s higher and more stable ratings as a signal of greater institutional confidence.
Risks specific to each company
The following categories identify critical pressure points and systemic threats facing Seagate Technology Holdings plc and Super Micro Computer, Inc. in the 2026 market environment:
1. Market & Competition
Seagate Technology Holdings plc
- Faces intense competition in mass storage; legacy HDD demand declines challenge growth.
Super Micro Computer, Inc.
- Competes in high-performance server markets; innovation pace and price pressure remain high.
2. Capital Structure & Debt
Seagate Technology Holdings plc
- High debt-to-assets at 67% signals leverage risk despite good interest coverage.
Super Micro Computer, Inc.
- Moderate debt levels with strong interest coverage; capital structure appears balanced.
3. Stock Volatility
Seagate Technology Holdings plc
- Beta of 1.635 and wide price range reflect above-average volatility and market sensitivity.
Super Micro Computer, Inc.
- Beta of 1.523 and volatile trading volume indicate notable but slightly lower market swings.
4. Regulatory & Legal
Seagate Technology Holdings plc
- Global operations expose it to complex data storage regulations and compliance costs.
Super Micro Computer, Inc.
- US-centric base still faces cybersecurity and export control risks amid evolving regulations.
5. Supply Chain & Operations
Seagate Technology Holdings plc
- Relies heavily on global suppliers; potential disruption risk remains elevated post-pandemic.
Super Micro Computer, Inc.
- Modular design less supply-dependent but sensitive to component shortages and logistics delays.
6. ESG & Climate Transition
Seagate Technology Holdings plc
- Faces pressure to reduce carbon footprint in energy-intensive manufacturing processes.
Super Micro Computer, Inc.
- ESG efforts emerging; energy efficiency gains in server products could boost appeal.
7. Geopolitical Exposure
Seagate Technology Holdings plc
- Exposure to international trade tensions, especially US-China and EU regulations.
Super Micro Computer, Inc.
- US base limits direct geopolitical risks but global sales channels remain vulnerable.
Which company shows a better risk-adjusted profile?
Seagate’s most impactful risk is its high leverage, complicating financial flexibility despite strong operating returns. Super Micro faces weaker profitability and financial strength, with an Altman Z-score in the grey zone and a very weak Piotroski score raising bankruptcy concerns. Overall, Seagate shows a better risk-adjusted profile supported by a safe Altman Z-score and stronger operational metrics, though its debt level demands vigilance. Super Micro’s recent strong price gains mask underlying financial fragility, urging caution for risk-sensitive investors.
Final Verdict: Which stock to choose?
Seagate Technology Holdings plc (STX) stands out for its exceptional capital efficiency and sustainable value creation. Its very favorable moat, reflected in a robust ROIC significantly above WACC, signals disciplined management and strong competitive positioning. A point of vigilance remains its elevated financial leverage, which could pressure stability in downturns. STX suits investors seeking Aggressive Growth with a tolerance for balance sheet risk.
Super Micro Computer, Inc. (SMCI) offers a strategic moat built on operational flexibility and solid equity returns, though it currently struggles with value destruction relative to capital costs. Its much stronger liquidity profile compared to STX provides a cushion against short-term shocks. SMCI fits portfolios favoring GARP—Growth at a Reasonable Price—with a preference for financial stability over peak profitability.
If you prioritize high returns on invested capital and growth momentum, Seagate outshines with its proven ability to generate shareholder value despite leverage concerns. However, if you seek better stability and liquidity with moderate growth, Super Micro offers a safer harbor albeit with the tradeoff of subdued profitability metrics. Both present distinct analytical scenarios depending on your risk appetite and investment horizon.
Disclaimer: Investment carries a risk of loss of initial capital. The past performance is not a reliable indicator of future results. Be sure to understand risks before making an investment decision.
Go Further
I encourage you to read the complete analyses of Seagate Technology Holdings plc and Super Micro Computer, Inc. to enhance your investment decisions: