Home > Comparison > Technology > TRMB vs SANM
The strategic rivalry between Trimble Inc. and Sanmina Corporation shapes the trajectory of the hardware and equipment sector. Trimble operates as a technology-driven solutions provider, focusing on specialized software and precision agriculture systems. In contrast, Sanmina delivers capital-intensive integrated manufacturing and supply chain services. This head-to-head pits innovation-led growth against scale-driven manufacturing prowess. This analysis aims to identify which corporate path offers superior risk-adjusted returns for a diversified portfolio.

Table of contents
Companies Overview
Trimble Inc. and Sanmina Corporation stand as key players in the hardware and equipment sector, shaping technology solutions globally.
Trimble Inc.: Precision Tech Innovator
Trimble Inc. dominates technology solutions for professionals and field workers worldwide. Its core revenue stems from software and hardware in construction, geospatial, agriculture, and transportation. In 2026, it strategically focuses on integrated field and office solutions, enhancing data sharing, asset management, and autonomous systems to improve operational efficiency.
Sanmina Corporation: Integrated Manufacturing Powerhouse
Sanmina Corporation leads in integrated manufacturing solutions globally, serving diverse sectors including aerospace and medical. It generates revenue through product design, prototyping, assembly, and after-market services. In 2026, its strategic focus sharpens on expanding manufacturing capabilities and supply chain management to support OEMs with high-complexity components and systems.
Strategic Collision: Similarities & Divergences
Both firms operate in hardware and technology yet diverge sharply: Trimble emphasizes software-driven field productivity, while Sanmina prioritizes end-to-end manufacturing and logistics. Their primary battleground lies in serving industrial clients requiring cutting-edge tech integration versus scalable manufacturing. This contrast defines their distinct investment profiles—Trimble as a software-embedded innovator and Sanmina as a manufacturing services stalwart.
Income Statement Comparison
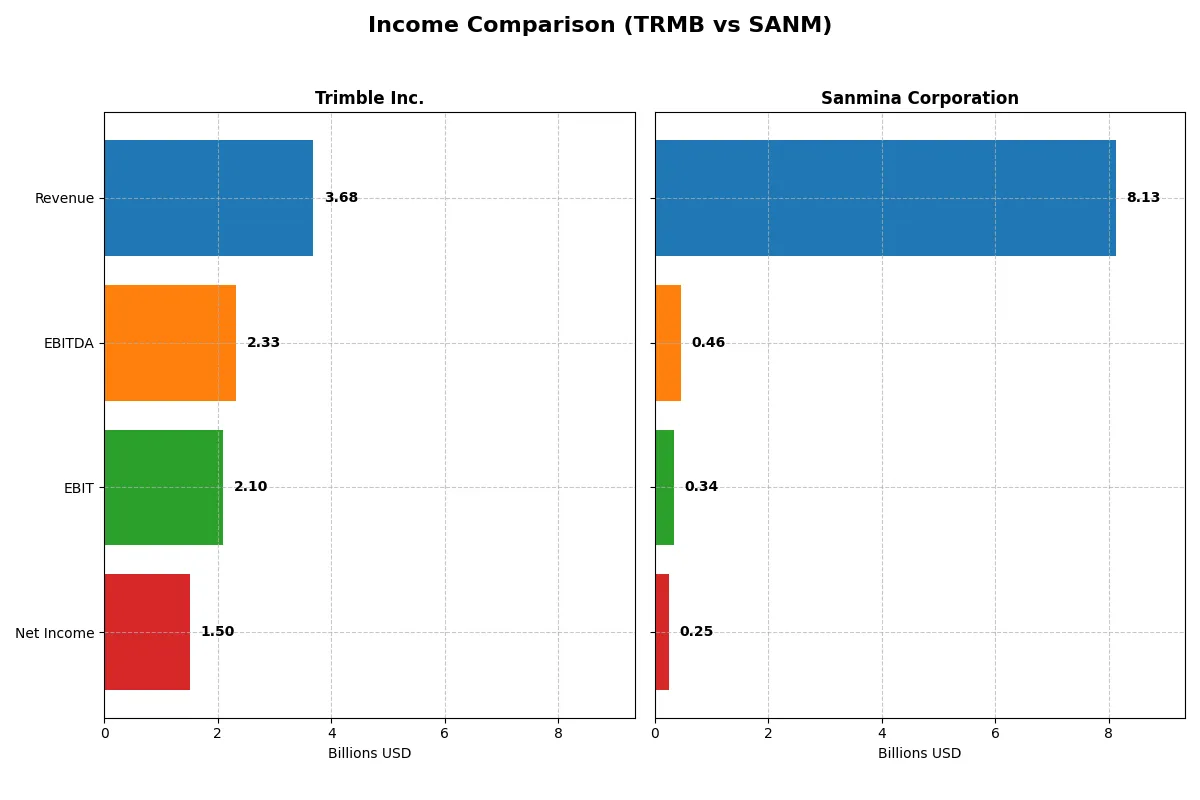
This data dissects the core profitability and scalability of both corporate engines to reveal who dominates the bottom line:
| Metric | Trimble Inc. (TRMB) | Sanmina Corporation (SANM) |
|---|---|---|
| Revenue | 3.68B | 8.13B |
| Cost of Revenue | 1.29B | 7.41B |
| Operating Expenses | 1.94B | 362M |
| Gross Profit | 2.40B | 716M |
| EBITDA | 2.33B | 463M |
| EBIT | 2.10B | 344M |
| Interest Expense | 91M | 4.30M |
| Net Income | 1.50B | 246M |
| EPS | 6.13 | 4.56 |
| Fiscal Year | 2024 | 2025 |
Income Statement Analysis: The Bottom-Line Duel
This income statement comparison reveals how each company converts revenue into profit and manages costs to drive shareholder value.
Trimble Inc. Analysis
Trimble’s revenue grew 17% from 2020 to 2024 but dipped 3% in the last year to $3.68B. Net income surged 286% over five years, reaching $1.5B in 2024. Gross margin stayed robust at 65%, while net margin climbed to 41%, signaling exceptional profitability and operational efficiency in the latest fiscal year.
Sanmina Corporation Analysis
Sanmina increased revenue steadily by 21% from 2021 to 2025, hitting $8.13B in 2025. However, net income declined slightly over the period, posting $246M in 2025. Gross margin remained thin at 8.8%, with net margin at just 3%. Despite solid top-line growth, profitability margins indicate ongoing pressure on cost control and operational leverage.
Margin Strength vs. Scale Growth
Trimble’s superior margins and explosive net income growth clearly outpace Sanmina’s top-line gains. Trimble demonstrates a high-return business model with efficient cost management. Sanmina’s scale expands, but its slim margins and stagnant net income highlight fundamental profitability challenges. Investors seeking robust earnings growth may find Trimble’s profile more compelling.
Financial Ratios Comparison
These vital ratios act as a diagnostic tool to expose the underlying fiscal health, valuation premiums, and capital efficiency of the companies compared below:
| Ratios | Trimble Inc. (TRMB) | Sanmina Corporation (SANM) |
|---|---|---|
| ROE | 26.18% | 10.45% |
| ROIC | 4.49% | 9.04% |
| P/E | 11.52 | 17.10 |
| P/B | 3.02 | 2.67 |
| Current Ratio | 1.27 | 1.99 |
| Quick Ratio | 1.16 | 1.25 |
| D/E | 0.26 | 0.17 |
| Debt-to-Assets | 15.96% | 7.63% |
| Interest Coverage | 5.08 | 11.50 |
| Asset Turnover | 0.39 | 1.57 |
| Fixed Asset Turnover | 11.81 | 10.91 |
| Payout ratio | 0 | 0 |
| Dividend yield | 0 | 0 |
| Fiscal Year | 2024 | 2024 |
Efficiency & Valuation Duel: The Vital Signs
Financial ratios act as a company’s DNA, exposing hidden risks and operational strengths that shape investor confidence.
Trimble Inc.
Trimble posts a strong 26.2% ROE and a robust 40.8% net margin, signaling excellent profitability. Its P/E of 11.5 suggests the stock trades at a reasonable valuation. However, a low 4.5% ROIC versus a 10.7% WACC signals capital efficiency concerns. Trimble forgoes dividends, reinvesting heavily in R&D to fuel growth.
Sanmina Corporation
Sanmina shows moderate profitability with a 10.5% ROE and a slim 3.0% net margin. The stock appears expensive at a 25.6 P/E, despite a decent 9.0% ROIC near its 8.4% WACC. Sanmina maintains a strong liquidity profile and focuses on steady cash flow but does not pay dividends, directing funds toward operational improvements.
Balanced Operational Strength vs. Growth Valuation
Trimble offers superior profitability and a more attractive valuation, though capital returns lag its cost of capital. Sanmina demonstrates solid asset turnover and liquidity but trades at a premium with weaker margins. Investors prioritizing operational excellence may favor Trimble; those seeking growth potential might lean toward Sanmina’s profile.
Which one offers the Superior Shareholder Reward?
I observe that neither Trimble Inc. (TRMB) nor Sanmina Corporation (SANM) pays dividends, signaling a reinvestment strategy over direct income distribution. TRMB’s free cash flow per share stands at roughly 2.03, with minimal capex and no dividend payout, emphasizing operational cash conversion and potential buybacks. SANM offers a more robust free cash flow per share near 8.58, yet its capex is higher, indicating heavier reinvestment. I note TRMB’s lack of aggressive buybacks and SANM’s moderate leverage and steady cash generation. SANM’s lower price-to-free-cash-flow ratio (~13.3) versus TRMB’s (~34.8) signals better valuation for cash returns. Given these factors, I find SANM’s capital allocation and free cash flow generation offer a more attractive total shareholder return profile in 2026.
Comparative Score Analysis: The Strategic Profile
The radar chart reveals the fundamental DNA and trade-offs of both firms, highlighting their financial strengths and vulnerabilities:
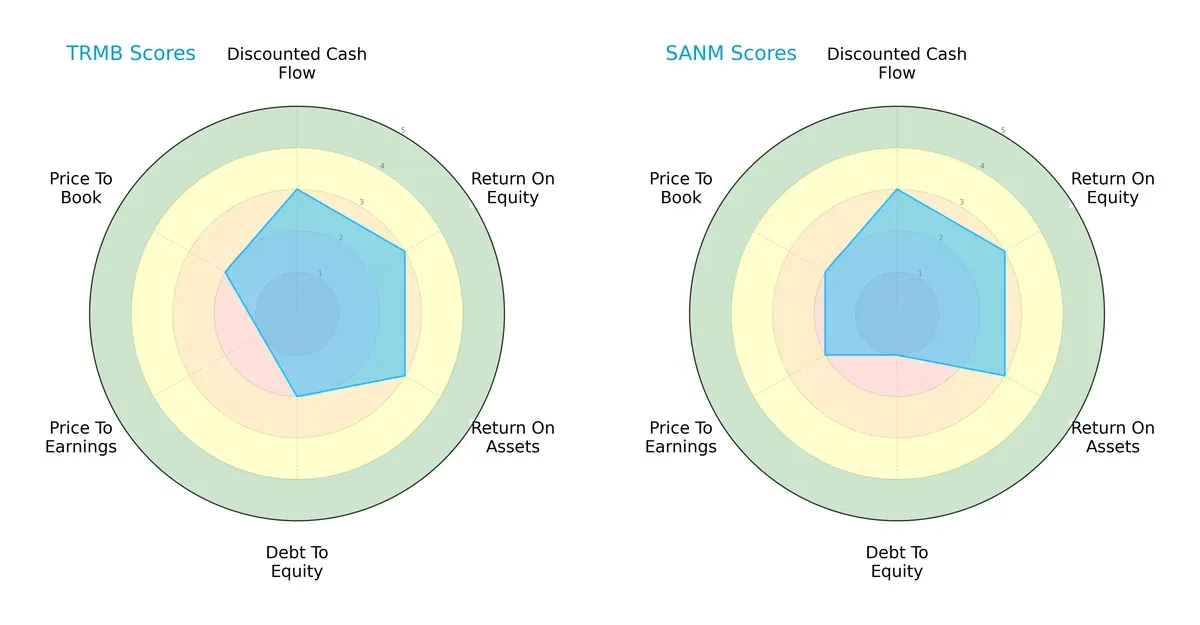
Trimble Inc. and Sanmina Corporation share identical scores in DCF, ROE, and ROA, reflecting similar operational efficiency and cash flow potential. Trimble edges Sanmina in debt-to-equity with a moderate score (2 vs. 1), indicating stronger balance sheet discipline. However, Trimble’s valuation metrics lag, scoring very unfavorable on P/E and moderate on P/B, suggesting potential overvaluation risks. Sanmina’s better P/E score signals a more attractive price relative to earnings. Overall, Trimble presents a more balanced financial profile, while Sanmina leans on valuation attractiveness but carries higher leverage risk.
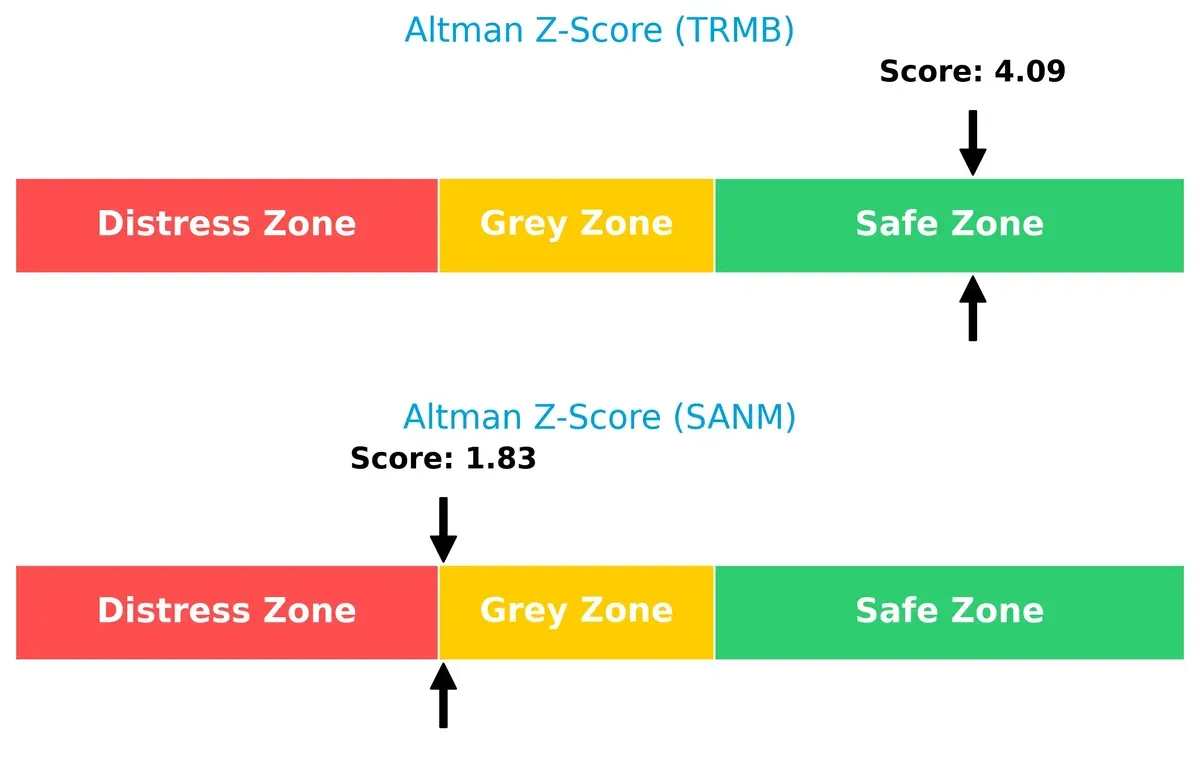
Bankruptcy Risk: Solvency Showdown
Trimble’s Altman Z-Score of 4.09 places it firmly in the safe zone, implying strong solvency and low bankruptcy risk. Sanmina’s 1.83 score sits at the edge of the grey zone, signaling moderate risk and financial vulnerability in turbulent markets:
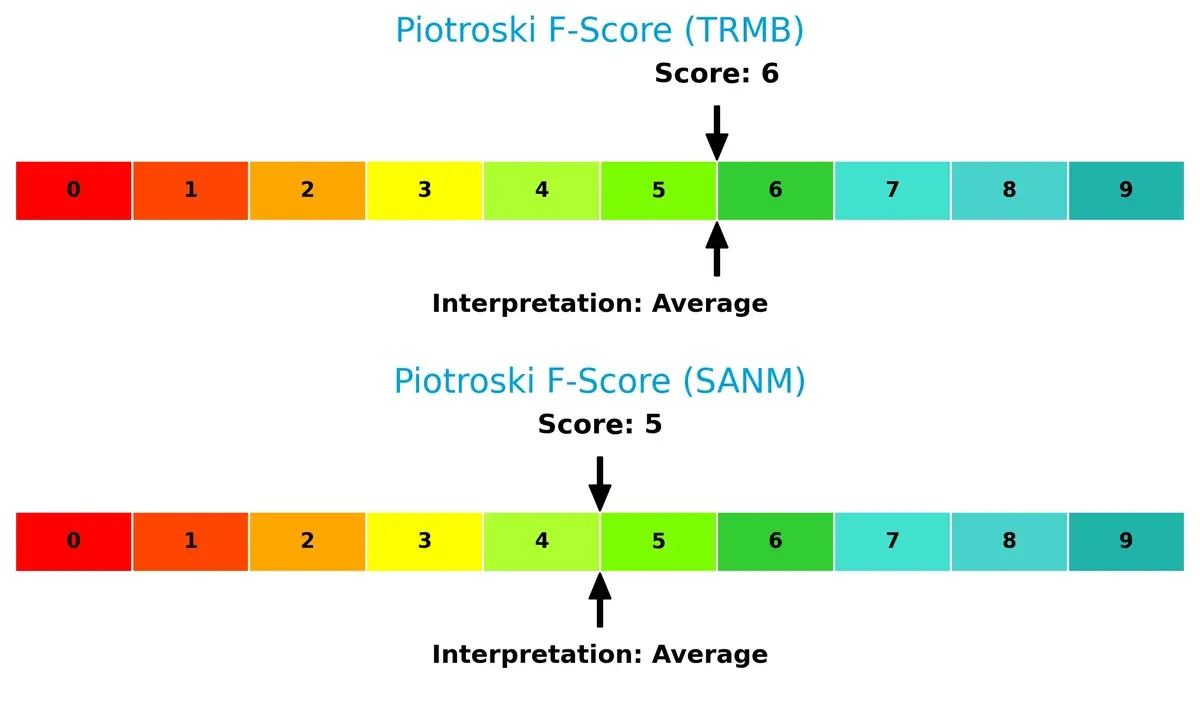
Financial Health: Quality of Operations
Both companies register average Piotroski F-Scores (Trimble 6, Sanmina 5), indicating decent but not peak financial health. Neither exhibits immediate red flags, but Sanmina’s slightly weaker internal metrics warrant caution:
How are the two companies positioned?
This section dissects the operational DNA of TRMB and SANM by comparing their revenue distribution and internal dynamics. The goal is to confront their economic moats to identify which model offers the most resilient, sustainable competitive advantage today.
Revenue Segmentation: The Strategic Mix
This comparison visualizes how Trimble Inc. and Sanmina Corporation diversify their revenue streams and highlights each firm’s primary sector focus:
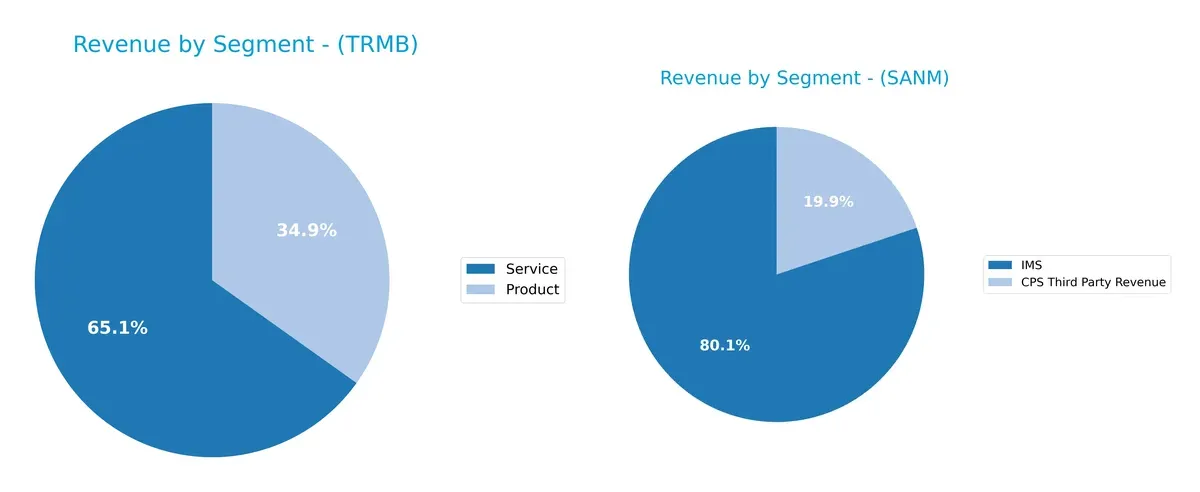
Trimble shows a balanced split between Product ($1.28B) and Service ($2.40B) in 2024, reflecting a diversified approach. Sanmina, in contrast, anchors 2025 revenue heavily in IMS ($6.51B) with less from CPS Third Party ($1.62B), signaling concentration risk but strong infrastructure dominance. Trimble’s varied segments reduce volatility, while Sanmina’s reliance on IMS drives scale but demands ecosystem lock-in.
Strengths and Weaknesses Comparison
This table compares the Strengths and Weaknesses of Trimble Inc. and Sanmina Corporation:
Trimble Inc. Strengths
- High net margin at 40.84%
- Strong ROE of 26.18%
- Favorable debt metrics with DE 0.26
- Diverse product and service revenue streams
- Solid presence in North America and Europe
- Favorable fixed asset turnover at 11.81
Sanmina Corporation Strengths
- Favorable current and quick ratios above 1.0
- Low debt-to-assets at 6.73%
- Strong interest coverage at 80.01
- Higher asset turnover at 1.39
- Significant Americas revenue at 4.65B
- Balanced global presence with Asia Pacific and EMEA sales
Trimble Inc. Weaknesses
- ROIC at 4.49% below WACC at 10.74%
- Asset turnover low at 0.39
- Unfavorable PB ratio at 3.02
- No dividend yield
- Market concentration in North America and Europe
- Unfavorable PE of 11.52 relative to sector
Sanmina Corporation Weaknesses
- Low net margin at 3.03%
- Neutral ROIC and WACC around 9% and 8.41%
- Unfavorable high PE ratio at 25.59
- No dividend yield
- Slightly less diversified revenue streams
- Higher proportion of sales in Americas
Both companies demonstrate financial and operational strengths with distinct focuses. Trimble excels in profitability and diversified revenue segments but faces challenges in capital efficiency and valuation metrics. Sanmina shows operational efficiency and strong liquidity but struggles with profitability and valuation concerns. Each company’s strategy must address these factors to improve competitive positioning.
The Moat Duel: Analyzing Competitive Defensibility
A structural moat is the only reliable shield protecting long-term profits from relentless competitive erosion. Let’s dissect the moats of two tech hardware firms:
Trimble Inc. (TRMB): Intangible Assets and Integrated Solutions Moat
Trimble leverages its software and hardware integration to deliver high-margin, sticky solutions. Despite a strong 40.8% net margin, its declining ROIC signals weakening capital efficiency in 2026. Expansion into precision agriculture and transportation tech could deepen its moat if execution improves.
Sanmina Corporation (SANM): Cost Advantage and Scale Moat
Sanmina’s moat stems from its scale in integrated manufacturing and supply chain services, supporting narrow margins around 3%. Its ROIC slightly trails WACC, indicating modest value destruction. Growth in diversified sectors like defense and cloud manufacturing offers upside but faces margin pressures.
Verdict: Intangible Assets Moat vs. Scale Cost Advantage
Trimble’s intangible asset moat, reflected in superior margins, is deeper but currently under strain from declining ROIC. Sanmina’s cost advantage is wider in scale but lacks profitability strength. Trimble remains better positioned to defend market share if it reverses capital inefficiencies.
Which stock offers better returns?
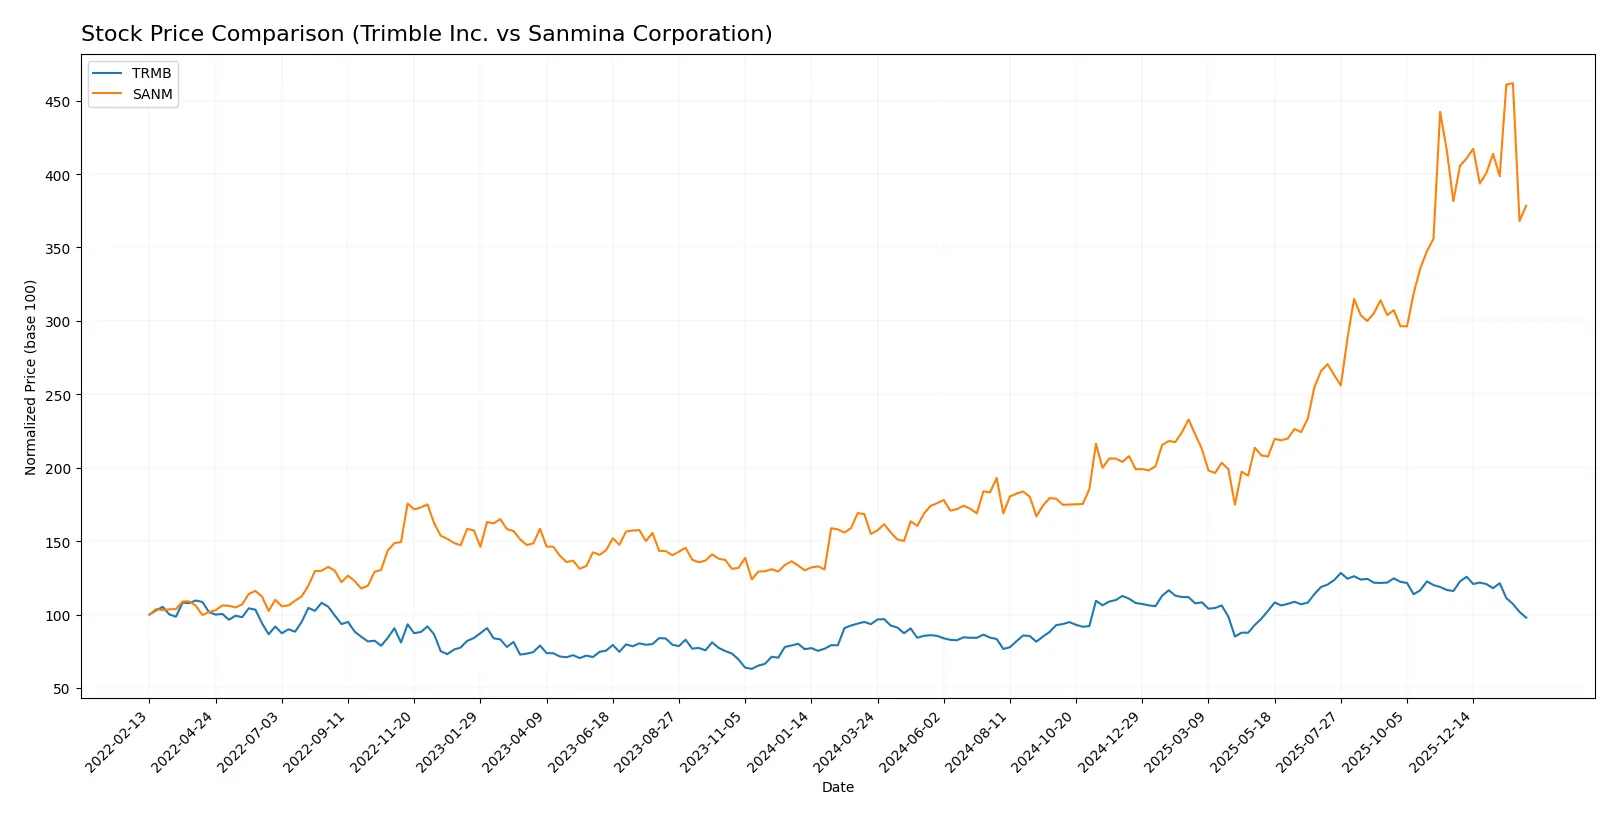
Over the past year, both Trimble Inc. and Sanmina Corporation showed marked price movements. Trimble’s modest gains contrast sharply with Sanmina’s substantial surge, reflecting distinct trading dynamics and investor interest.
Trend Comparison
Trimble Inc. posted a 4.78% price increase over the past 12 months, indicating a bullish but decelerating trend. Its price fluctuated between $50.86 and $85.24 with moderate volatility (std dev 9.69).
Sanmina Corporation surged 144.41% over the same period, also bullish with deceleration. Price ranged from $57.79 to $177.83 amid higher volatility (std dev 32.15).
Sanmina outperformed Trimble significantly, delivering the highest market returns on a 12-month basis according to the provided data.
Target Prices
Analysts set firm target price ranges reflecting a cautiously optimistic outlook for these technology hardware companies.
| Company | Target Low | Target High | Consensus |
|---|---|---|---|
| Trimble Inc. | 94 | 102 | 98.2 |
| Sanmina Corporation | 200 | 200 | 200 |
Trimble’s consensus target of 98.2 suggests a significant upside potential from its current 65.04 price, signaling strong growth expectations. Sanmina’s target at 200 also indicates nearly 37% upside, reflecting robust confidence despite recent price weakness.

Don’t Let Luck Decide Your Entry Point
Optimize your entry points with our advanced ProRealTime indicators. You’ll get efficient buy signals with precise price targets for maximum performance. Start outperforming now!
How do institutions grade them?
Trimble Inc. Grades
The following table summarizes recent grades from reputable institutions for Trimble Inc.:
| Grading Company | Action | New Grade | Date |
|---|---|---|---|
| Barclays | Maintain | Overweight | 2026-01-12 |
| Keybanc | Upgrade | Overweight | 2025-12-16 |
| Piper Sandler | Maintain | Overweight | 2025-11-07 |
| JP Morgan | Maintain | Overweight | 2025-09-19 |
| JP Morgan | Maintain | Overweight | 2025-08-07 |
| Oppenheimer | Maintain | Outperform | 2025-08-07 |
| Raymond James | Maintain | Outperform | 2025-08-07 |
| Oppenheimer | Maintain | Outperform | 2025-07-17 |
| JP Morgan | Maintain | Overweight | 2025-07-10 |
| JP Morgan | Maintain | Overweight | 2025-05-14 |
Sanmina Corporation Grades
Below are recent grades from established grading firms for Sanmina Corporation:
| Grading Company | Action | New Grade | Date |
|---|---|---|---|
| Argus Research | Maintain | Buy | 2026-01-28 |
| B of A Securities | Maintain | Neutral | 2025-07-11 |
| B of A Securities | Maintain | Neutral | 2025-06-09 |
| B of A Securities | Upgrade | Neutral | 2025-01-29 |
| Craig-Hallum | Maintain | Hold | 2024-11-05 |
| Craig-Hallum | Downgrade | Hold | 2024-04-30 |
| Sidoti & Co. | Upgrade | Buy | 2022-11-08 |
| Sidoti & Co. | Upgrade | Buy | 2022-11-07 |
| Sidoti & Co. | Downgrade | Neutral | 2022-10-31 |
| Sidoti & Co. | Downgrade | Neutral | 2022-10-30 |
Which company has the best grades?
Trimble Inc. consistently receives overweight and outperform ratings, signaling strong analyst confidence. Sanmina’s grades fluctuate between buy, neutral, and hold, showing more mixed sentiment. Investors may perceive Trimble as having a more positive institutional outlook.
Risks specific to each company
The following categories identify critical pressure points and systemic threats facing Trimble Inc. and Sanmina Corporation in the 2026 market environment:
1. Market & Competition
Trimble Inc.
- Faces intense competition in tech hardware with pressure on innovation and pricing.
Sanmina Corporation
- Competes in integrated manufacturing with diverse clients but faces margin pressure and tech shifts.
2. Capital Structure & Debt
Trimble Inc.
- Low debt-to-equity (0.26) and strong interest coverage (23.12) signal manageable leverage.
Sanmina Corporation
- Even lower debt-to-equity (0.17) and very high interest coverage (80.01) indicate conservative balance sheet.
3. Stock Volatility
Trimble Inc.
- Beta of 1.576 suggests higher volatility than market, increasing investment risk.
Sanmina Corporation
- Beta of 1.027 aligns with market volatility, offering more stability for investors.
4. Regulatory & Legal
Trimble Inc.
- Operates globally; regulatory shifts in technology and data privacy could impact costs.
Sanmina Corporation
- Exposure to defense and aerospace sectors heightens risk from compliance and export controls.
5. Supply Chain & Operations
Trimble Inc.
- Relies on complex supply chains for tech components; disruption risks persist in global trade.
Sanmina Corporation
- Faces supply chain pressures in manufacturing and logistics but benefits from vertical integration.
6. ESG & Climate Transition
Trimble Inc.
- Increasing demand for sustainable tech solutions but must enhance ESG disclosures to meet investor expectations.
Sanmina Corporation
- Needs to address environmental impact in manufacturing and align with rising ESG standards.
7. Geopolitical Exposure
Trimble Inc.
- Moderate exposure to global markets; geopolitical tensions could affect sales and supply.
Sanmina Corporation
- High exposure via defense contracts and global production footprint increases geopolitical risk.
Which company shows a better risk-adjusted profile?
Trimble’s key risk is elevated stock volatility and moderate leverage despite solid interest coverage. Sanmina’s primary concern is geopolitical exposure and margin pressure amid complex manufacturing. Trimble’s Altman Z-score (4.09) places it safely above distress, while Sanmina’s score (1.83) signals moderate financial risk. I see Trimble offering a better risk-adjusted profile due to stronger financial stability and lower operational risk, despite higher market volatility.
Final Verdict: Which stock to choose?
Trimble Inc. impresses with its superpower: operational efficiency that drives strong profitability and cash flow generation. However, its declining ROIC relative to WACC signals a value destruction risk, which calls for vigilance. This stock suits investors targeting aggressive growth tempered by strategic discipline.
Sanmina Corporation’s strategic moat lies in its asset-light model and robust liquidity, supporting steady returns despite modest margins. Its superior safety profile and healthier balance sheet offer better stability compared to Trimble. Sanmina fits well in GARP portfolios seeking growth with reasonable risk exposure.
If you prioritize aggressive expansion and operational excellence, Trimble outshines with higher margins and cash flow strength, albeit with some value creation concerns. However, if you seek better financial stability and a conservative growth trajectory, Sanmina offers a safer harbor with a more balanced capital structure. Each presents a distinct analytical scenario for different investor profiles.
Disclaimer: Investment carries a risk of loss of initial capital. The past performance is not a reliable indicator of future results. Be sure to understand risks before making an investment decision.
Go Further
I encourage you to read the complete analyses of Trimble Inc. and Sanmina Corporation to enhance your investment decisions: