Home > Comparison > Technology > TDY vs SANM
The strategic rivalry between Teledyne Technologies Incorporated and Sanmina Corporation defines the current trajectory of the technology hardware sector. Teledyne operates as a diversified industrial tech leader focusing on advanced instrumentation and aerospace electronics. Sanmina specializes in integrated manufacturing and supply chain solutions with a broader operational scale. This analysis evaluates which company’s distinct model delivers superior risk-adjusted returns for a diversified portfolio in 2026.
Table of contents
Companies Overview
Teledyne Technologies and Sanmina Corporation both anchor critical segments within the hardware and equipment sector, shaping industrial and technological landscapes.
Teledyne Technologies Incorporated: Enabling Industrial Growth with Precision Instruments
Teledyne Technologies dominates the industrial instrumentation market, generating revenue through advanced sensors, digital imaging, aerospace electronics, and engineered systems. Its 2026 strategy emphasizes expanding technological integration in defense, environmental monitoring, and medical applications. This focus drives innovation in high-precision measurement and communication devices, reinforcing its leadership in complex, mission-critical solutions.
Sanmina Corporation: Integrated Manufacturing Powerhouse
Sanmina leads in integrated manufacturing solutions, delivering end-to-end services from design to after-market support. Revenue stems from producing components, assemblies, and systems for diverse sectors like medical, aerospace, and cloud computing. In 2026, Sanmina prioritizes scaling its supply chain capabilities and enhancing product industrialization to meet rising demand for custom, high-complexity manufacturing services worldwide.
Strategic Collision: Similarities & Divergences
Both firms compete in hardware and equipment but diverge sharply: Teledyne pursues specialized technology development, while Sanmina focuses on scalable manufacturing integration. Their battleground centers on delivering high-value, precision components to the industrial and defense sectors. Investors face contrasting profiles—Teledyne offers innovation-driven growth, whereas Sanmina presents operational scale and manufacturing breadth.
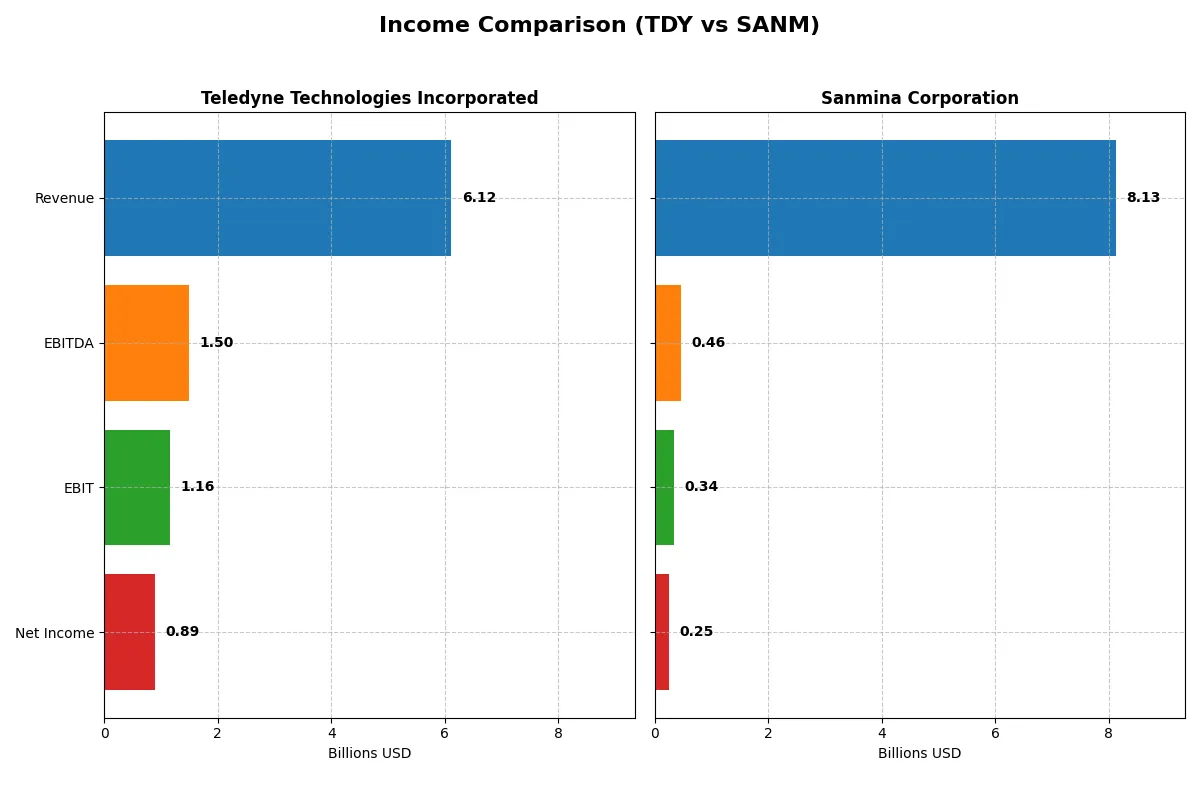
Income Statement Comparison
This data dissects the core profitability and scalability of both corporate engines to reveal who dominates the bottom line:
| Metric | Teledyne Technologies (TDY) | Sanmina Corporation (SANM) |
|---|---|---|
| Revenue | 6.12B | 8.13B |
| Cost of Revenue | 3.72B | 7.41B |
| Operating Expenses | 1.25B | 362M |
| Gross Profit | 2.40B | 716M |
| EBITDA | 1.50B | 463M |
| EBIT | 1.16B | 344M |
| Interest Expense | 60M | 4.3M |
| Net Income | 895M | 246M |
| EPS | 18.88 | 4.56 |
| Fiscal Year | 2025 | 2025 |
Income Statement Analysis: The Bottom-Line Duel
This income statement comparison unveils how efficiently each company converts revenue into profit over recent years.
Teledyne Technologies Incorporated Analysis
Teledyne’s revenue grew steadily from $4.6B in 2021 to $6.1B in 2025, nearly doubling net income to $895M. Its gross margin hovers around a strong 39%, while net margin improved to 14.6% in 2025, reflecting robust operational efficiency and solid momentum in profitability and EPS growth.
Sanmina Corporation Analysis
Sanmina’s revenue increased from $6.7B in 2021 to $8.1B in 2025, but net income declined slightly to $246M. Gross margin remains low at 8.8%, with a net margin of 3%. Despite revenue growth, the company faces margin pressure and flat EBIT, signaling challenges in converting sales into profits.
Margin Strength vs. Revenue Expansion
Teledyne dominates with superior margin expansion and nearly 101% net income growth over five years, while Sanmina’s modest revenue gains come with shrinking profitability. For investors prioritizing earnings quality and margin resilience, Teledyne’s profile offers a clearer fundamental advantage.
Financial Ratios Comparison
These vital ratios act as a diagnostic tool to expose the underlying fiscal health, valuation premiums, and capital efficiency of the companies compared below:
| Ratios | Teledyne Technologies (TDY) | Sanmina Corporation (SANM) |
|---|---|---|
| ROE | 8.5% | 10.4% |
| ROIC | 6.8% | 9.0% |
| P/E | 27.3 | 25.6 |
| P/B | 2.33 | 2.67 |
| Current Ratio | 1.64 | 1.72 |
| Quick Ratio | 1.08 | 1.02 |
| D/E (Debt-to-Equity) | 0.24 | 0.17 |
| Debt-to-Assets | 16.2% | 6.7% |
| Interest Coverage | 19.3 | 82.5 |
| Asset Turnover | 0.40 | 1.39 |
| Fixed Asset Turnover | 7.29 | 11.91 |
| Payout Ratio | 0 | 0 |
| Dividend Yield | 0% | 0% |
| Fiscal Year | 2025 | 2025 |
Efficiency & Valuation Duel: The Vital Signs
Ratios act as a company’s DNA, revealing hidden risks and operational excellence that drive investor decisions and long-term value creation.
Teledyne Technologies Incorporated
Teledyne shows solid net margins at 14.63%, but an ROE of 8.51% lags behind industry expectations. Its P/E ratio of 27.35 signals a stretched valuation. The company maintains favorable liquidity and low leverage, yet offers no dividend, instead reinvesting in R&D to fuel growth and innovation.
Sanmina Corporation
Sanmina posts a lower net margin of 3.03% but a stronger ROE of 10.45%, reflecting more efficient equity use. Its P/E at 25.59 also appears stretched relative to earnings quality. Sanmina features robust asset turnover and excellent interest coverage, with no dividend payout, focusing capital on operational expansion and cash flow generation.
Premium Valuation vs. Operational Safety
Both companies present slightly favorable overall ratios, yet Teledyne’s higher margins contrast with its weaker ROE and stretched valuation. Sanmina balances efficient capital use with better asset turnover and stronger coverage metrics. Investors prioritizing operational safety may lean toward Sanmina, while those betting on growth reinvestment might consider Teledyne.
Which one offers the Superior Shareholder Reward?
I compare Teledyne Technologies Incorporated (TDY) and Sanmina Corporation (SANM) on distribution strategies. Neither pays dividends, so returns rely heavily on share buybacks and reinvestment. TDY’s free cash flow per share stands at 22.7, with a robust buyback implied by zero dividend payout and strong cash flow. SANM’s free cash flow per share is lower at 8.6, but it trades at a significantly cheaper price-to-earnings ratio (around 17 vs. TDY’s 27), signaling potential value. TDY’s margin superiorities (net margin ~14.6% vs. SANM’s ~3%) and sustainable capital allocation into growth and buybacks create a long-term moat. SANM’s higher leverage and lower profitability constrain its shareholder reward despite cheaper valuation. I conclude TDY offers a more attractive total return profile for disciplined investors in 2026, balancing growth, margin quality, and shareholder distributions.
Comparative Score Analysis: The Strategic Profile
The radar chart reveals the fundamental DNA and trade-offs of both Teledyne Technologies and Sanmina Corporation, highlighting their financial strengths and vulnerabilities:
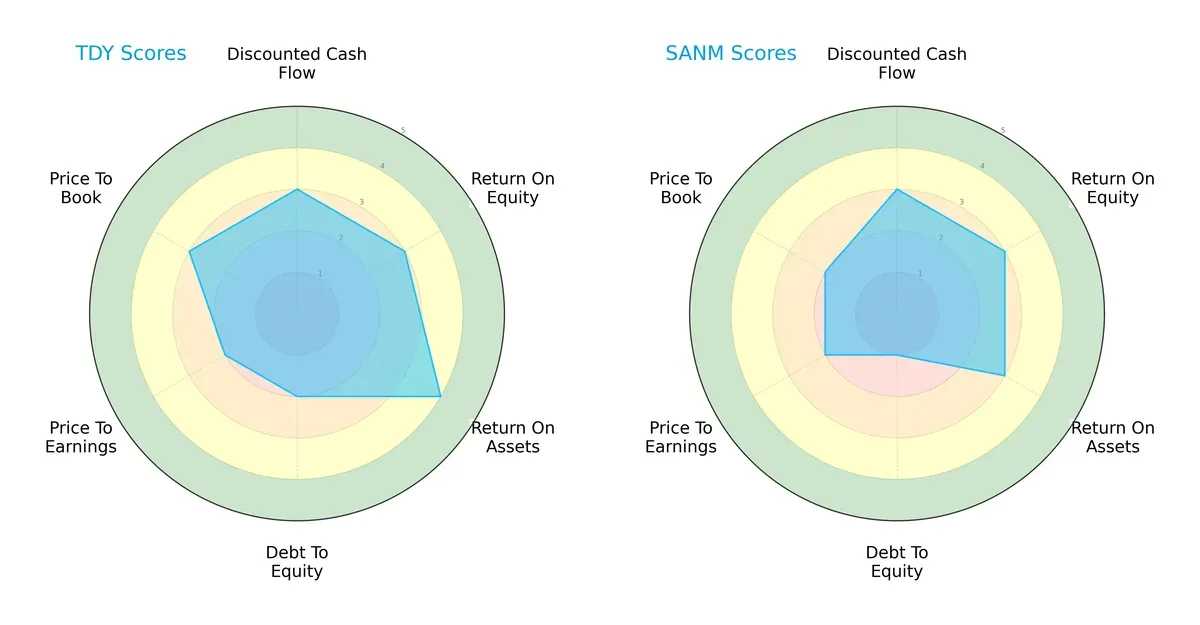
Teledyne shows a balanced profile with a strong ROA score of 4, indicating efficient asset use. Sanmina shares similar DCF and ROE scores but lags in debt management, scoring only 1 on debt-to-equity, signaling higher financial risk. Teledyne’s valuation metrics also appear more favorable, giving it an edge in stability and moderate growth potential.
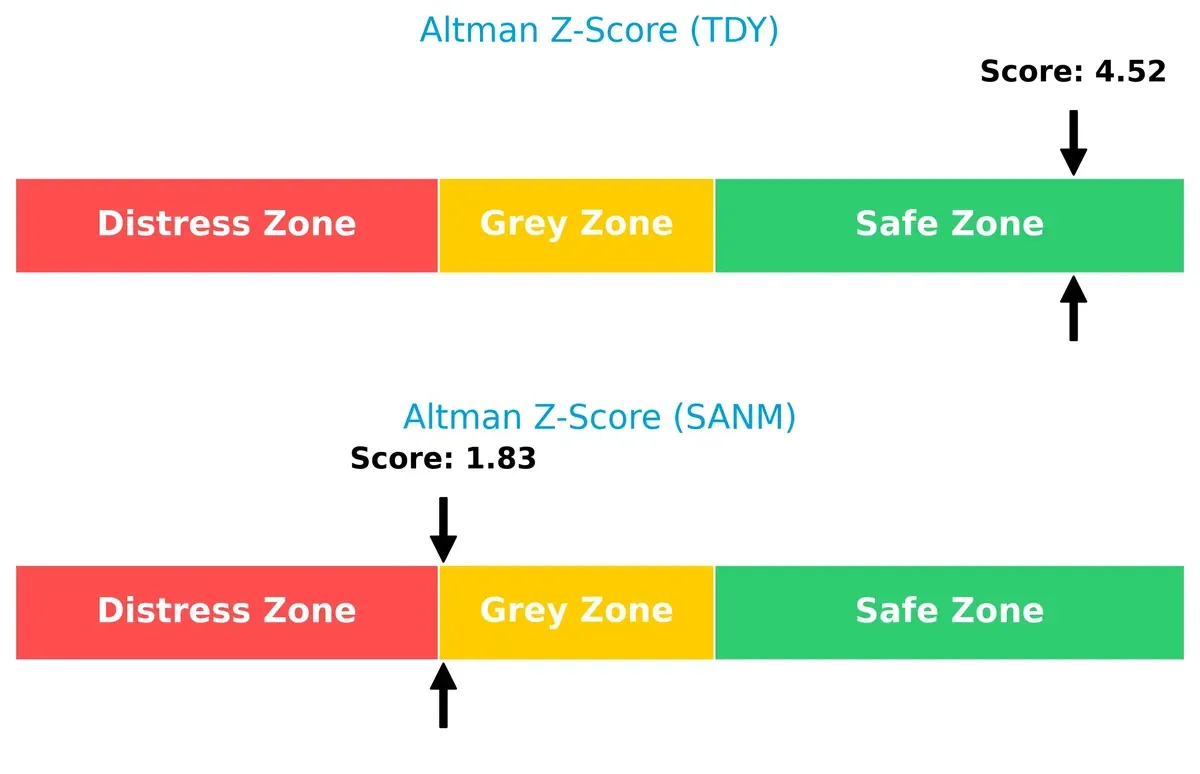
Bankruptcy Risk: Solvency Showdown
Teledyne’s Altman Z-Score of 4.52 places it firmly in the safe zone, whereas Sanmina’s 1.83 sits in the grey zone, signaling elevated bankruptcy risk in a challenging market cycle:
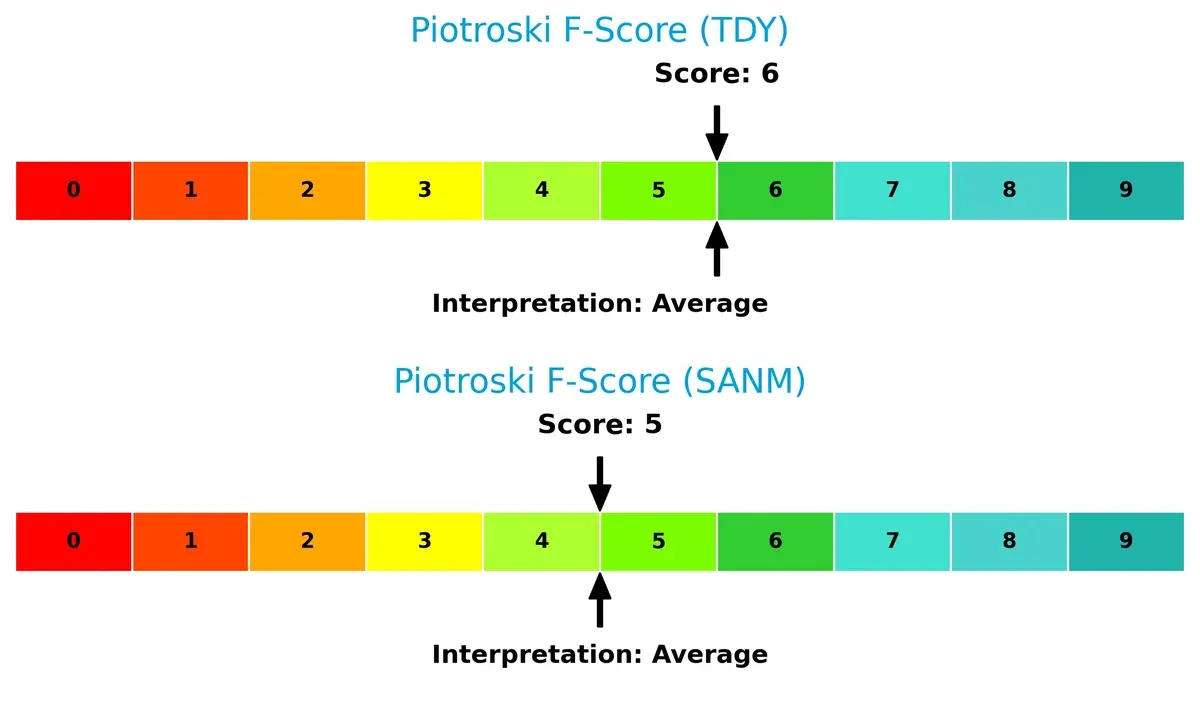
Financial Health: Quality of Operations
Teledyne and Sanmina both show average Piotroski F-Scores, with 6 and 5 respectively, suggesting moderate financial health. Neither firm displays acute red flags, but Teledyne maintains a slight advantage in operational quality:
How are the two companies positioned?
This section dissects the operational DNA of TDY and SANM by comparing their revenue distribution and internal dynamics. The goal is to confront their economic moats and identify which model offers the most resilient, sustainable advantage today.
Revenue Segmentation: The Strategic Mix
This visual comparison dissects how Teledyne Technologies and Sanmina diversify their income streams and highlights their primary sector bets:
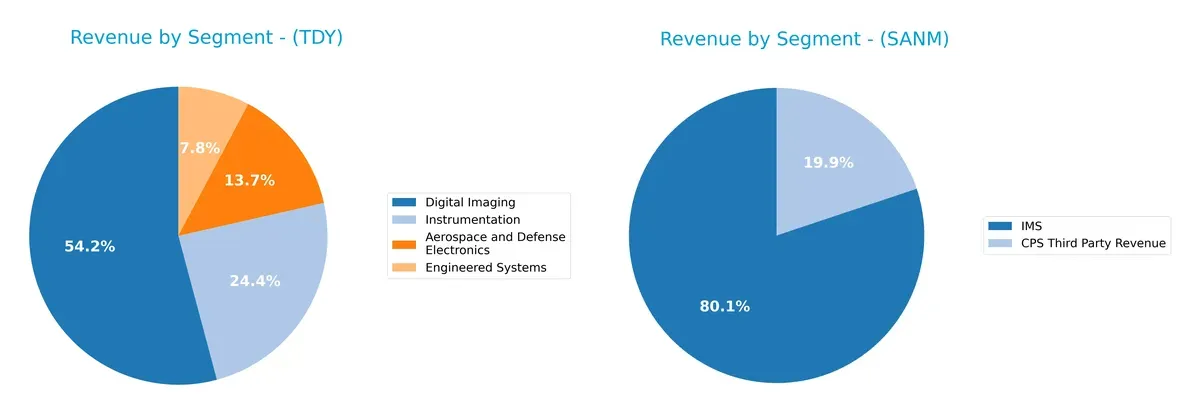
Teledyne anchors its revenue in Digital Imaging with $3.07B, supported by Instrumentation ($1.38B) and Aerospace & Defense ($777M). Sanmina pivots heavily on IMS at $6.51B, dwarfing CPS Third Party Revenue at $1.61B. Teledyne’s more balanced mix reduces concentration risk, while Sanmina’s reliance on IMS signals a focused ecosystem dominance but heightened segment dependency.
Strengths and Weaknesses Comparison
This table compares the strengths and weaknesses of Teledyne Technologies Incorporated and Sanmina Corporation:
Teledyne Technologies Incorporated Strengths
- Diverse revenue streams across Aerospace, Digital Imaging, Engineered Systems, and Instrumentation
- Strong profitability with a 14.63% net margin
- Solid liquidity ratios (current 1.64, quick 1.08)
- Low leverage (D/E 0.24)
- Favorable interest coverage (19.47)
- Global presence with significant US, Europe, and Asia sales
Sanmina Corporation Strengths
- High asset turnover (1.39) and fixed asset turnover (11.91) indicate efficient asset use
- Strong interest coverage (80.01) and low debt (D/E 0.17)
- Balanced geographic exposure across Americas, Asia Pacific, and EMEA
- Moderately favorable profitability metrics with ROIC 9.04%
- Consistent revenue in IMS and CPS segments
Teledyne Technologies Incorporated Weaknesses
- Below WACC ROIC (6.78% vs 8.21%) signals weak capital returns
- Low ROE at 8.51%
- Unfavorable P/E at 27.35 compared to peers
- Asset turnover low at 0.4 reduces operational efficiency
- No dividend yield
- Moderate unfavorable ratios (28.57% of key metrics)
Sanmina Corporation Weaknesses
- Low net margin at 3.03% highlights profitability challenges
- Unfavorable P/E at 25.59
- No dividend yield
- Slightly higher WACC (8.41%) vs ROIC
- Some neutral profitability ratios
Both companies demonstrate solid liquidity and low leverage, supporting financial stability. Teledyne’s diversified product lines and superior profitability contrast with Sanmina’s operational efficiency and geographic balance. However, both face challenges in delivering strong returns on equity and offer no dividends, impacting income-focused investors. These dynamics shape their strategic priorities in capital allocation and growth.
The Moat Duel: Analyzing Competitive Defensibility
A structural moat is the only reliable barrier protecting long-term profits from relentless competition erosion. Let’s examine the sources of durability for two industry players:
Teledyne Technologies Incorporated: Diversified Technology Moat
Teledyne leverages intangible assets and technological integration across aerospace and industrial markets. Its rising ROIC trend signals improving capital efficiency despite current value shedding. Expansion into defense and imaging deepens its moat in 2026.
Sanmina Corporation: Cost-Driven Manufacturing Moat
Sanmina depends on a cost advantage through scale in integrated manufacturing solutions. Unlike Teledyne, its ROIC declines and margins remain thin, exposing vulnerability. Growth hinges on expanding cloud-based manufacturing services and emerging tech adoption.
Verdict: Technological Integration vs. Scale Efficiency
Teledyne’s widening ROIC and diversified tech portfolio create a deeper moat than Sanmina’s shrinking capital returns and narrow cost focus. I see Teledyne better positioned to defend market share against competitive pressure in 2026.
Which stock offers better returns?
The past year reveals strong upward price movements with distinct trading dynamics between Teledyne Technologies and Sanmina Corporation.
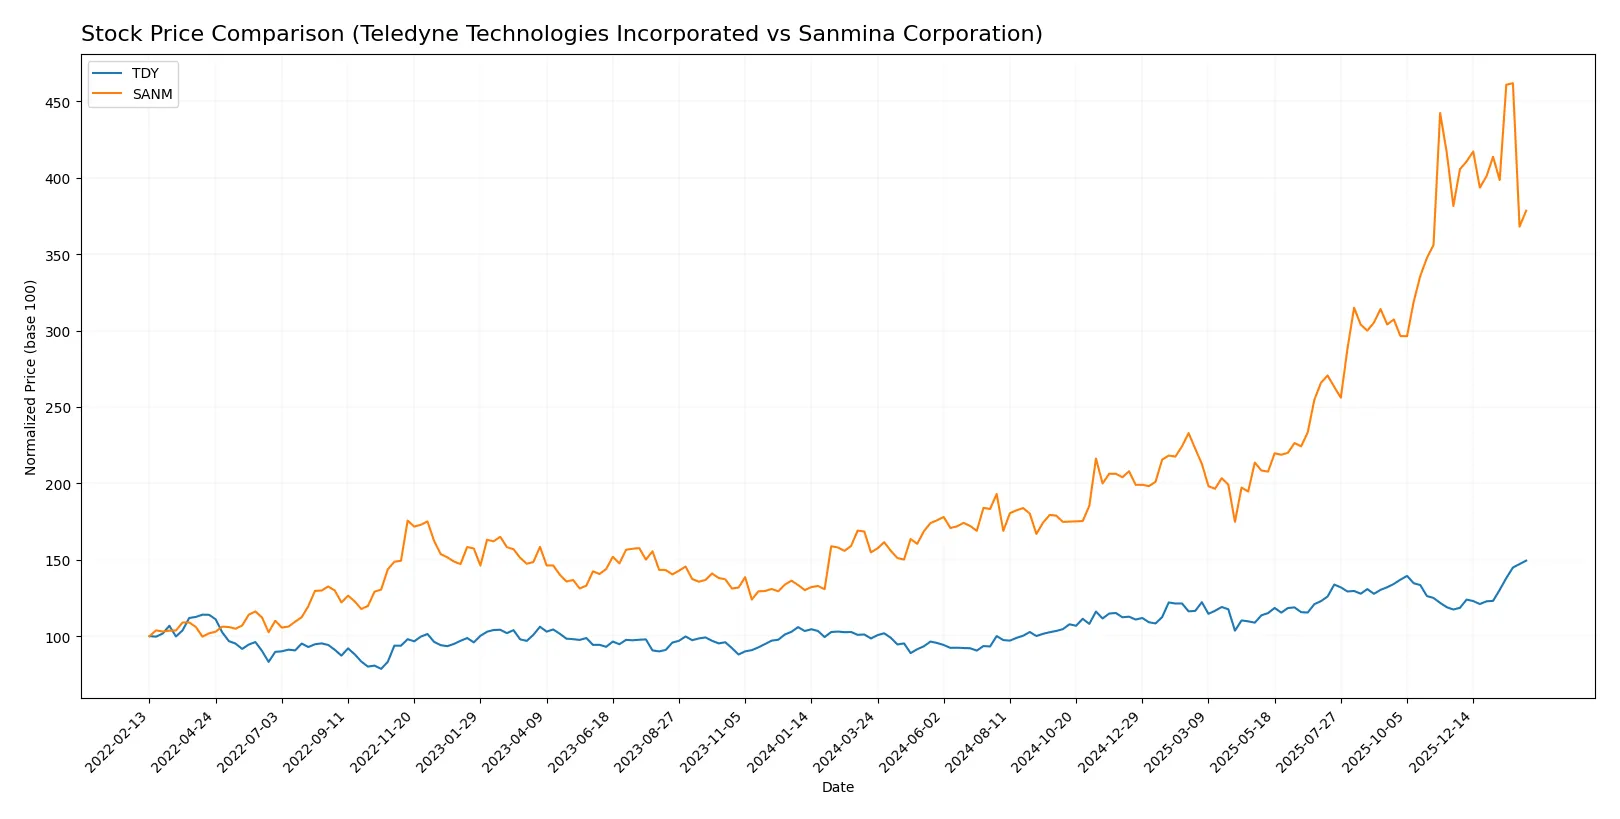
Trend Comparison
Teledyne Technologies (TDY) shows a 51.7% price increase over 12 months, confirming a bullish trend with accelerating momentum and high volatility, hitting a peak of 629.73.
Sanmina Corporation (SANM) surged 144.41% over the same period, indicating a bullish but decelerating trend, with lower volatility and a high of 177.83; recent weeks show near-neutral movement.
SANM outperformed TDY overall despite deceleration, delivering the highest market gains, while TDY maintained acceleration but with less total appreciation.
Target Prices
Analysts present a confident consensus on target prices for Teledyne Technologies Incorporated and Sanmina Corporation.
| Company | Target Low | Target High | Consensus |
|---|---|---|---|
| Teledyne Technologies Incorporated | 599 | 720 | 638.5 |
| Sanmina Corporation | 200 | 200 | 200 |
Teledyne’s consensus target price sits slightly above its current price of 630, signaling modest upside potential. Sanmina’s target at 200 implies strong growth expectations from its current 146.

Don’t Let Luck Decide Your Entry Point
Optimize your entry points with our advanced ProRealTime indicators. You’ll get efficient buy signals with precise price targets for maximum performance. Start outperforming now!
How do institutions grade them?
Teledyne Technologies Incorporated Grades
The following table summarizes recent institutional grades for Teledyne Technologies Incorporated:
| Grading Company | Action | New Grade | Date |
|---|---|---|---|
| Barclays | Maintain | Equal Weight | 2026-01-22 |
| Stifel | Maintain | Buy | 2026-01-22 |
| Needham | Maintain | Buy | 2026-01-22 |
| Citigroup | Maintain | Neutral | 2026-01-13 |
| Barclays | Maintain | Equal Weight | 2026-01-12 |
| Barclays | Maintain | Equal Weight | 2025-10-23 |
| Needham | Maintain | Buy | 2025-10-23 |
| Stifel | Maintain | Buy | 2025-10-23 |
| Morgan Stanley | Maintain | Equal Weight | 2025-10-15 |
| UBS | Maintain | Buy | 2025-07-24 |
Sanmina Corporation Grades
The following table summarizes recent institutional grades for Sanmina Corporation:
| Grading Company | Action | New Grade | Date |
|---|---|---|---|
| Argus Research | Maintain | Buy | 2026-01-28 |
| B of A Securities | Maintain | Neutral | 2025-07-11 |
| B of A Securities | Maintain | Neutral | 2025-06-09 |
| B of A Securities | Upgrade | Neutral | 2025-01-29 |
| Craig-Hallum | Maintain | Hold | 2024-11-05 |
| Craig-Hallum | Downgrade | Hold | 2024-04-30 |
| Sidoti & Co. | Upgrade | Buy | 2022-11-08 |
| Sidoti & Co. | Upgrade | Buy | 2022-11-07 |
| Sidoti & Co. | Downgrade | Neutral | 2022-10-31 |
| Sidoti & Co. | Downgrade | Neutral | 2022-10-30 |
Which company has the best grades?
Teledyne Technologies holds consistently stronger grades, with multiple Buy ratings from Stifel, Needham, and UBS. Sanmina’s ratings are more mixed, featuring Neutral and Hold grades. Investors may interpret Teledyne’s better grades as greater confidence from analysts.
Risks specific to each company
The following categories identify critical pressure points and systemic threats facing Teledyne Technologies Incorporated and Sanmina Corporation in the 2026 market environment:
1. Market & Competition
Teledyne Technologies Incorporated
- Strong niche in aerospace and defense but faces pressure from specialized competitors.
Sanmina Corporation
- Broad contract manufacturing scope with intense price competition in electronics.
2. Capital Structure & Debt
Teledyne Technologies Incorporated
- Low debt-to-equity of 0.24 signals prudent leverage and strong interest coverage.
Sanmina Corporation
- Even lower debt-to-equity at 0.17, but debt rating is very unfavorable due to financial risk concerns.
3. Stock Volatility
Teledyne Technologies Incorporated
- Beta near 1.01 indicates stock moves closely with the market, moderate volatility.
Sanmina Corporation
- Slightly higher beta at 1.03, reflecting modestly greater share price swings.
4. Regulatory & Legal
Teledyne Technologies Incorporated
- Aerospace exposure implies regulatory scrutiny and compliance risk in defense contracting.
Sanmina Corporation
- Diverse manufacturing sectors face varying regulatory environments, increasing complexity.
5. Supply Chain & Operations
Teledyne Technologies Incorporated
- Complex engineered systems supply chain vulnerable to component shortages.
Sanmina Corporation
- Extensive global manufacturing footprint exposes to logistics and supplier disruption risks.
6. ESG & Climate Transition
Teledyne Technologies Incorporated
- Moderate exposure, with opportunities in environmental monitoring tech but limited disclosure.
Sanmina Corporation
- Manufacturing processes face pressure to reduce emissions and improve sustainability metrics.
7. Geopolitical Exposure
Teledyne Technologies Incorporated
- Significant US defense contracts heighten risk from geopolitical tensions and budget shifts.
Sanmina Corporation
- Global operations concentrate risk in trade policies, tariffs, and international relations.
Which company shows a better risk-adjusted profile?
Teledyne’s most impactful risk lies in geopolitical exposure due to reliance on US defense spending. Sanmina’s key vulnerability is its financial risk flagged by a very unfavorable debt-to-equity score. Despite similar overall ratings, Teledyne’s stronger balance sheet and safer Altman Z-Score position it as the safer risk-adjusted choice. Notably, Sanmina’s Altman Z-Score near the grey zone signals elevated bankruptcy risk, underscoring caution.
Final Verdict: Which stock to choose?
Teledyne Technologies impresses with its unmatched operational efficiency and steady profitability growth. Its ability to generate strong free cash flow amid moderate leverage is a core strength. A point of vigilance remains its return on invested capital, which currently trails its cost of capital. Teledyne suits investors chasing aggressive growth with an appetite for moderate risk.
Sanmina’s strategic moat lies in its asset-light model and robust capital efficiency, evidenced by superior asset turnover and interest coverage. It offers a safer financial profile with lower leverage and strong liquidity compared to Teledyne. Sanmina fits well in portfolios focused on growth at a reasonable price, balancing growth potential with financial prudence.
If you prioritize operational efficiency and revenue growth acceleration, Teledyne outshines as the compelling choice due to its improving profitability and bullish price momentum. However, if you seek better stability and capital discipline, Sanmina offers superior financial safety and a more conservative risk profile. Both present slightly favorable prospects but address distinct investor appetites.
Disclaimer: Investment carries a risk of loss of initial capital. The past performance is not a reliable indicator of future results. Be sure to understand risks before making an investment decision.
Go Further
I encourage you to read the complete analyses of Teledyne Technologies Incorporated and Sanmina Corporation to enhance your investment decisions: