Home > Comparison > Technology > TEL vs SANM
The strategic rivalry between TE Connectivity Ltd. and Sanmina Corporation shapes the competitive landscape of the technology hardware sector. TE Connectivity operates as a diversified manufacturer of connectivity and sensor solutions with a global footprint. Sanmina specializes in integrated manufacturing solutions, focusing on precision components and supply chain services. This analysis will assess which business model offers superior risk-adjusted returns for a diversified portfolio amid evolving industry dynamics.
Table of contents
Companies Overview
TE Connectivity and Sanmina Corporation stand as key players in the hardware and equipment sector, each commanding critical market segments.
TE Connectivity Ltd.: Global Leader in Connectivity Solutions
TE Connectivity dominates as a global manufacturer of connectivity and sensor solutions. Its revenue stems from three segments: Transportation, Industrial, and Communications Solutions, serving automotive, aerospace, and data markets. In 2026, TE Connectivity’s strategic focus remains on expanding its portfolio in sensor technologies and high-reliability connectors across 140 countries.
Sanmina Corporation: Integrated Manufacturing Specialist
Sanmina Corporation specializes in integrated manufacturing solutions including design, assembly, and supply chain management. It generates revenue by delivering components, systems, and after-market services primarily to industrial, medical, aerospace, and communications clients. In 2026, Sanmina emphasizes enhancing cloud-based manufacturing execution and broadening its defense and aerospace product lines.
Strategic Collision: Similarities & Divergences
Both companies operate in hardware with a focus on complex components but diverge strategically: TE Connectivity pursues a product-driven, multi-segment approach; Sanmina prioritizes end-to-end manufacturing services. Their primary battleground lies in serving high-tech industrial and communications sectors. TE Connectivity offers a product moat, while Sanmina’s investment profile centers on operational integration and client customization.
Income Statement Comparison
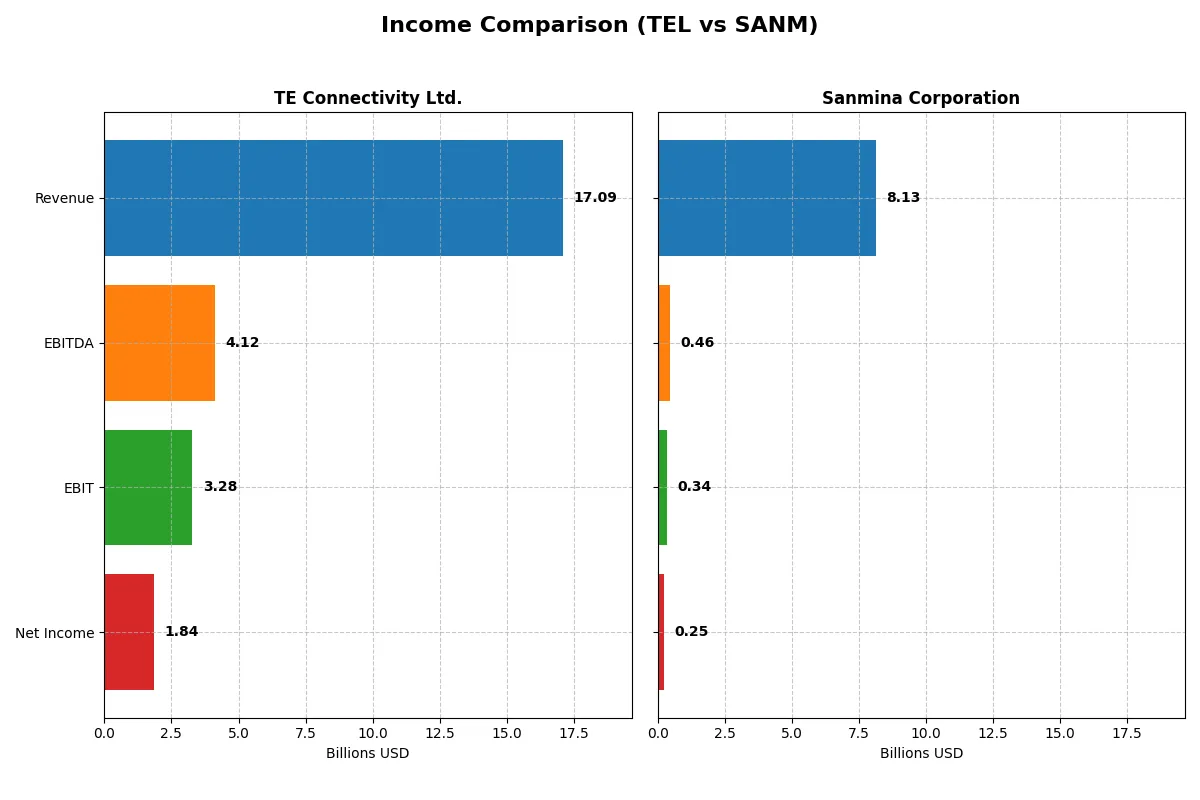
This data dissects the core profitability and scalability of both corporate engines to reveal who dominates the bottom line:
| Metric | TE Connectivity Ltd. (TEL) | Sanmina Corporation (SANM) |
|---|---|---|
| Revenue | 17.1B | 8.1B |
| Cost of Revenue | 11.2B | 7.4B |
| Operating Expenses | 2.7B | 362M |
| Gross Profit | 5.9B | 716M |
| EBITDA | 4.1B | 463M |
| EBIT | 3.3B | 344M |
| Interest Expense | 77M | 4.3M |
| Net Income | 1.8B | 246M |
| EPS | 6.2 | 4.56 |
| Fiscal Year | 2025 | 2025 |
Income Statement Analysis: The Bottom-Line Duel
This income statement comparison reveals which company converts revenue into profit more efficiently, spotlighting their corporate engines’ true strength.
TE Connectivity Ltd. Analysis
TE Connectivity’s revenue climbed steadily from 14.9B in 2021 to 17.1B in 2025, showing a solid 14.5% growth over five years. Gross margins remain robust near 34.6%, and EBIT margin at 19.2% signals strong operational control. Despite a 46.5% net margin drop in the latest year, TE sustains efficient cost management and rising operating profits, reflecting momentum amid margin pressures.
Sanmina Corporation Analysis
Sanmina’s revenue expanded by 20.6% over five years, reaching 8.1B in 2025. However, gross margin lingers at a modest 8.8% with EBIT margin at 4.2%, indicating tighter profitability. The company’s net margin hovers near 3%, showing limited bottom-line leverage. Sanmina’s EPS rose 14% last year, but EBIT declined slightly, suggesting mixed operational efficiency and margin challenges.
Margin Dominance vs. Revenue Expansion
TE Connectivity clearly outperforms on margins and operating efficiency, generating nearly double the EBIT margin of Sanmina. Sanmina boasts higher revenue growth but struggles to translate scale into profit. For investors, TE’s profile offers stronger margin power and cost discipline, while Sanmina presents a growth story with less profitability—key considerations depending on risk appetite.
Financial Ratios Comparison
These vital ratios act as a diagnostic tool to expose the underlying fiscal health, valuation premiums, and capital efficiency of the companies compared below:
| Ratios | TE Connectivity Ltd. (TEL) | Sanmina Corporation (SANM) |
|---|---|---|
| ROE | 14.6% | 10.4% |
| ROIC | 8.8% | 9.0% |
| P/E | 35.0 | 25.6 |
| P/B | 5.12 | 2.67 |
| Current Ratio | 1.56 | 1.72 |
| Quick Ratio | 1.03 | 1.02 |
| D/E | 0.52 | 0.17 |
| Debt-to-Assets | 26.1% | 6.7% |
| Interest Coverage | 41.7 | 82.5 |
| Asset Turnover | 0.68 | 1.39 |
| Fixed Asset Turnover | 3.96 | 11.9 |
| Payout ratio | 43.6% | 0% |
| Dividend yield | 1.25% | 0% |
| Fiscal Year | 2025 | 2025 |
Efficiency & Valuation Duel: The Vital Signs
Financial ratios serve as a company’s DNA, exposing hidden risks and operational strengths crucial for investment insight.
TE Connectivity Ltd.
TE Connectivity delivers solid profitability with a 14.6% ROE and a favorable 10.8% net margin, reflecting operational strength. However, its valuation appears stretched, with a high P/E of 35 and P/B at 5.12. The company rewards shareholders modestly via a 1.25% dividend yield, balancing returns with steady R&D investment.
Sanmina Corporation
Sanmina shows moderate profitability, posting a 10.5% ROE and a weak 3.0% net margin, signaling margin pressure. Its valuation is more reasonable, with a P/E of 25.6 and P/B of 2.67. Sanmina lacks dividends, instead reinvesting cash flow into growth, supported by strong asset turnover and favorable debt metrics.
Premium Valuation vs. Operational Safety
TE Connectivity commands a premium valuation driven by superior margins and steady dividends but carries stretched multiples. Sanmina offers better operational efficiency and a conservative balance sheet but struggles with profitability and no dividend. Risk-averse investors may prefer Sanmina’s safety; growth seekers might lean toward TE’s established returns.
Which one offers the Superior Shareholder Reward?
I see TE Connectivity (TEL) offers a balanced distribution strategy with a 1.25% dividend yield and a 44% payout ratio, backed by strong FCF coverage above 2.3x. TEL also executes steady buybacks, enhancing total return sustainably. Sanmina (SANM) pays no dividends, reinvesting all FCF into growth, but its free cash flow yield is lower, and buybacks are minimal. Historically, TEL’s model delivers a more reliable, long-term shareholder reward relative to SANM’s growth-focused, dividend-free approach. For 2026, I favor TEL for a superior total return profile due to its prudent capital allocation and shareholder-friendly distributions.
Comparative Score Analysis: The Strategic Profile
The radar chart reveals the fundamental DNA and trade-offs of TE Connectivity Ltd. and Sanmina Corporation, highlighting their financial strengths and vulnerabilities:
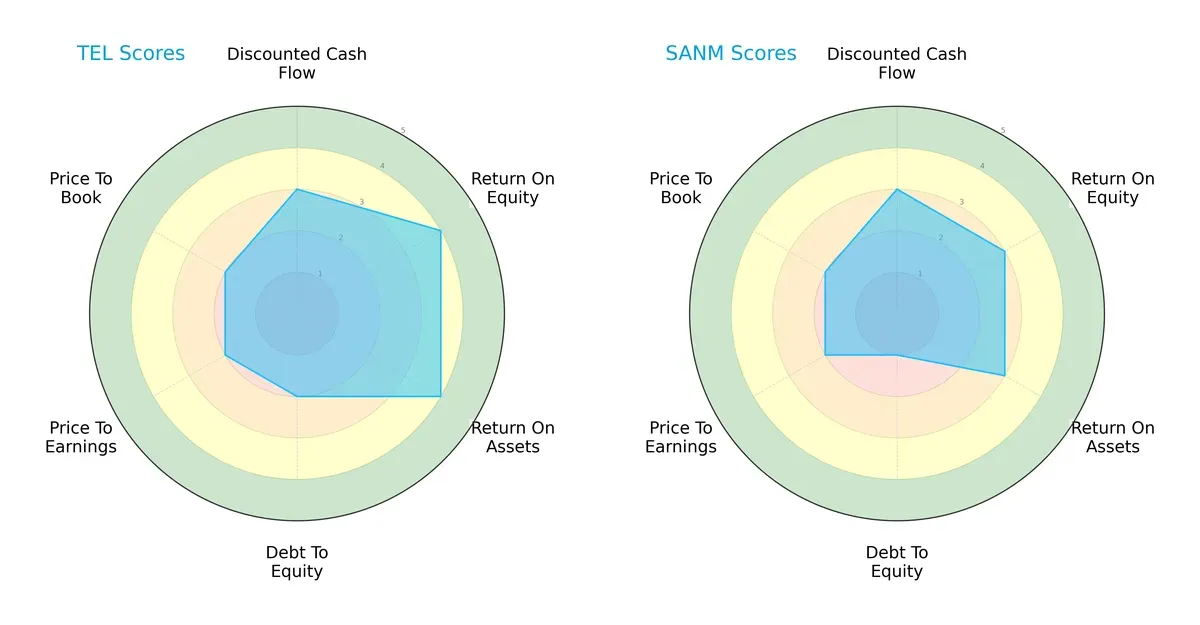
TE Connectivity shows a more balanced profile with higher ROE (4 vs. 3) and ROA (4 vs. 3) scores, suggesting superior operational efficiency. Sanmina lags notably in debt management (1 vs. 2), indicating higher financial risk. Both firms share similar DCF and valuation scores, but TE’s stronger profitability metrics underpin its moderate overall advantage.
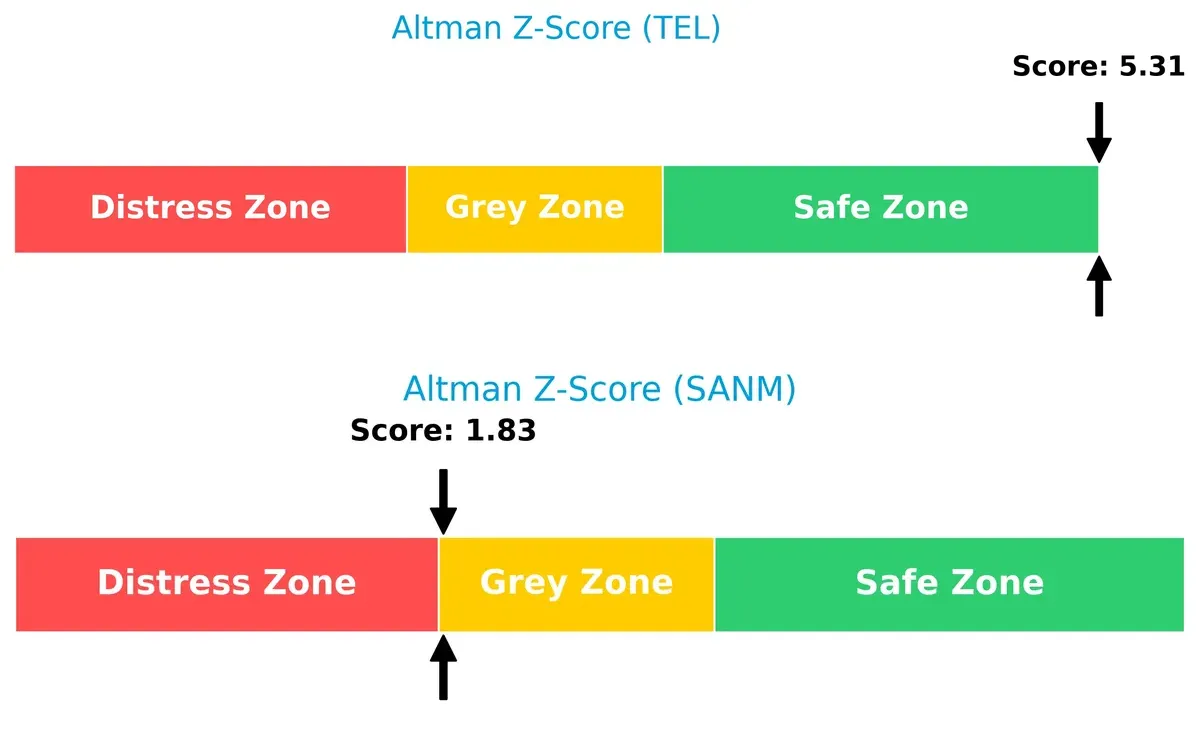
Bankruptcy Risk: Solvency Showdown
TE Connectivity’s Altman Z-Score of 5.3 places it firmly in the safe zone, while Sanmina’s 1.8 score situates it in the grey zone, signaling elevated bankruptcy risk in this late-cycle environment:
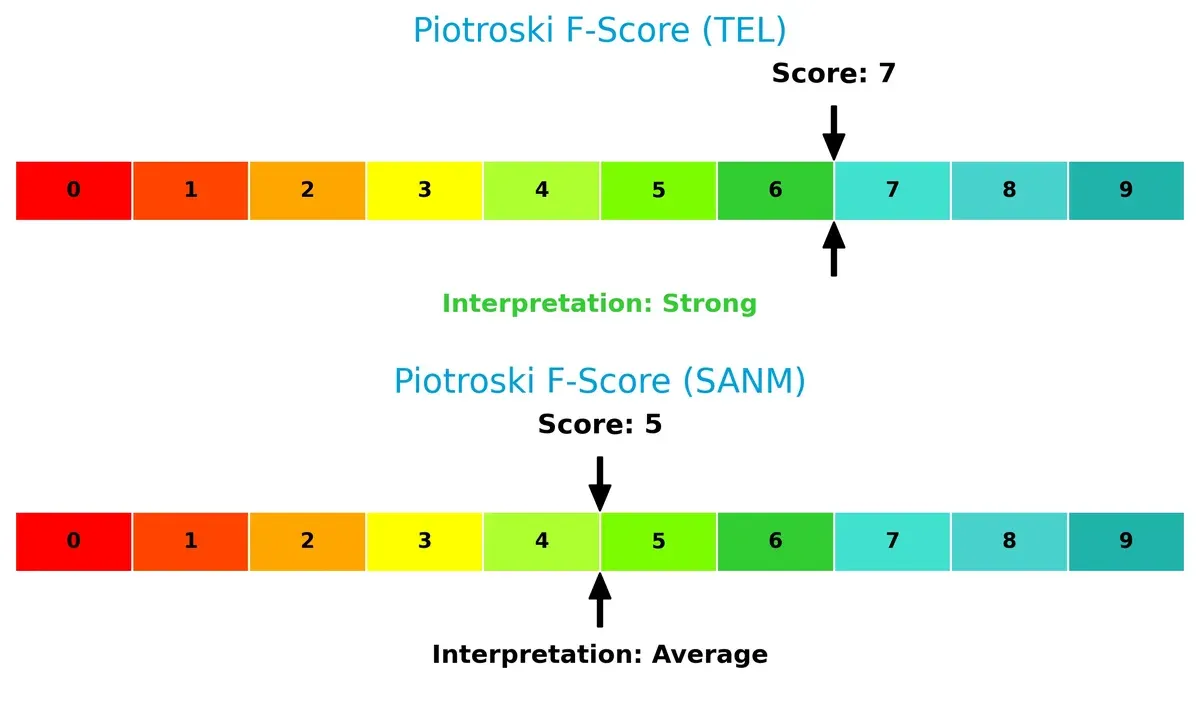
Financial Health: Quality of Operations
TE Connectivity’s Piotroski F-Score of 7 indicates strong financial health, outperforming Sanmina’s average score of 5. This gap flags potential red flags in Sanmina’s internal operations compared to TE’s more robust fundamentals:
How are the two companies positioned?
This section dissects TEL and SANM’s operational DNA by comparing their revenue distribution and internal dynamics. The goal is to confront their economic moats and identify which model offers the most resilient, sustainable competitive advantage today.
Revenue Segmentation: The Strategic Mix
This visual comparison dissects how TE Connectivity Ltd. and Sanmina Corporation diversify income streams and where their primary sector bets lie:
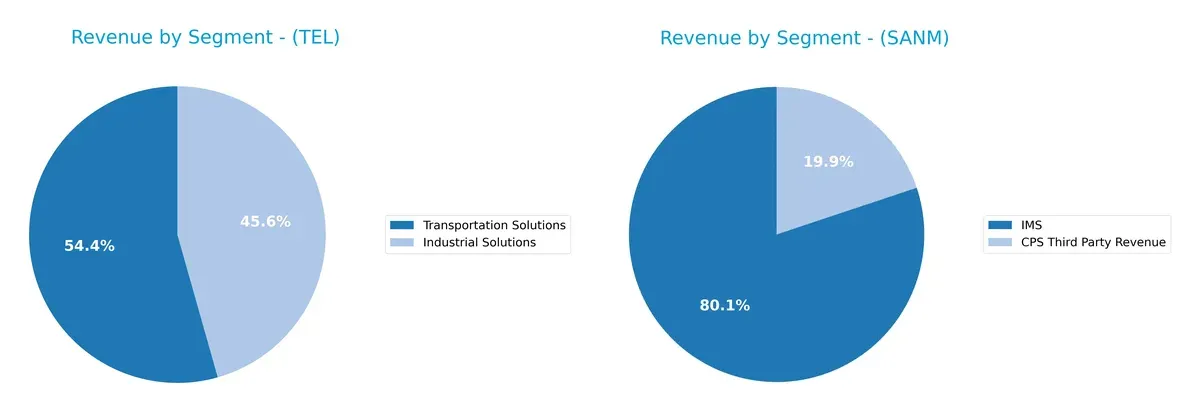
TE Connectivity anchors its revenue in Transportation Solutions at $9.4B, with Industrial Solutions contributing $7.9B, showing moderate diversification. Sanmina relies heavily on IMS at $6.5B, with CPS Third Party Revenue at $1.6B, indicating a more concentrated mix. TE’s broader spread reduces concentration risk, while Sanmina’s focus on IMS suggests dependency but also potential ecosystem dominance in manufacturing services.
Strengths and Weaknesses Comparison
This table compares the strengths and weaknesses of TE Connectivity Ltd. (TEL) and Sanmina Corporation (SANM):
TEL Strengths
- Diverse revenue streams in Industrial and Transportation Solutions
- Strong presence in China and U.S. markets
- Favorable liquidity ratios with current ratio 1.56 and quick ratio 1.03
- Superior interest coverage at 42.61
- Favorable fixed asset turnover at 3.96
SANM Strengths
- Focused revenue segments with IMS and CPS Third Party Revenue
- Strong liquidity with current ratio 1.72 and quick ratio 1.02
- Low debt-to-equity ratio at 0.17 and debt-to-assets at 6.73%
- High interest coverage at 80.01
- High asset turnover at 1.39 and fixed asset turnover at 11.91
TEL Weaknesses
- Unfavorable valuation metrics with PE 35.0 and PB 5.12
- Neutral profitability metrics with ROE 14.64% and ROIC 8.82% slightly below WACC 9.07%
- Moderate debt level with D/E 0.52
- Dividend yield modest at 1.25%
SANM Weaknesses
- Low net margin at 3.03% indicating weak profitability
- Unfavorable PE 25.59 and zero dividend yield
- Higher unfavorable ratios percentage at 21.43%
- Lower global diversification with concentration in Americas and Asia Pacific
Overall, TEL benefits from broader geographic diversification and better liquidity metrics, though its valuation appears stretched compared to fundamentals. SANM shows operational efficiency and lower leverage but faces challenges in profitability and valuation. Both companies maintain slightly favorable financial profiles but differ in strategic balance between growth and risk.
The Moat Duel: Analyzing Competitive Defensibility
A structural moat is the only reliable barrier defending long-term profits from relentless competition erosion:
TE Connectivity Ltd.: Intangible Assets and Global Reach Moat
TE Connectivity leverages its vast portfolio of specialized connectivity solutions and global distribution, reflected in stable gross margins near 35%. Yet, a declining ROIC signals pressure on capital efficiency heading into 2026.
Sanmina Corporation: Integrated Manufacturing Solutions Moat
Sanmina’s moat rests on its end-to-end manufacturing capabilities and supply chain integration, supporting steady revenue growth. Despite a slightly unfavorable ROIC trend, its diversified services sustain competitive resilience versus TE Connectivity.
Capital Efficiency vs. Operational Integration: Which Moat Holds Stronger?
TE Connectivity’s intangible asset moat is broad but weakening with falling ROIC. Sanmina’s narrower operational moat shows better capital discipline, though still challenged. Sanmina appears better positioned to defend market share amid rising capital efficiency pressures.
Which stock offers better returns?
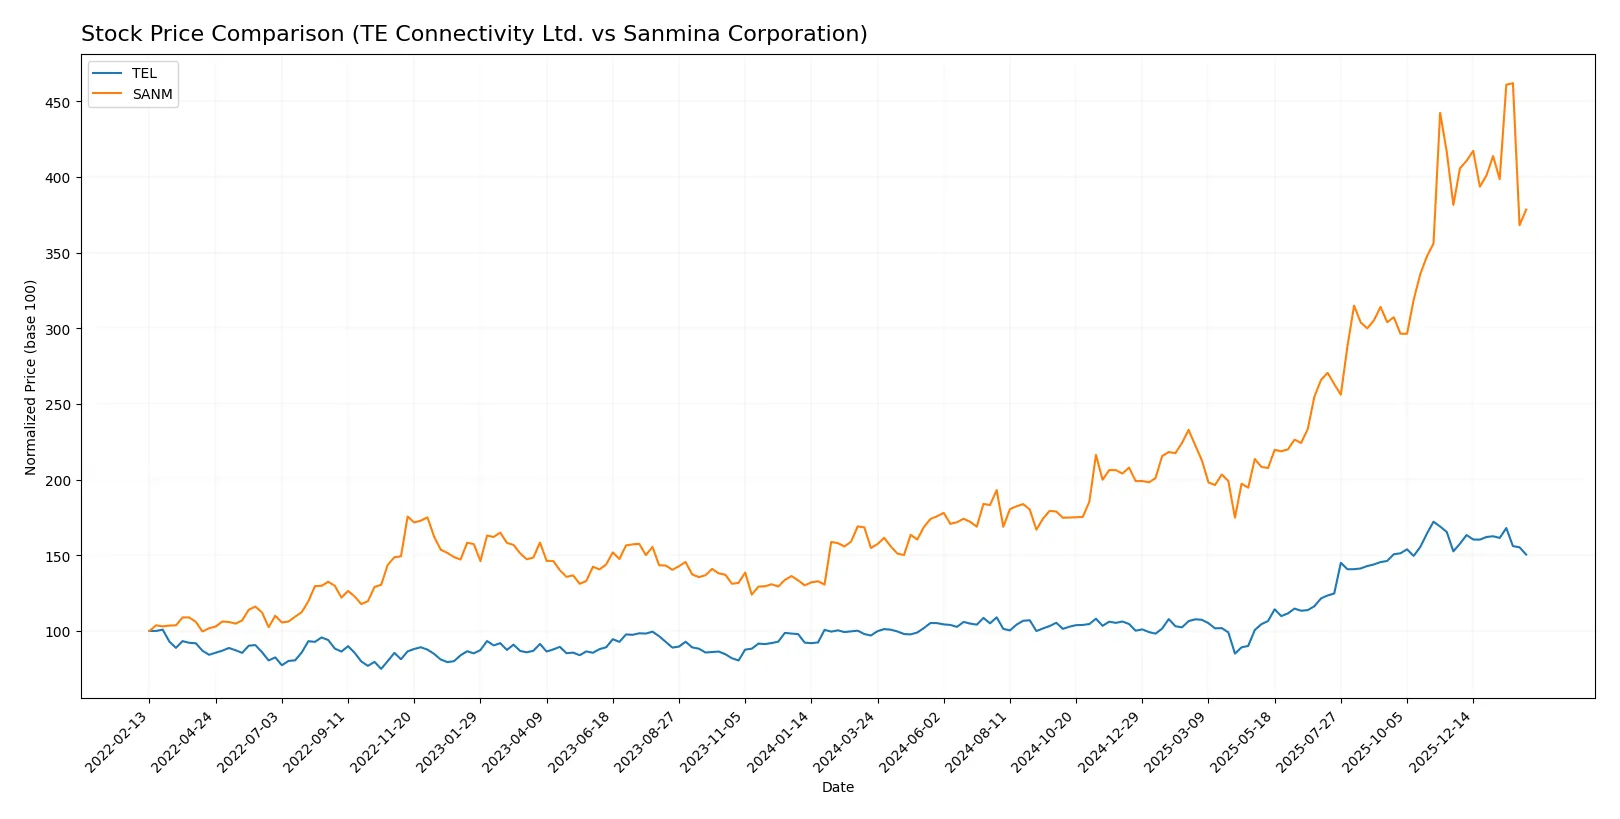
Over the past 12 months, TE Connectivity Ltd. and Sanmina Corporation showed strong bullish trends with significant price gains, though recent months reveal slight deceleration and mixed trading dynamics.
Trend Comparison
TE Connectivity Ltd. gained 55.07% over the past year, showing a bullish trend with decelerating momentum and a high volatility of 34.41%. The recent period indicates a mild negative trend of -1.43%.
Sanmina Corporation surged 144.41% during the same timeframe, also displaying a bullish but decelerating trend with a volatility of 32.15%. Its recent price change was slightly negative at -0.81%, with a modest upward slope.
Sanmina’s stock outperformed TE Connectivity significantly over the past year, delivering the highest market returns despite both stocks showing decelerating bullish trends.
Target Prices
Analysts present a bullish consensus for TE Connectivity Ltd. and Sanmina Corporation, suggesting meaningful upside from current levels.
| Company | Target Low | Target High | Consensus |
|---|---|---|---|
| TE Connectivity Ltd. | 238 | 306 | 270.29 |
| Sanmina Corporation | 200 | 200 | 200 |
TE Connectivity’s consensus target sits 25% above its $215.79 price, indicating confidence in growth. Sanmina’s $200 target implies a 37% premium over its $145.69 market price, signaling strong analyst optimism.

Don’t Let Luck Decide Your Entry Point
Optimize your entry points with our advanced ProRealTime indicators. You’ll get efficient buy signals with precise price targets for maximum performance. Start outperforming now!
How do institutions grade them?
TE Connectivity Ltd. Grades
The following table summarizes recent institutional grades for TE Connectivity Ltd.:
| Grading Company | Action | New Grade | Date |
|---|---|---|---|
| Oppenheimer | Upgrade | Outperform | 2026-01-27 |
| Barclays | Maintain | Overweight | 2026-01-23 |
| Wells Fargo | Maintain | Equal Weight | 2026-01-22 |
| Truist Securities | Maintain | Hold | 2026-01-22 |
| UBS | Maintain | Buy | 2026-01-14 |
| Truist Securities | Maintain | Hold | 2025-12-19 |
| Wells Fargo | Maintain | Equal Weight | 2025-12-09 |
| Barclays | Maintain | Overweight | 2025-11-21 |
| Truist Securities | Maintain | Hold | 2025-11-21 |
| TD Cowen | Maintain | Buy | 2025-11-17 |
Sanmina Corporation Grades
The following table summarizes recent institutional grades for Sanmina Corporation:
| Grading Company | Action | New Grade | Date |
|---|---|---|---|
| Argus Research | Maintain | Buy | 2026-01-28 |
| B of A Securities | Maintain | Neutral | 2025-07-11 |
| B of A Securities | Maintain | Neutral | 2025-06-09 |
| B of A Securities | Upgrade | Neutral | 2025-01-29 |
| Craig-Hallum | Maintain | Hold | 2024-11-05 |
| Craig-Hallum | Downgrade | Hold | 2024-04-30 |
| Sidoti & Co. | Upgrade | Buy | 2022-11-08 |
| Sidoti & Co. | Upgrade | Buy | 2022-11-07 |
| Sidoti & Co. | Downgrade | Neutral | 2022-10-31 |
| Sidoti & Co. | Downgrade | Neutral | 2022-10-30 |
Which company has the best grades?
TE Connectivity Ltd. has received more consistent high-grade ratings, including multiple Buy and Outperform designations. Sanmina’s ratings tend to cluster around Neutral and Hold, with fewer recent upgrades. This suggests TE Connectivity may have stronger institutional confidence, potentially influencing investor sentiment.
Risks specific to each company
The following categories identify the critical pressure points and systemic threats facing both firms in the 2026 market environment:
1. Market & Competition
TE Connectivity Ltd.
- Operates globally with a diversified industrial portfolio, facing intense competition in connectors and sensor markets.
Sanmina Corporation
- Faces competitive pressures in contract manufacturing with reliance on OEM sectors and diverse product lines.
2. Capital Structure & Debt
TE Connectivity Ltd.
- Moderate leverage with D/E of 0.52 and strong interest coverage of 42.61, indicating solid debt servicing capacity.
Sanmina Corporation
- Low leverage with D/E of 0.17 and exceptional interest coverage of 80.01, reflecting conservative debt management.
3. Stock Volatility
TE Connectivity Ltd.
- Beta of 1.235 suggests slightly higher volatility than the market, typical for tech hardware firms.
Sanmina Corporation
- Beta of 1.027 indicates near-market volatility, showing relatively stable stock price movements.
4. Regulatory & Legal
TE Connectivity Ltd.
- Global operations expose it to varied regulatory regimes, especially in transportation and industrial sectors.
Sanmina Corporation
- Exposure to regulatory risks in aerospace and defense manufacturing, plus compliance challenges in medical segments.
5. Supply Chain & Operations
TE Connectivity Ltd.
- Complex global supply chains in automotive and industrial markets risk disruption from geopolitical tensions.
Sanmina Corporation
- Heavy reliance on integrated manufacturing solutions creates vulnerability to supply chain bottlenecks and customer concentration.
6. ESG & Climate Transition
TE Connectivity Ltd.
- Increasing pressure to innovate sustainable products and reduce carbon footprint across diverse markets.
Sanmina Corporation
- Needs to enhance ESG integration to meet growing demands in aerospace and medical sectors for greener operations.
7. Geopolitical Exposure
TE Connectivity Ltd.
- Swiss base with global sales, exposed to trade tensions and currency volatility, particularly in Asia and Americas.
Sanmina Corporation
- U.S.-based with significant international footprint, sensitive to tariffs and export controls affecting supply chains.
Which company shows a better risk-adjusted profile?
TE Connectivity’s biggest risk lies in its exposure to complex global supply chains and geopolitical tensions. Sanmina’s critical vulnerability is its lower profitability margin and moderate financial strength, highlighted by its Altman Z-Score in the grey zone. I see TE Connectivity presenting a stronger risk-adjusted profile, supported by a safer Altman Z-Score of 5.3 and superior interest coverage, despite slightly higher stock volatility. This resilience reflects prudent capital allocation amid sector cyclicality.
Final Verdict: Which stock to choose?
TE Connectivity Ltd. (TEL) stands out as a cash-generating powerhouse with strong operational efficiency and robust income quality. Its point of vigilance lies in a declining ROIC trend, signaling potential challenges in sustaining value creation. TEL suits aggressive growth portfolios seeking established industrial strength with a focus on cash flow.
Sanmina Corporation (SANM) leverages a strategic moat built on superior asset turnover and a solid balance sheet, reflecting operational agility and financial prudence. Compared to TEL, SANM offers a safer profile with less leverage and stronger financial stability. It fits well within GARP portfolios prioritizing growth tempered by reasonable risk.
If you prioritize cash flow strength and operational scale, TEL is the compelling choice due to its proven income generation despite value erosion risks. However, if you seek stability with efficient capital use and lower leverage, SANM offers better stability and a more balanced growth outlook. Both present analytical scenarios worth considering based on your risk tolerance and investment horizon.
Disclaimer: Investment carries a risk of loss of initial capital. The past performance is not a reliable indicator of future results. Be sure to understand risks before making an investment decision.
Go Further
I encourage you to read the complete analyses of TE Connectivity Ltd. and Sanmina Corporation to enhance your investment decisions: