Home > Comparison > Technology > SNDK vs TRMB
The strategic rivalry between Sandisk Corporation and Trimble Inc. defines the current trajectory of the technology sector. Sandisk operates as a capital-intensive hardware manufacturer specializing in NAND flash storage, while Trimble focuses on technology solutions across hardware and software for professional and field applications. This analysis probes their contrasting operational models and growth strategies to identify which offers a superior risk-adjusted return for a diversified portfolio in 2026.
Table of contents
Companies Overview
Sandisk Corporation and Trimble Inc. hold pivotal roles in the hardware and technology sectors, shaping digital storage and precision solutions markets.
Sandisk Corporation: Leader in Flash Storage Innovation
Sandisk dominates the NAND flash storage market, generating revenue primarily through solid state drives, removable cards, and embedded products. Its strategic focus in 2026 revolves around enhancing storage device performance and expanding its footprint in high-capacity, durable storage solutions. The company’s competitive edge lies in its proprietary flash technology, which anchors its market position.
Trimble Inc.: Precision Solutions for Professionals
Trimble specializes in technology solutions for professionals and mobile workers, focusing on software and hardware for construction, agriculture, geospatial, and transportation industries. Revenue stems from diverse segments including 3D design software, asset tracking, precision agriculture, and fleet management systems. Its 2026 strategy emphasizes integrating advanced automation and data analytics to optimize work processes across sectors.
Strategic Collision: Similarities & Divergences
Both companies thrive in the hardware and equipment space but diverge sharply in business philosophy. Sandisk centers on proprietary storage technology, while Trimble offers a broad ecosystem of integrated software and hardware solutions. The primary battleground is the industrial and professional markets, where data capacity meets operational efficiency. Their distinct investment profiles reflect Sandisk’s focus on innovation in storage and Trimble’s on comprehensive workflow technology.
Income Statement Comparison
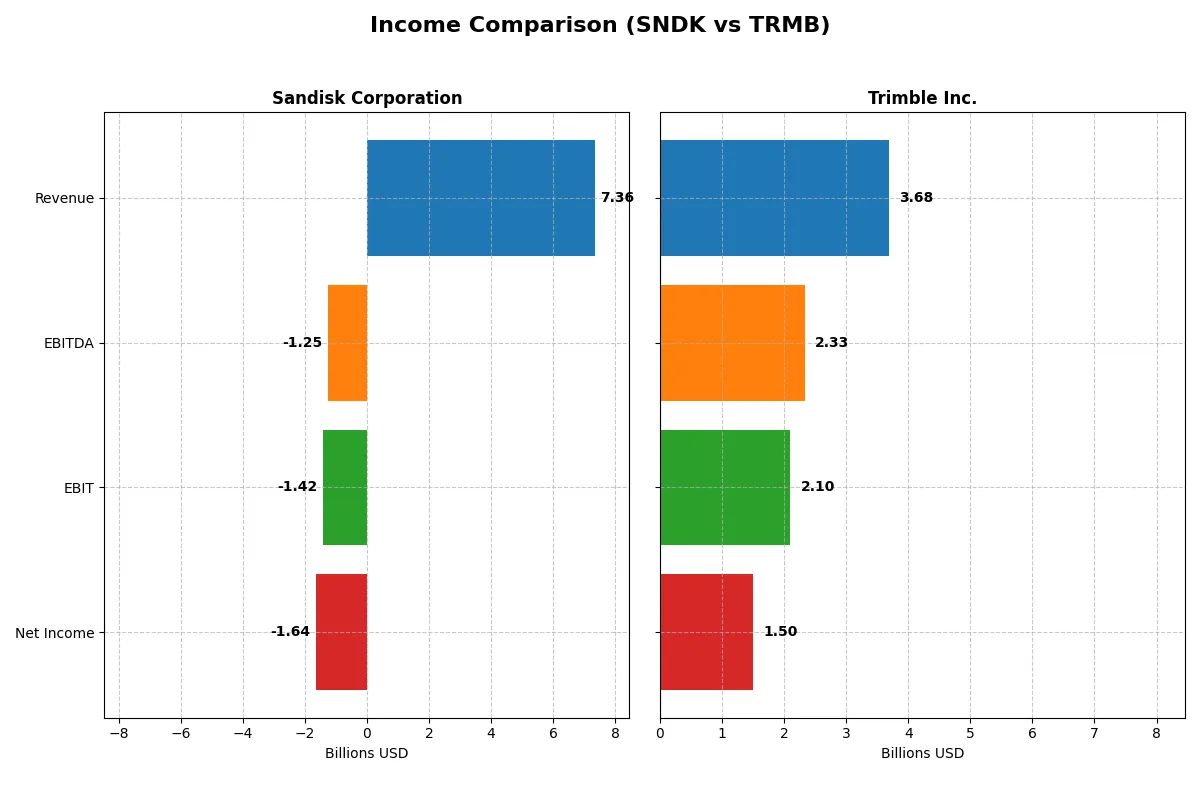
This data dissects the core profitability and scalability of both corporate engines to reveal who dominates the bottom line:
| Metric | Sandisk Corporation (SNDK) | Trimble Inc. (TRMB) |
|---|---|---|
| Revenue | 7.4B | 3.7B |
| Cost of Revenue | 5.1B | 1.3B |
| Operating Expenses | 3.6B | 1.9B |
| Gross Profit | 2.2B | 2.4B |
| EBITDA | -1.3B | 2.3B |
| EBIT | -1.4B | 2.1B |
| Interest Expense | 63M | 91M |
| Net Income | -1.6B | 1.5B |
| EPS | -11.32 | 6.13 |
| Fiscal Year | 2025 | 2024 |
Income Statement Analysis: The Bottom-Line Duel
This income statement comparison reveals which company operates with more efficiency and delivers stronger profitability.
Sandisk Corporation Analysis
Sandisk’s revenue shows a mixed trajectory, rising from $6.1B in 2023 to $7.4B in 2025, but net income deteriorates sharply from $1.06B profit in 2022 to a $1.64B loss in 2025. Gross margin stabilizes around 30%, yet operating and net margins plunge into negative territory. The latest fiscal year reveals worsening losses, signaling severe operational challenges despite revenue growth.
Trimble Inc. Analysis
Trimble’s revenue slightly declined to $3.68B in 2024 from $3.8B in 2023 but remains relatively stable over the longer term. Gross margin impresses at 65%, with net margin surging to 40.8% in 2024. The company demonstrates strong earnings momentum, with net income climbing from $311M in 2023 to $1.5B in 2024. Trimble’s efficient cost control drives robust profitability despite modest top-line fluctuations.
Margin Mastery vs. Revenue Struggles
Trimble clearly outperforms Sandisk in profitability and margin health. Trimble’s 40.8% net margin and strong income growth contrast sharply with Sandisk’s negative 22.3% net margin and rising losses. Investors seeking stable earnings and operational efficiency will find Trimble’s profile more attractive than Sandisk’s troubled revenue gains paired with deepening losses.
Financial Ratios Comparison
These vital ratios act as a diagnostic tool to expose the underlying fiscal health, valuation premiums, and capital efficiency of the companies compared below:
| Ratios | Sandisk Corporation (SNDK) | Trimble Inc. (TRMB) |
|---|---|---|
| ROE | -17.8% | 26.2% |
| ROIC | -11.9% | 4.5% |
| P/E | -4.17 | 11.52 |
| P/B | 0.74 | 3.02 |
| Current Ratio | 3.56 | 1.27 |
| Quick Ratio | 2.11 | 1.16 |
| D/E (Debt-to-Equity) | 0.22 | 0.26 |
| Debt-to-Assets | 15.7% | 16.0% |
| Interest Coverage | -21.9 | 5.08 |
| Asset Turnover | 0.57 | 0.39 |
| Fixed Asset Turnover | 11.88 | 11.81 |
| Payout ratio | 0 | 0 |
| Dividend yield | 0 | 0 |
| Fiscal Year | 2025 | 2024 |
Efficiency & Valuation Duel: The Vital Signs
Financial ratios act as a company’s DNA, exposing hidden risks and revealing operational strengths that shape investment decisions.
Sandisk Corporation
Sandisk shows negative core profitability with a ROE of -17.81% and a net margin of -22.31%, signaling operational challenges. Its valuation metrics, including a favorable P/E of -4.17 and P/B of 0.74, suggest undervaluation. The company pays no dividends, instead heavily reinvesting in R&D at 15.4% of revenue, aiming for future growth despite current losses.
Trimble Inc.
Trimble delivers strong profitability with a ROE of 26.18% and a healthy net margin of 40.84%, reflecting efficient operations. Its P/E at 11.52 is attractive but offset by a higher P/B of 3.02, indicating premium valuation. Trimble does not pay dividends either, focusing on steady capital discipline and moderate R&D investment of 17.98% to sustain innovation.
Profitability Strength vs. Valuation Discipline
Trimble offers superior profitability and operational efficiency, balanced by a premium valuation. Sandisk’s undervalued multiples come with significant profitability risks. Investors seeking growth with operational resilience may prefer Trimble, while value seekers might consider Sandisk’s low valuation but must accept its elevated risk profile.
Which one offers the Superior Shareholder Reward?
I see both Sandisk Corporation (SNDK) and Trimble Inc. (TRMB) pay no dividends in 2026. SNDK struggles with negative free cash flow (-0.8/share in 2025), no buybacks, and worsening margins, signaling weak distribution capacity. TRMB delivers positive free cash flow ($2.0/share), consistent buybacks, and solid profitability (40.8% net margin), despite a higher valuation. TRMB’s efficient capital allocation and sustainable cash generation make it the superior choice for total shareholder return in 2026.
Comparative Score Analysis: The Strategic Profile
The radar chart reveals the core DNA and trade-offs of Sandisk Corporation and Trimble Inc., highlighting their contrasting financial strengths and weaknesses:
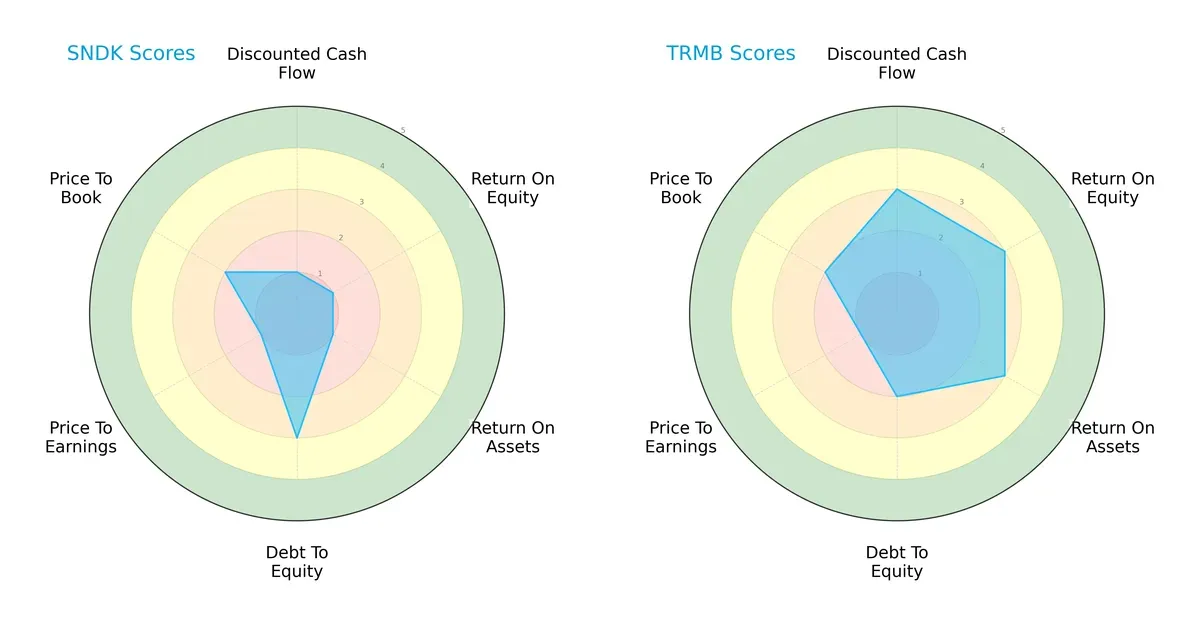
Trimble exhibits a more balanced profile with moderate scores in DCF (3), ROE (3), and ROA (3), signaling efficient capital allocation and asset utilization. Sandisk relies on a moderate debt-to-equity score (3) but suffers across profitability and valuation metrics, indicating a weak operational performance and potential overvaluation risk. Trimble’s diversified edge contrasts with Sandisk’s concentrated leverage strength.
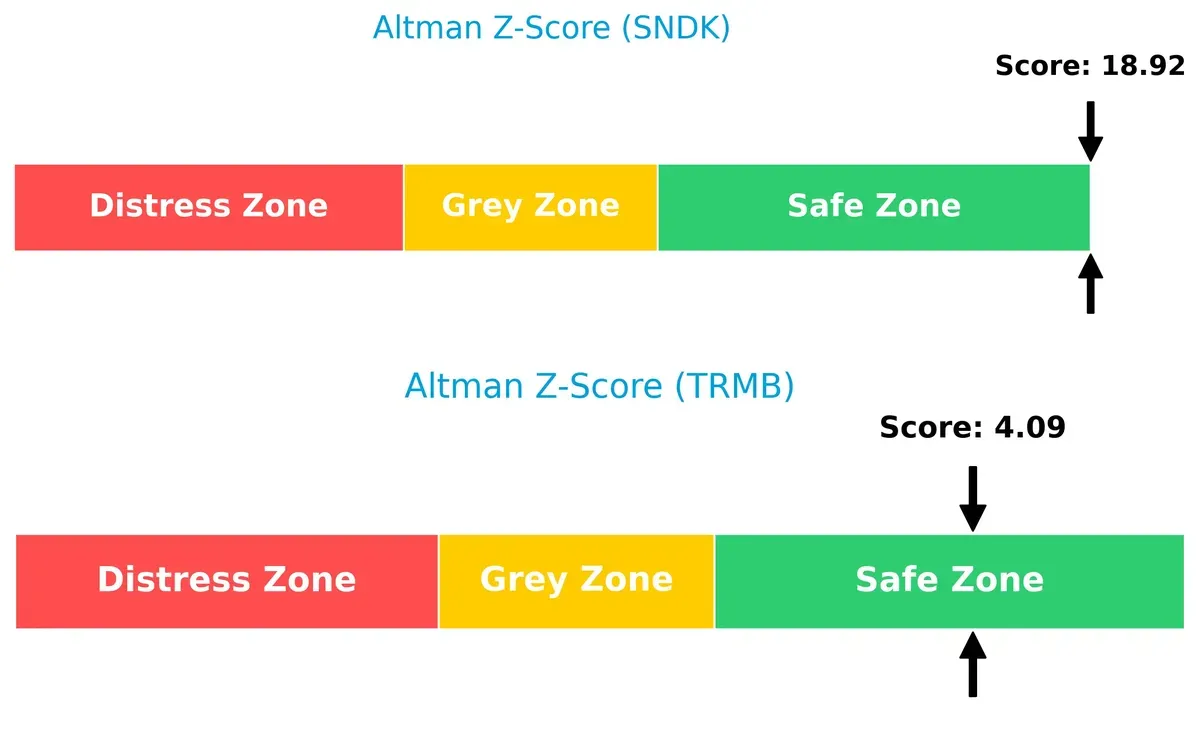
Bankruptcy Risk: Solvency Showdown
Trimble’s Altman Z-Score of 4.1 versus Sandisk’s 18.9 indicates both firms are in the safe zone, with Sandisk showing exceptionally strong solvency suggesting minimal bankruptcy risk in this cycle:
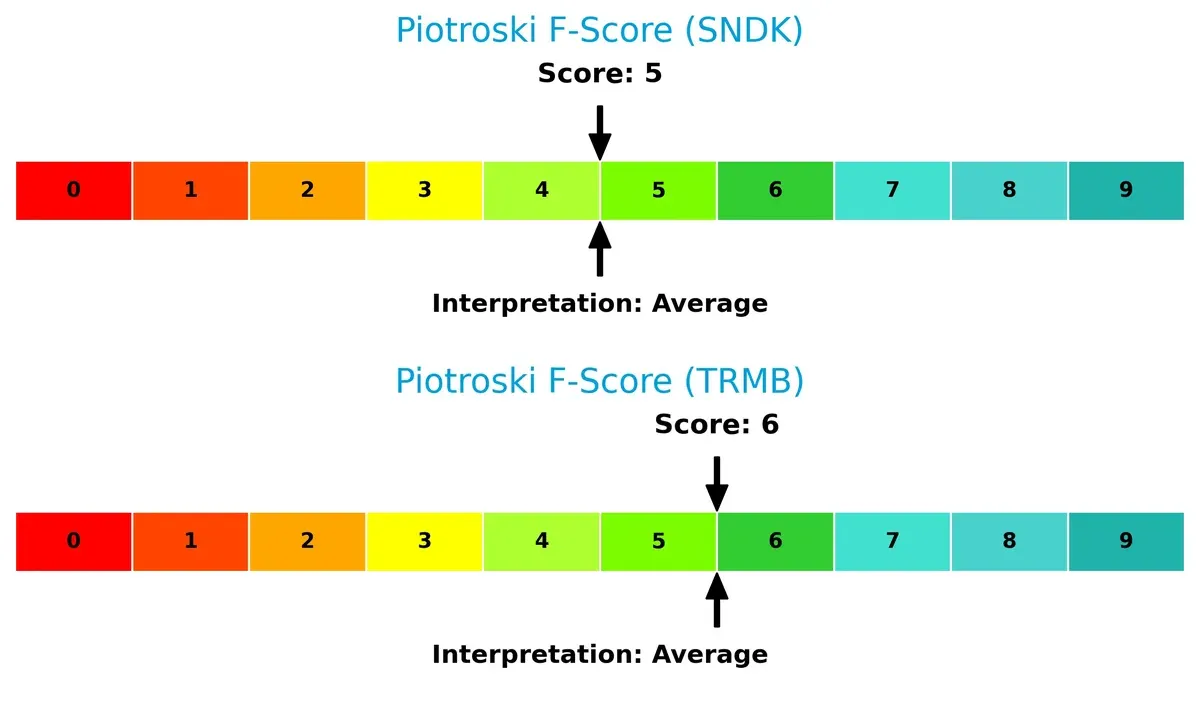
Financial Health: Quality of Operations
Trimble’s Piotroski F-Score of 6 slightly outperforms Sandisk’s 5, signaling marginally better financial health. Both scores fall into the average category, implying neither firm is in peak condition, but Sandisk’s internal metrics raise mild red flags:
How are the two companies positioned?
This section dissects the operational DNA of Sandisk and Trimble by comparing their revenue distribution and internal dynamics. The goal is to confront their economic moats and identify which model delivers the most resilient competitive advantage today.
Revenue Segmentation: The Strategic Mix
This visual comparison dissects how Sandisk Corporation and Trimble Inc. diversify their income streams and where their primary sector bets lie:
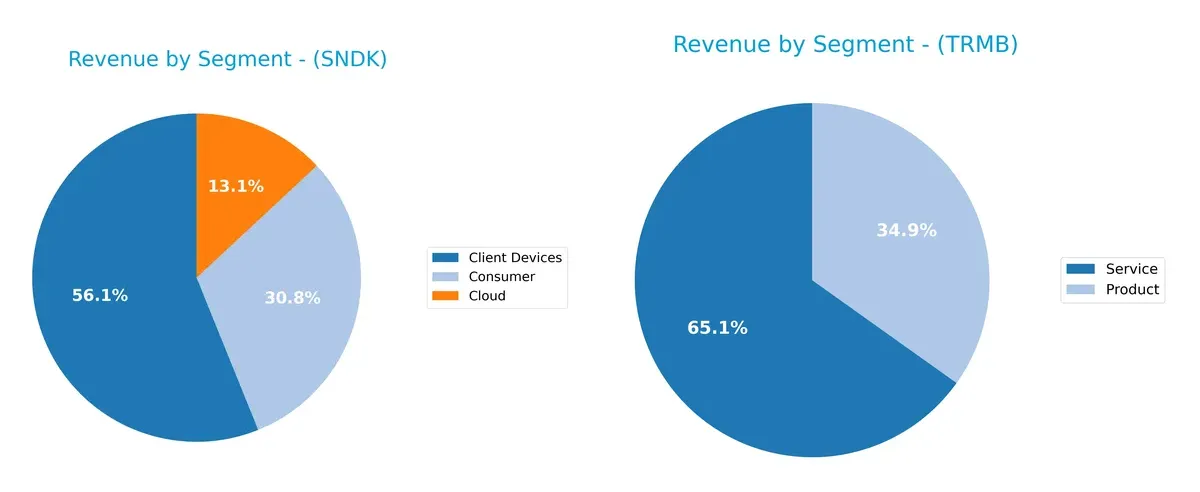
Sandisk anchors its revenue with $4.1B from Client Devices, complemented by $2.3B Consumer and $960M Cloud segments, showing moderate diversification. Trimble, by contrast, pivots between $1.3B Product and $2.4B Service revenues, reflecting a more balanced split but less reliance on a single dominant stream. Sandisk’s concentration on hardware signals potential exposure to device market cycles, while Trimble’s service-product mix suggests resilience via recurring contracts and infrastructure focus.
Strengths and Weaknesses Comparison
This table compares the Strengths and Weaknesses of Sandisk Corporation and Trimble Inc.:
Sandisk Corporation Strengths
- Strong diversification with Client Devices, Consumer, and Cloud segments
- High quick ratio at 2.11 indicates good short-term liquidity
- Low debt-to-assets at 15.73% supports financial stability
- Favorable fixed asset turnover of 11.88 reflects efficient asset use
- Price-to-book ratio at 0.74 suggests undervaluation
Trimble Inc. Strengths
- Robust profitability with net margin above 40% and ROE over 26%
- Favorable interest coverage at 23.12 ensures debt serviceability
- Good quick ratio of 1.16 supports liquidity
- Diverse revenue streams from Products and Services
- Global reach with strong North America and Europe presence
Sandisk Corporation Weaknesses
- Negative net margin and ROE indicate profitability challenges
- Unfavorable WACC at 25.93% signals high capital costs
- Negative interest coverage raises solvency concerns
- High current ratio at 3.56 may indicate inefficient asset use
- No dividend yield limits income appeal
Trimble Inc. Weaknesses
- ROIC below WACC suggests weak capital returns
- Price-to-book ratio at 3.02 could imply overvaluation risk
- Asset turnover at 0.39 is relatively low, signaling less efficient use
- No dividend yield reduces income opportunities
Sandisk struggles with profitability and capital efficiency despite solid liquidity and asset management. Trimble exhibits strong profitability and stable financial health but faces challenges in capital returns and asset utilization. Both companies show no dividend yield, which may affect income-focused investors.
The Moat Duel: Analyzing Competitive Defensibility
A durable structural moat is the sole barrier protecting long-term profits from competitive erosion in evolving markets:
Sandisk Corporation: Cost Advantage in NAND Flash Storage
Sandisk’s moat stems from its cost leadership in NAND flash technology, reflected in stable gross margins around 30%. However, declining ROIC and negative EBIT margins signal worsening profitability risks in 2026. New product innovations must reverse this trend to sustain its cost edge.
Trimble Inc.: Integrated Solutions Network Effect
Trimble leverages network effects through comprehensive, field-to-office software and hardware ecosystems, driving strong gross margins above 65% and 40% net margins. Despite a recent revenue dip, its expanding software offerings deepen customer lock-in and growth prospects remain robust in 2026.
Verdict: Cost Leadership vs. Ecosystem Integration
Both firms face declining ROIC trends, yet Trimble’s wider moat arises from its integrated ecosystem and superior profitability metrics. I see Trimble better positioned to defend and grow its market share amid intensifying competition.
Which stock offers better returns?
The past year reveals stark contrasts in price dynamics and trading behavior between Sandisk Corporation and Trimble Inc., with Sandisk showing remarkable gains and strong buyer dominance.
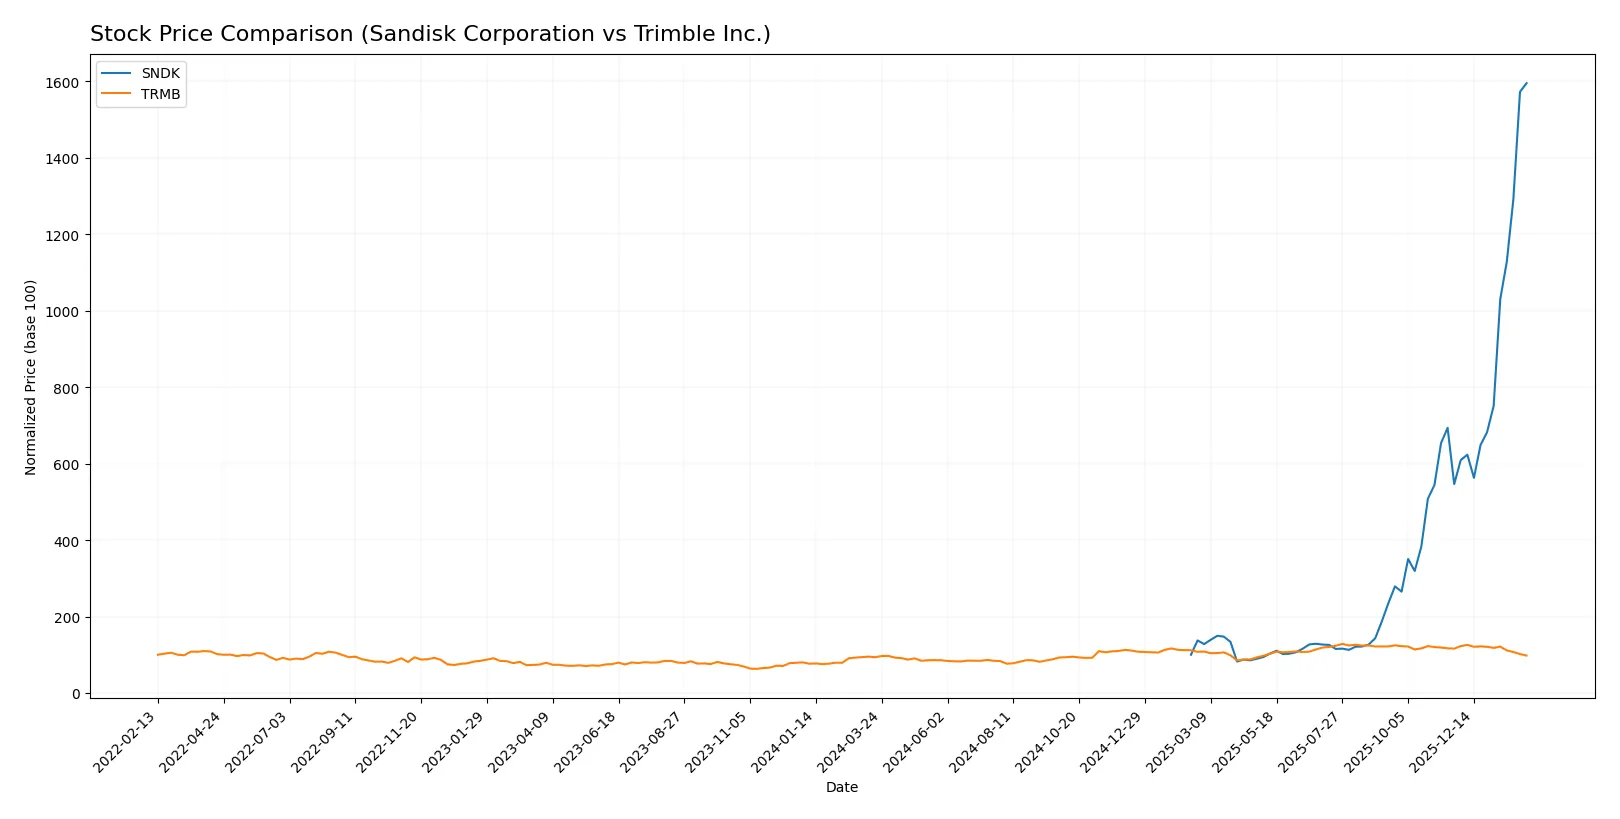
Trend Comparison
Sandisk’s stock surged 1494.95% over the past year, reflecting a strong bullish trend with accelerating momentum and significant volatility, reaching a high of 584.55 and a low of 30.11.
Trimble’s stock increased 4.78% over the same period, indicating a mild bullish trend but with decelerating momentum and lower volatility, peaking at 85.24 and bottoming at 50.86.
Sandisk outperformed Trimble clearly, delivering the highest market returns with accelerating growth, while Trimble’s gains remain modest and slowing.
Target Prices
Analysts present a broad but optimistic consensus on target prices for Sandisk Corporation and Trimble Inc.
| Company | Target Low | Target High | Consensus |
|---|---|---|---|
| Sandisk Corporation | 220 | 1,000 | 675 |
| Trimble Inc. | 94 | 102 | 98.2 |
Sandisk’s target consensus of 675 suggests significant upside from its current price of 585, reflecting confidence despite recent volatility. Trimble’s consensus near 98.2 also indicates a strong potential gain from the current 65.04 price level.

Don’t Let Luck Decide Your Entry Point
Optimize your entry points with our advanced ProRealTime indicators. You’ll get efficient buy signals with precise price targets for maximum performance. Start outperforming now!
How do institutions grade them?
Here is a summary of the recent institutional grades for Sandisk Corporation and Trimble Inc.:
Sandisk Corporation Grades
The table below shows Sandisk Corporation’s latest grades from major financial institutions.
| Grading Company | Action | New Grade | Date |
|---|---|---|---|
| Barclays | Maintain | Equal Weight | 2026-02-02 |
| Citigroup | Maintain | Buy | 2026-02-02 |
| Jefferies | Maintain | Buy | 2026-01-30 |
| Wedbush | Maintain | Outperform | 2026-01-30 |
| RBC Capital | Maintain | Sector Perform | 2026-01-30 |
| Goldman Sachs | Maintain | Buy | 2026-01-30 |
| Morgan Stanley | Maintain | Overweight | 2026-01-30 |
| Cantor Fitzgerald | Maintain | Overweight | 2026-01-30 |
| Citigroup | Maintain | Buy | 2026-01-20 |
| Wells Fargo | Maintain | Equal Weight | 2026-01-15 |
Trimble Inc. Grades
Below are the recent institutional grades for Trimble Inc. from respected analysts.
| Grading Company | Action | New Grade | Date |
|---|---|---|---|
| Barclays | Maintain | Overweight | 2026-01-12 |
| Keybanc | Upgrade | Overweight | 2025-12-16 |
| Piper Sandler | Maintain | Overweight | 2025-11-07 |
| JP Morgan | Maintain | Overweight | 2025-09-19 |
| JP Morgan | Maintain | Overweight | 2025-08-07 |
| Oppenheimer | Maintain | Outperform | 2025-08-07 |
| Raymond James | Maintain | Outperform | 2025-08-07 |
| Oppenheimer | Maintain | Outperform | 2025-07-17 |
| JP Morgan | Maintain | Overweight | 2025-07-10 |
| JP Morgan | Maintain | Overweight | 2025-05-14 |
Which company has the best grades?
Trimble Inc. holds consistently higher grades, mainly Overweight and Outperform, indicating stronger analyst confidence. Sandisk has a mix from Equal Weight to Buy, suggesting more moderate outlooks. This difference may influence investor sentiment and portfolio positioning.
Risks specific to each company
The following categories identify the critical pressure points and systemic threats facing both firms in the 2026 market environment:
1. Market & Competition
Sandisk Corporation
- Faces intense competition in NAND flash technology with declining margins.
Trimble Inc.
- Competes in diversified tech markets but maintains strong niche leadership in geospatial and construction software.
2. Capital Structure & Debt
Sandisk Corporation
- Low debt-to-equity (0.22) and debt-to-assets (15.7%) ratios indicate conservative leverage.
Trimble Inc.
- Similar moderate leverage (D/E 0.26), but stronger interest coverage (23.1 vs. -22.5) signals better debt servicing.
3. Stock Volatility
Sandisk Corporation
- Extremely high beta (4.8) suggests significant price swings and heightened investor risk.
Trimble Inc.
- More moderate beta (1.58) implies comparatively stable stock price behavior.
4. Regulatory & Legal
Sandisk Corporation
- Subject to technology export controls and IP litigation risks in semiconductor sector.
Trimble Inc.
- Faces compliance demands in software and precision agriculture, with less exposure to export restrictions.
5. Supply Chain & Operations
Sandisk Corporation
- Relies on complex semiconductor supply chains vulnerable to geopolitical disruptions.
Trimble Inc.
- Diverse product mix mitigates supply risks but depends on specialized hardware components.
6. ESG & Climate Transition
Sandisk Corporation
- Limited disclosure on ESG initiatives may pose reputational and regulatory risks.
Trimble Inc.
- Strong ESG focus through precision agriculture and sustainable infrastructure solutions.
7. Geopolitical Exposure
Sandisk Corporation
- Significant exposure to US-China tensions affecting semiconductor manufacturing and sales.
Trimble Inc.
- Moderate exposure with global operations but less concentrated in high-tension regions.
Which company shows a better risk-adjusted profile?
Sandisk’s highest risk is its extreme stock volatility and negative profitability, which threaten shareholder value. Trimble’s primary risk lies in somewhat elevated capital costs and modest ROIC below WACC. However, Trimble’s stable earnings, stronger interest coverage, and diversified operations provide a superior risk-adjusted profile. Trimble’s Altman Z-score in the safe zone and favorable ratings underscore its relative financial resilience amid 2026 market uncertainties.
Final Verdict: Which stock to choose?
Sandisk Corporation’s superpower lies in its robust liquidity and operational resilience, reflected in a strong current ratio and impressive inventory management. However, its persistent value destruction and declining profitability remain points of vigilance. Sandisk suits investors with an appetite for aggressive growth and turnaround potential.
Trimble Inc. commands a strategic moat through its high-margin software services and steady recurring revenue streams. It offers superior profitability and a more balanced risk profile compared to Sandisk. Trimble fits well in GARP portfolios seeking growth blended with reasonable financial stability.
If you prioritize aggressive growth with a high risk-reward tradeoff, Sandisk’s operational strengths and market momentum might be compelling. However, if you seek durable profitability and a safer margin of stability, Trimble offers better downside protection despite commanding a premium valuation. Both present contrasting scenarios aligned with distinct investor profiles.
Disclaimer: Investment carries a risk of loss of initial capital. The past performance is not a reliable indicator of future results. Be sure to understand risks before making an investment decision.
Go Further
I encourage you to read the complete analyses of Sandisk Corporation and Trimble Inc. to enhance your investment decisions: