Home > Comparison > Technology > SNDK vs TDY
The strategic rivalry between Sandisk Corporation and Teledyne Technologies Incorporated shapes the technology sector’s hardware and equipment landscape. Sandisk excels as a NAND flash storage innovator, focusing on memory solutions, while Teledyne operates a diversified industrial technology model spanning instrumentation, digital imaging, aerospace, and defense. This analysis pits specialized innovation against broad industrial integration to identify which trajectory delivers superior risk-adjusted returns for a diversified portfolio.
Table of contents
Companies Overview
Sandisk Corporation and Teledyne Technologies Incorporated both hold pivotal roles in the hardware and technology sectors, commanding significant market influence.
Sandisk Corporation: Leader in Flash Storage Solutions
Sandisk Corporation dominates the NAND flash storage market. It generates revenues primarily through the development and sale of solid state drives, embedded products, removable cards, and related components. In 2026, the company’s strategic focus centers on advancing storage technologies and maintaining leadership in high-performance memory solutions.
Teledyne Technologies Incorporated: Diverse Industrial Technology Provider
Teledyne Technologies Incorporated excels as a multi-segment industrial technology firm. It earns revenue from instrumentation, digital imaging, aerospace electronics, and engineered systems. The 2026 strategy emphasizes innovation across defense, aerospace, and environmental sectors, leveraging advanced sensors and electrochemical energy systems to fuel industrial growth.
Strategic Collision: Similarities & Divergences
Both companies operate in the hardware and technology space but differ sharply in scope and approach. Sandisk pursues a focused product specialization in flash memory, while Teledyne adopts a diversified portfolio across instrumentation and defense electronics. Their key battleground lies in advanced technology innovation, yet their investment profiles diverge—Sandisk embodies concentrated tech leadership, Teledyne reflects broad industrial resilience.
Income Statement Comparison
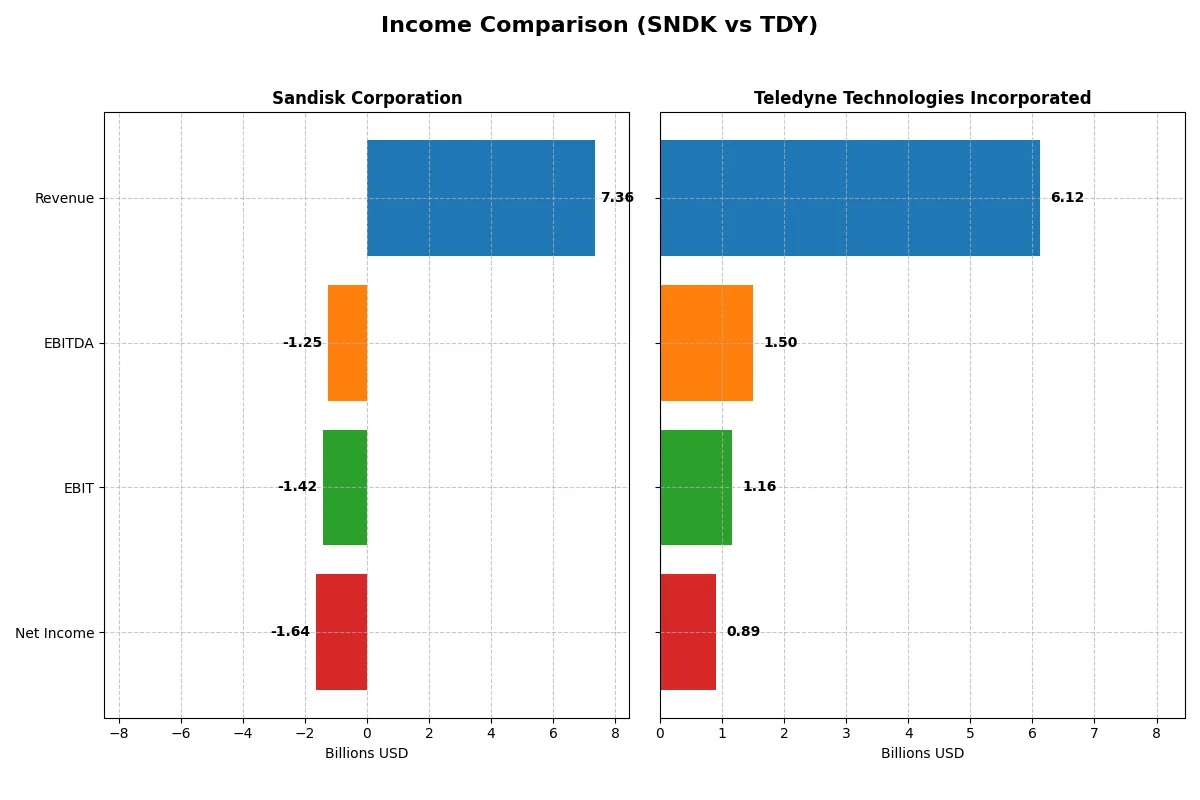
This data dissects the core profitability and scalability of both corporate engines to reveal who dominates the bottom line:
| Metric | Sandisk Corporation (SNDK) | Teledyne Technologies Incorporated (TDY) |
|---|---|---|
| Revenue | 7.36B | 6.12B |
| Cost of Revenue | 5.14B | 3.72B |
| Operating Expenses | 3.59B | 1.25B |
| Gross Profit | 2.21B | 2.40B |
| EBITDA | -1.25B | 1.50B |
| EBIT | -1.42B | 1.16B |
| Interest Expense | 63M | 60M |
| Net Income | -1.64B | 895M |
| EPS | -11.32 | 18.88 |
| Fiscal Year | 2025 | 2025 |
Income Statement Analysis: The Bottom-Line Duel
This income statement comparison reveals which company operates its business with greater efficiency and profitability in recent years.
Sandisk Corporation Analysis
Sandisk’s revenue declined by 25% from 2022 to 2025, ending at $7.35B in 2025. Net income plunged into a $1.64B loss, reversing a $1.06B profit in 2022. Its gross margin remains moderate at 30%, but the net margin sank to -22%, reflecting heavy operating losses and deteriorating bottom-line health in 2025.
Teledyne Technologies Incorporated Analysis
Teledyne’s revenue grew 33% from 2021 to 2025, reaching $6.12B in 2025. Net income doubled over this period, hitting $895M with a strong net margin of 14.6%. Gross margin stands robust at 39%, and EBIT margin improved to nearly 19%, signaling solid operating leverage and steady profitability momentum in the latest fiscal year.
Margin Resilience vs. Recovery Struggles
Teledyne clearly outperforms Sandisk by combining revenue growth with healthy profit margins and positive net income. Sandisk’s steep net losses and margin erosion highlight fundamental challenges despite a recent revenue uptick. For investors, Teledyne’s profile offers a more attractive blend of growth and profitability stability.
Financial Ratios Comparison
These vital ratios act as a diagnostic tool to expose the underlying fiscal health, valuation premiums, and capital efficiency of these companies:
| Ratios | Sandisk Corporation (SNDK) | Teledyne Technologies Incorporated (TDY) |
|---|---|---|
| ROE | -17.8% | 8.5% |
| ROIC | -11.9% | 6.8% |
| P/E | -4.17 | 27.35 |
| P/B | 0.74 | 2.33 |
| Current Ratio | 3.56 | 1.64 |
| Quick Ratio | 2.11 | 1.08 |
| D/E | 0.22 | 0.24 |
| Debt-to-Assets | 15.7% | 16.2% |
| Interest Coverage | -21.9 | 19.3 |
| Asset Turnover | 0.57 | 0.40 |
| Fixed Asset Turnover | 11.88 | 7.29 |
| Payout ratio | 0 | 0 |
| Dividend yield | 0 | 0 |
| Fiscal Year | 2025 | 2025 |
Efficiency & Valuation Duel: The Vital Signs
Financial ratios act as a company’s DNA, exposing hidden risks and operational strengths that are critical for investment decisions.
Sandisk Corporation
Sandisk suffers from deeply negative profitability metrics, with ROE at -17.81% and net margin at -22.31%, signaling operational challenges. The stock trades with a favorable P/E ratio of -4.17 and a low P/B of 0.74, indicating it is undervalued. However, no dividend is paid, reflecting a reinvestment focus on R&D (15.4% of revenue).
Teledyne Technologies Incorporated
Teledyne posts positive net margin of 14.63% and moderate ROE of 8.51%, showing solid profitability. Yet, its P/E ratio is high at 27.35, suggesting an expensive valuation. The company maintains favorable liquidity and low leverage, but also pays no dividend, likely reinvesting cash flow into steady growth and innovation.
Premium Valuation vs. Operational Safety
Teledyne offers a better balance of profitability and financial health but at a premium valuation. Sandisk’s undervaluation contrasts sharply with its poor profitability and risks. Growth-oriented investors may prefer Teledyne’s stable profile, while value seekers face higher risk with Sandisk’s turnaround potential.
Which one offers the Superior Shareholder Reward?
I compare Sandisk Corporation (SNDK) and Teledyne Technologies (TDY) on shareholder rewards. Neither pays dividends, so I focus on buyback intensity and reinvestment. Sandisk shows no dividends and negative free cash flow (-0.8/share in 2025), limiting buybacks. Teledyne also pays no dividends but generates strong free cash flow of 22.7/share in 2025 and maintains robust buybacks. Sandisk’s distribution relies on reinvestment amid losses, risking sustainability. Teledyne’s consistent cash flow and moderate leverage support sustainable buybacks, aligning with long-term value. I conclude Teledyne offers a superior total return profile for shareholders in 2026.
Comparative Score Analysis: The Strategic Profile
The radar chart reveals the fundamental DNA and trade-offs of Sandisk Corporation and Teledyne Technologies Incorporated, highlighting their distinct financial strengths and weaknesses:
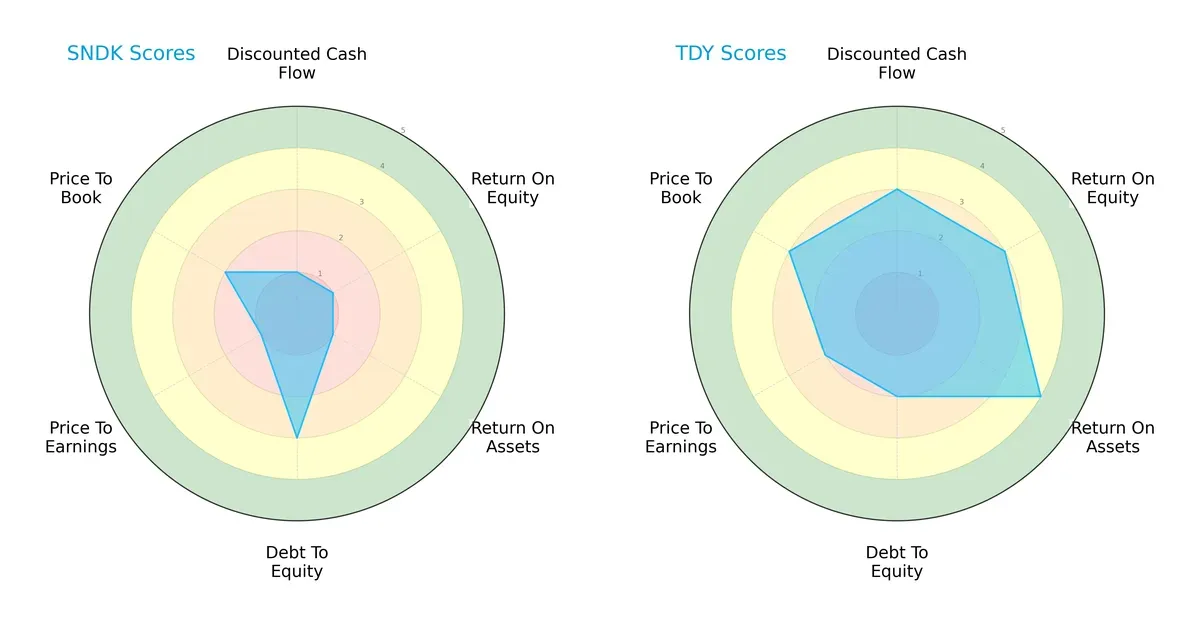
Sandisk shows significant weaknesses in DCF, ROE, ROA, and valuation metrics, scoring very unfavorably except for moderate debt-to-equity and price-to-book scores. Teledyne presents a more balanced profile, with moderate to favorable scores in cash flow, profitability, and valuation. Teledyne leverages operational efficiency and asset utilization, while Sandisk relies modestly on conservative leverage.
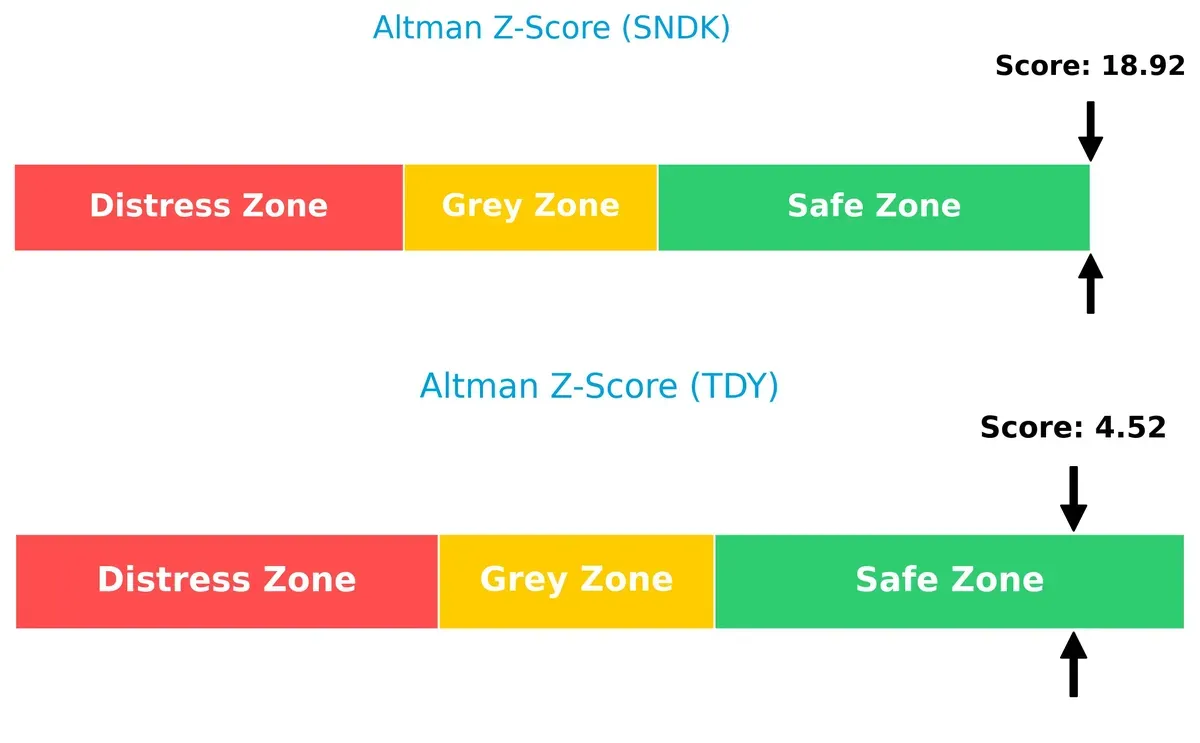
Bankruptcy Risk: Solvency Showdown
Teledyne’s Altman Z-Score of 4.52 versus Sandisk’s 18.92 places both firmly in the safe zone, but Sandisk exhibits an exceptionally strong solvency buffer, signaling superior long-term survival prospects in this cycle:
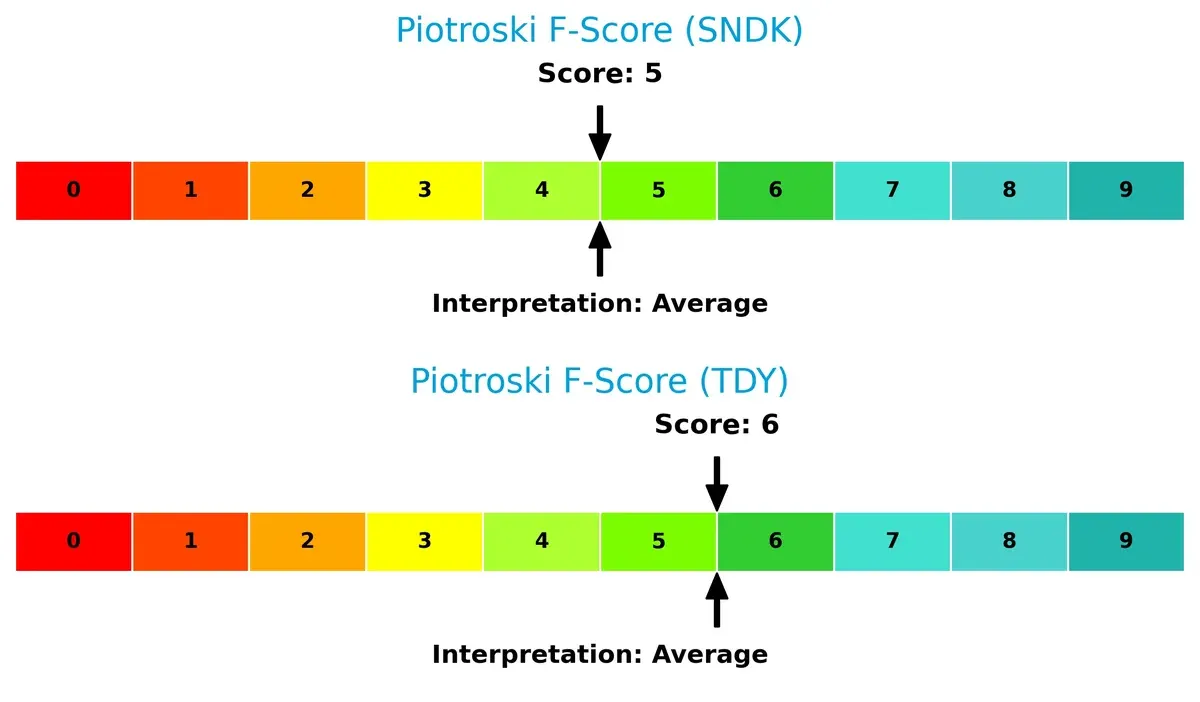
Financial Health: Quality of Operations
Teledyne scores a 6 and Sandisk a 5 on the Piotroski F-Score, indicating both firms hold average financial health. Teledyne edges ahead slightly, suggesting fewer internal red flags and stronger operational fundamentals:
How are the two companies positioned?
This section dissects Sandisk and Teledyne’s operational DNA by comparing revenue distribution and internal dynamics. The goal is to confront their economic moats and reveal which model delivers a more resilient competitive advantage today.
Revenue Segmentation: The Strategic Mix
The following visual comparison dissects how Sandisk Corporation and Teledyne Technologies diversify their income streams and where their primary sector bets lie:
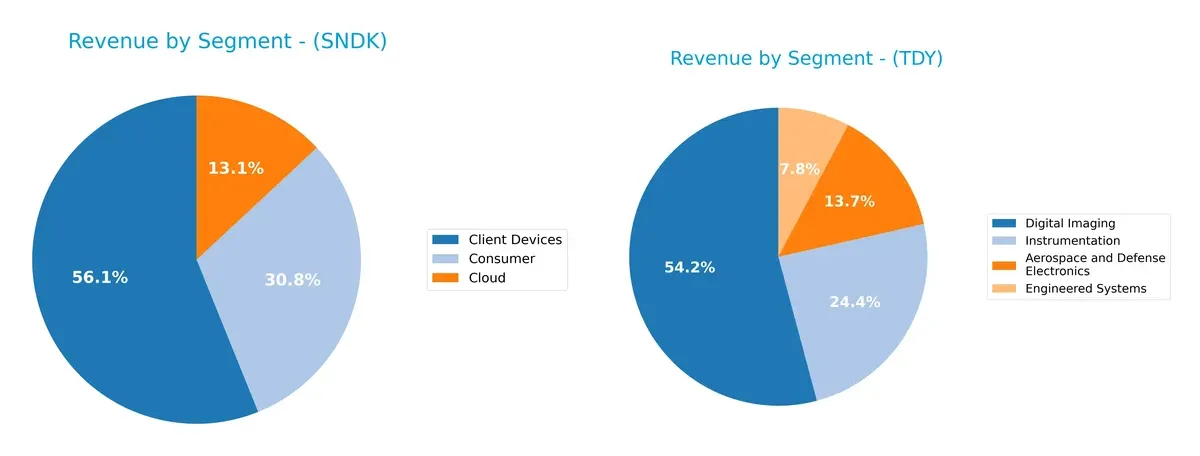
Sandisk leans heavily on Client Devices, generating $4.13B, with Consumer ($2.27B) and Cloud ($960M) trailing. This mix shows moderate diversification anchored by one dominant segment. Teledyne spreads revenue more evenly, led by Digital Imaging at $3.07B, followed by Instrumentation ($1.38B), Engineered Systems ($440M), and Aerospace and Defense Electronics ($777M). Teledyne’s balance reduces concentration risk and signals robust ecosystem lock-in. Sandisk’s focus risks volatility but could dominate device infrastructure.
Strengths and Weaknesses Comparison
This table compares the Strengths and Weaknesses of Sandisk Corporation and Teledyne Technologies Incorporated:
Sandisk Corporation Strengths
- Strong diversification with Client Devices, Consumer, and Cloud segments
- Solid presence in China and Asia markets
- Favorable quick ratio and low debt-to-assets ratio
- High fixed asset turnover indicates efficient asset use
Teledyne Technologies Incorporated Strengths
- Broad product segmentation across Aerospace, Digital Imaging, Engineered Systems, and Instrumentation
- Leading revenue in US and Europe markets
- Favorable net margin and strong interest coverage ratio
- Moderate debt levels with stable current and quick ratios
Sandisk Corporation Weaknesses
- Negative profitability metrics with net margin, ROE, and ROIC below zero
- High WACC signals expensive capital costs
- Negative interest coverage ratio is a red flag
- No dividend yield and slightly unfavorable overall ratios
Teledyne Technologies Incorporated Weaknesses
- ROE is below industry expectations despite positive net margin
- P/E ratio appears elevated relative to peers
- Lower asset turnover suggests less efficient revenue generation
- No dividend yield and some neutral financial ratios
Overall, Sandisk shows strong market diversification and asset efficiency but suffers from severe profitability and capital cost issues. Teledyne demonstrates better profitability and financial health, though it faces challenges in equity returns and asset utilization. These factors will shape each company’s strategic priorities moving forward.
The Moat Duel: Analyzing Competitive Defensibility
A structural moat is the only reliable shield protecting long-term profits from the relentless erosion of competition. Let’s dissect the moats of two tech hardware giants:
Sandisk Corporation: Cost Advantage in Flash Storage
Sandisk leverages a cost advantage through scale in NAND flash manufacturing. However, its financials reveal declining ROIC and shrinking profitability, signaling a weakening moat. New product launches in 2026 must reverse this trend or risk further erosion.
Teledyne Technologies Incorporated: Diversified Technology Moat
Teledyne’s moat stems from diversified, high-tech instrumentation and aerospace segments, driving stable margins and growing ROIC. Unlike Sandisk, Teledyne’s profitability improves with steady expansion into defense and industrial markets, suggesting a deepening moat in 2026.
Verdict: Cost Leadership vs. Diversification Strength
Teledyne’s diversified technology moat is wider and deepening, while Sandisk’s cost advantage weakens amid value destruction. Teledyne is better positioned to defend and grow its market share in 2026.
Which stock offers better returns?
The past year showed strong upward momentum for both stocks, with Sandisk Corporation surging dramatically and Teledyne Technologies demonstrating steady gains supported by increasing trading volume.
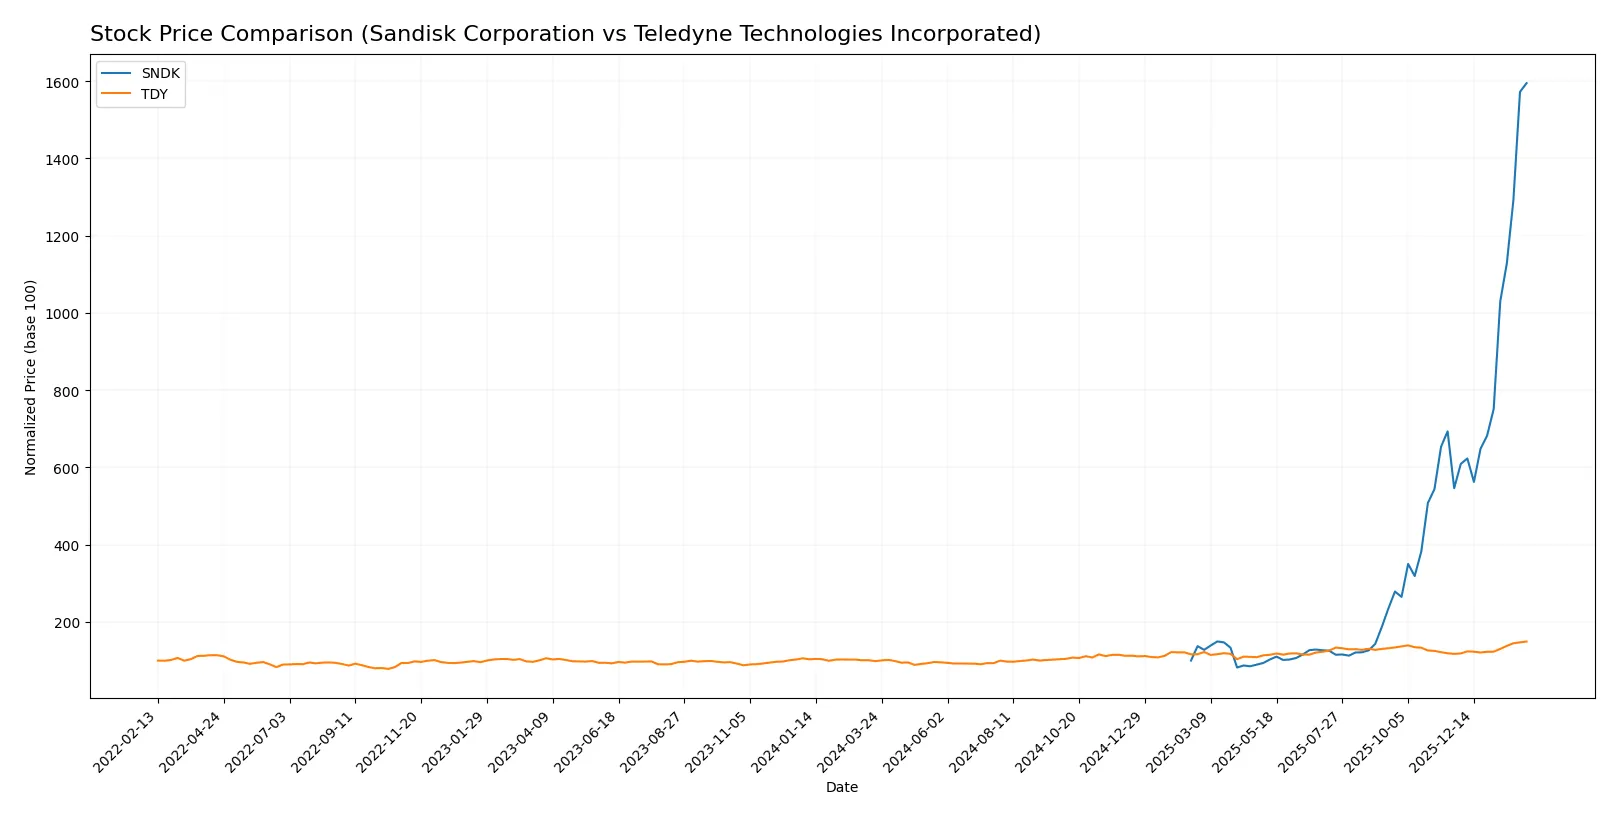
Trend Comparison
Sandisk Corporation’s stock price rose 1494.95% over the past year, showing a bullish trend with accelerating growth and high volatility, hitting a high of 584.55 and a low of 30.11.
Teledyne Technologies gained 51.7% in the same period, also bullish with acceleration but lower volatility, reaching a high of 629.73 and a low of 374.64.
Sandisk’s stock delivered significantly higher returns and stronger acceleration compared to Teledyne, outperforming in market performance over the analyzed 12-month period.
Target Prices
Analysts present a bullish target consensus for both Sandisk Corporation and Teledyne Technologies Incorporated.
| Company | Target Low | Target High | Consensus |
|---|---|---|---|
| Sandisk Corporation | 220 | 1000 | 675 |
| Teledyne Technologies Incorporated | 599 | 720 | 638.5 |
The consensus target prices for Sandisk and Teledyne imply upside potential of 15% and 1.5%, respectively, versus current prices of 584.55 and 629.73 USD. Analysts expect moderate growth aligned with sector trends.

Don’t Let Luck Decide Your Entry Point
Optimize your entry points with our advanced ProRealTime indicators. You’ll get efficient buy signals with precise price targets for maximum performance. Start outperforming now!
How do institutions grade them?
Sandisk Corporation Grades
The following table summarizes recent grades assigned to Sandisk Corporation by major institutions.
| Grading Company | Action | New Grade | Date |
|---|---|---|---|
| Barclays | Maintain | Equal Weight | 2026-02-02 |
| Citigroup | Maintain | Buy | 2026-02-02 |
| Jefferies | Maintain | Buy | 2026-01-30 |
| Wedbush | Maintain | Outperform | 2026-01-30 |
| RBC Capital | Maintain | Sector Perform | 2026-01-30 |
| Goldman Sachs | Maintain | Buy | 2026-01-30 |
| Morgan Stanley | Maintain | Overweight | 2026-01-30 |
| Cantor Fitzgerald | Maintain | Overweight | 2026-01-30 |
| Citigroup | Maintain | Buy | 2026-01-20 |
| Wells Fargo | Maintain | Equal Weight | 2026-01-15 |
Teledyne Technologies Incorporated Grades
Below is a summary of recent grades issued by reputable grading companies for Teledyne Technologies Incorporated.
| Grading Company | Action | New Grade | Date |
|---|---|---|---|
| Barclays | Maintain | Equal Weight | 2026-01-22 |
| Stifel | Maintain | Buy | 2026-01-22 |
| Needham | Maintain | Buy | 2026-01-22 |
| Citigroup | Maintain | Neutral | 2026-01-13 |
| Barclays | Maintain | Equal Weight | 2026-01-12 |
| Barclays | Maintain | Equal Weight | 2025-10-23 |
| Needham | Maintain | Buy | 2025-10-23 |
| Stifel | Maintain | Buy | 2025-10-23 |
| Morgan Stanley | Maintain | Equal Weight | 2025-10-15 |
| UBS | Maintain | Buy | 2025-07-24 |
Which company has the best grades?
Sandisk consistently receives more Buy, Outperform, and Overweight grades than Teledyne, which has more Equal Weight and Neutral ratings. This suggests stronger institutional confidence in Sandisk’s near-term outlook, potentially influencing investor sentiment positively.
Risks specific to each company
The following categories identify critical pressure points and systemic threats facing Sandisk Corporation and Teledyne Technologies in the 2026 market environment:
1. Market & Competition
Sandisk Corporation
- Faces intense competition in NAND flash storage, a volatile tech segment with rapid innovation cycles.
Teledyne Technologies Incorporated
- Operates in diverse industrial markets, balancing defense and commercial sectors, reducing pure tech exposure risk.
2. Capital Structure & Debt
Sandisk Corporation
- Maintains low debt-to-equity (0.22) and debt-to-assets (15.7%), but interest coverage is negative, signaling potential liquidity strain.
Teledyne Technologies Incorporated
- Shows healthy leverage ratios (D/E 0.24) with strong interest coverage (19.47), indicating solid ability to service debt.
3. Stock Volatility
Sandisk Corporation
- Exhibits extremely high beta (4.8), exposing shareholders to sharp price swings and elevated market risk.
Teledyne Technologies Incorporated
- Beta near 1.0 suggests stock moves closely with the market, offering more stable price behavior.
4. Regulatory & Legal
Sandisk Corporation
- Operates under standard tech sector regulations, with no major legal red flags reported.
Teledyne Technologies Incorporated
- Faces complex regulatory environments in defense and aerospace, requiring compliance vigilance.
5. Supply Chain & Operations
Sandisk Corporation
- Vulnerable to semiconductor supply chain disruptions given reliance on NAND technology components.
Teledyne Technologies Incorporated
- Diverse operations across instrumentation and aerospace mitigate supply chain concentration risks.
6. ESG & Climate Transition
Sandisk Corporation
- ESG considerations less prominent but faces pressure to improve sustainability in semiconductor manufacturing.
Teledyne Technologies Incorporated
- Increasing focus on energy-efficient products and compliance with evolving ESG standards in defense sector.
7. Geopolitical Exposure
Sandisk Corporation
- Primarily US-based with global sales; geopolitical tensions could impact supply chains and market access.
Teledyne Technologies Incorporated
- Significant exposure to US defense contracts, which may be sensitive to geopolitical shifts and budget changes.
Which company shows a better risk-adjusted profile?
Sandisk’s highest risk is its extreme stock volatility and negative interest coverage, signaling financial instability. Teledyne’s primary risk lies in geopolitical and regulatory complexity, but it maintains stronger financial health and lower volatility. Teledyne offers a superior risk-adjusted profile, supported by stable leverage and more balanced market exposure. Sandisk’s recent 16% stock drop reflects market concerns over its operational and financial fragility.
Final Verdict: Which stock to choose?
Sandisk Corporation’s superpower lies in its strong liquidity and operational efficiency, evident in a robust current ratio and fixed asset turnover. However, its declining profitability and value destruction over recent years remain points of vigilance. It might suit aggressive growth portfolios willing to tolerate volatility for potential turnaround gains.
Teledyne Technologies Incorporated benefits from a strategic moat built on steady cash flow quality and a growing return on invested capital, despite a higher valuation. It offers a more stable profile relative to Sandisk, fitting well into Growth at a Reasonable Price (GARP) strategies seeking balance between growth and risk.
If you prioritize turnaround potential and operational efficiency, Sandisk presents an analytical scenario worth exploring despite its financial challenges. However, if you seek consistent profitability and improving capital returns with better stability, Teledyne outshines as the more prudent choice, though it commands a premium valuation.
Disclaimer: Investment carries a risk of loss of initial capital. The past performance is not a reliable indicator of future results. Be sure to understand risks before making an investment decision.
Go Further
I encourage you to read the complete analyses of Sandisk Corporation and Teledyne Technologies Incorporated to enhance your investment decisions: