Home > Comparison > Technology > TEL vs SNDK
The strategic rivalry between TE Connectivity Ltd. and Sandisk Corporation shapes the evolution of the technology hardware sector. TE Connectivity operates as a diversified industrial hardware provider with a broad global footprint, while Sandisk focuses on high-margin NAND flash storage solutions. This head-to-head pits industrial scale against specialized innovation. This analysis aims to identify which corporate strategy delivers superior risk-adjusted returns for a well-balanced portfolio in today’s volatile market environment.
Table of contents
Companies Overview
TE Connectivity and Sandisk Corporation stand as pillars in the hardware equipment sector, shaping global technology infrastructure.
TE Connectivity Ltd.: Global Leader in Connectivity Solutions
TE Connectivity dominates the hardware, equipment & parts industry with its connectivity and sensor solutions. Its core revenue stems from supplying terminals, connectors, sensors, and related components across transportation, industrial, and communications sectors. In 2026, TE focused strategically on expanding its footprint across 140 countries, emphasizing innovation in automotive and industrial connectivity.
Sandisk Corporation: Pioneer in Flash Storage Technology
Sandisk Corporation excels in the development and manufacture of NAND flash-based storage devices. Its revenue engine revolves around solid-state drives, embedded products, and removable memory cards. The company’s 2026 strategy prioritized scaling its flash technology leadership to meet rising demands in data storage and performance, catering primarily to consumer and enterprise markets.
Strategic Collision: Similarities & Divergences
Both firms operate in hardware but diverge sharply in focus: TE Connectivity builds a broad connectivity ecosystem spanning multiple industries, while Sandisk narrows in on flash memory innovation. They compete indirectly where storage interfaces meet connectivity solutions, particularly in data-centric devices. TE offers diversified industrial exposure; Sandisk presents a high-beta, tech-focused growth profile reflecting distinct risk and return dynamics.
Income Statement Comparison
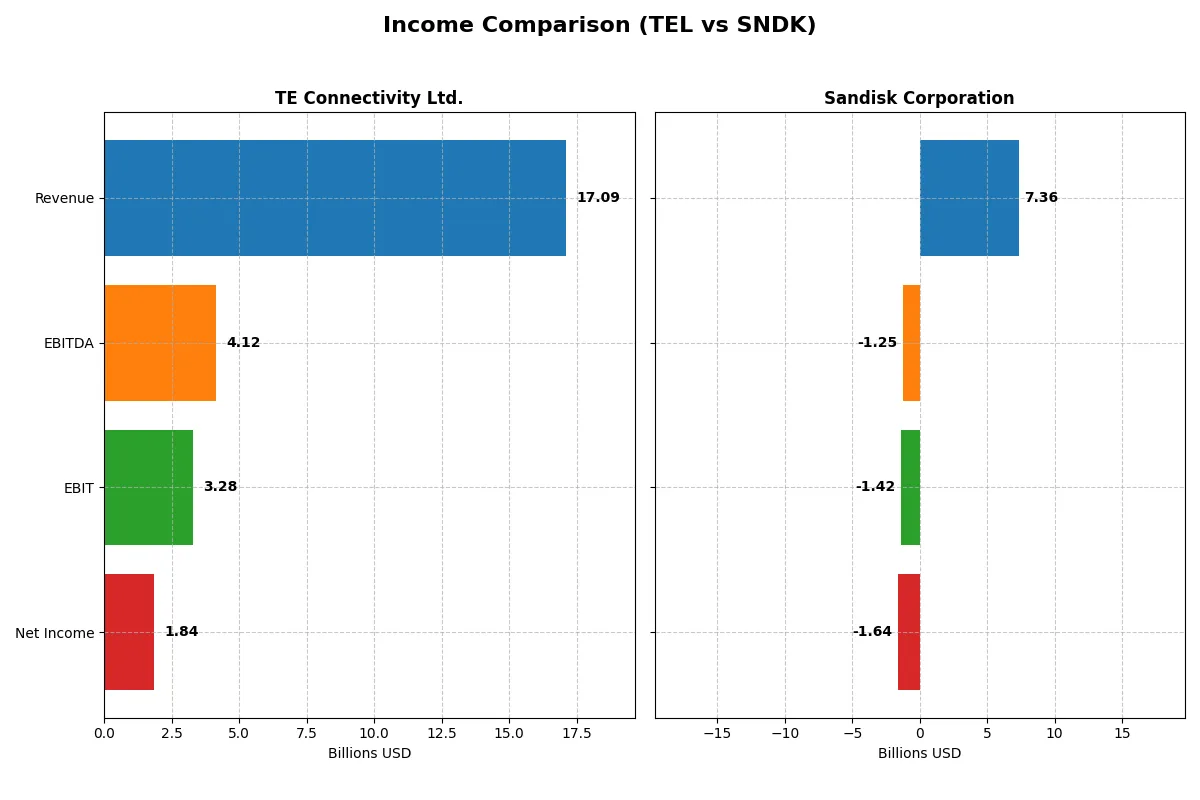
This data dissects the core profitability and scalability of both corporate engines to reveal who dominates the bottom line:
| Metric | TE Connectivity Ltd. (TEL) | Sandisk Corporation (SNDK) |
|---|---|---|
| Revenue | 17.1B | 7.4B |
| Cost of Revenue | 11.2B | 5.1B |
| Operating Expenses | 2.7B | 3.6B |
| Gross Profit | 5.9B | 2.2B |
| EBITDA | 4.1B | -1.3B |
| EBIT | 3.3B | -1.4B |
| Interest Expense | 77M | 63M |
| Net Income | 1.8B | -1.6B |
| EPS | 6.2 | -11.32 |
| Fiscal Year | 2025 | 2025 |
Income Statement Analysis: The Bottom-Line Duel
This income statement comparison reveals each company’s operational efficiency and profitability under current market conditions.
TE Connectivity Ltd. Analysis
TE Connectivity’s revenue rose steadily to $17.1B in 2025, with gross profit expanding to $5.9B. Its gross margin of 34.6% and net margin near 10.8% remain favorable. Despite a 7.9% revenue growth, net income declined 46.5% year-over-year, signaling margin pressure but solid operating income growth of 14.4%, reflecting operational efficiency.
Sandisk Corporation Analysis
Sandisk’s revenue grew 10.4% to $7.4B in 2025 with gross profit doubling to $2.2B, lifting gross margin to 30.1%. However, heavy operating losses pushed EBIT margin to -19.3% and net margin to -22.3%. Net income deepened its loss to -$1.64B, reflecting steep margin deterioration despite top-line gains, underscoring structural challenges.
Margin Resilience vs. Profitability Collapse
TE Connectivity sustains profitability with stable margins and operational momentum despite net income softness. Sandisk shows revenue growth but struggles with severe losses and negative margins. TE’s profile appeals more to investors seeking steady earnings, while Sandisk’s volatile losses present heightened risks.
Financial Ratios Comparison
These vital ratios act as a diagnostic tool to expose the underlying fiscal health, valuation premiums, and capital efficiency of the companies compared below:
| Ratios | TE Connectivity Ltd. (TEL) | Sandisk Corporation (SNDK) |
|---|---|---|
| ROE | 14.6% | -17.8% |
| ROIC | 8.8% | -11.9% |
| P/E | 35.0 | -4.17 |
| P/B | 5.12 | 0.74 |
| Current Ratio | 1.56 | 3.56 |
| Quick Ratio | 1.03 | 2.11 |
| D/E (Debt-to-Equity) | 0.52 | 0.22 |
| Debt-to-Assets | 26.1% | 15.7% |
| Interest Coverage | 41.7 | -21.9 |
| Asset Turnover | 0.68 | 0.57 |
| Fixed Asset Turnover | 3.96 | 11.88 |
| Payout Ratio | 43.6% | 0% |
| Dividend Yield | 1.25% | 0% |
| Fiscal Year | 2025 | 2025 |
Efficiency & Valuation Duel: The Vital Signs
Financial ratios act as the company’s DNA, revealing hidden risks and operational excellence that underpin shareholder value and market perception.
TE Connectivity Ltd.
TE Connectivity shows a solid 14.6% ROE and a favorable 10.8% net margin, signaling decent profitability. However, its P/E of 35 and P/B of 5.12 mark the stock as stretched relative to earnings and book value. The company offers a modest 1.25% dividend yield, balancing returns with consistent reinvestment in R&D for growth.
Sandisk Corporation
Sandisk struggles with a negative net margin (-22.3%) and ROE (-17.8%), reflecting operational losses and weak profitability. Yet, its low P/E (-4.17) and P/B (0.74) suggest the stock trades cheaply. Sandisk pays no dividend, focusing heavily on R&D (15.4% of revenue) to drive future turnaround, at the cost of short-term shareholder returns.
Premium Valuation vs. Operational Struggles
TE Connectivity balances reasonable profitability with a premium valuation, reflecting market confidence in its stable returns and growth investments. Sandisk offers a deep value profile but suffers from fundamental weakness and cash flow challenges. Investors seeking operational safety may prefer TE, while risk-tolerant profiles might consider Sandisk’s turnaround potential.
Which one offers the Superior Shareholder Reward?
I compare TE Connectivity Ltd. (TEL) and Sandisk Corporation (SNDK) on dividends and buybacks. TEL pays a 1.25% dividend yield, with a 44% payout ratio, well covered by free cash flow (77%). TEL also sustains robust buybacks, enhancing total returns. SNDK pays no dividend, suffers negative margins, and generates negative free cash flow, signaling operational distress. Its reinvestment focuses on survival, not shareholder returns. TEL’s distribution model is sustainable, balancing dividends and buybacks, while SNDK risks dilution. I conclude TEL offers a superior total return profile in 2026 for prudent investors.
Comparative Score Analysis: The Strategic Profile
The radar chart reveals the fundamental DNA and trade-offs of TE Connectivity Ltd. and Sandisk Corporation, highlighting their financial strengths and valuation contrasts:
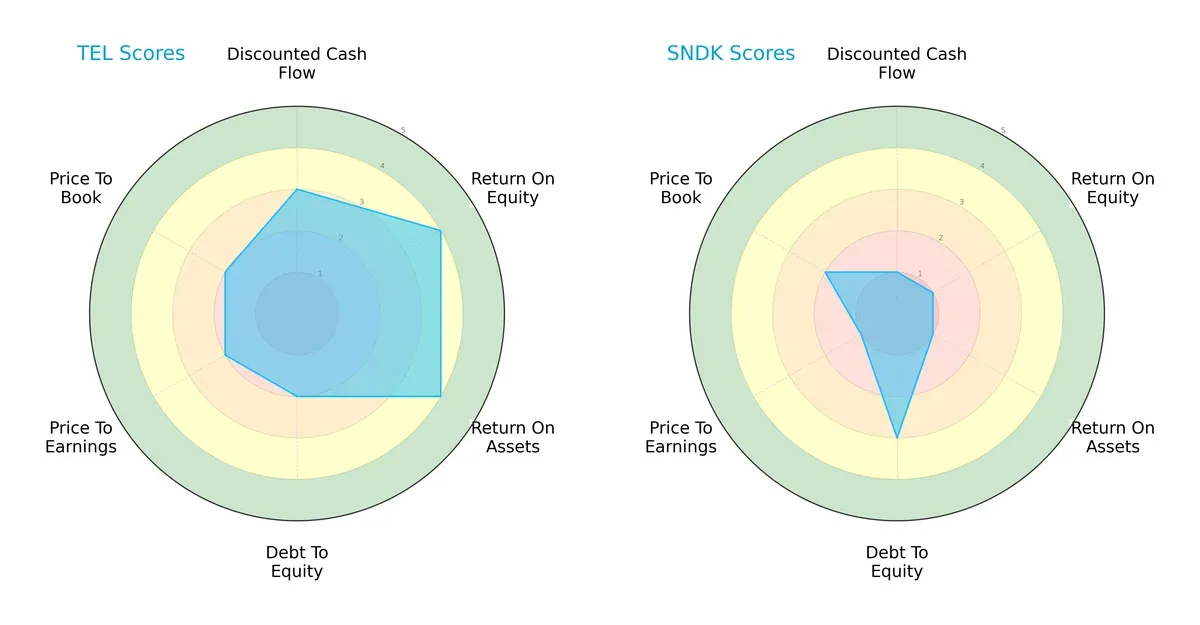
TE Connectivity Ltd. leads with a balanced profile, scoring well on ROE (4) and ROA (4), indicating efficient profit generation and asset use. Sandisk Corporation lags with very unfavorable scores in DCF (1), ROE (1), and ROA (1), signaling operational challenges. Sandisk’s moderate debt-to-equity (3) is a relative strength but cannot offset its valuation and profitability weaknesses.
Bankruptcy Risk: Solvency Showdown
TE Connectivity’s Altman Z-Score (5.3) and Sandisk’s (18.9) both land in the safe zone, signaling strong long-term solvency, though Sandisk’s exceptionally high score suggests an even lower bankruptcy risk this cycle:

Financial Health: Quality of Operations
TE Connectivity’s Piotroski F-Score of 7 reflects strong financial health and operational quality. Sandisk’s score of 5 is average, raising mild concerns about internal weaknesses relative to its peer:

How are the two companies positioned?
This section dissects TEL and SNDK’s operational DNA by comparing revenue distribution and internal dynamics. The goal is to confront their economic moats to identify which model offers the most resilient, sustainable advantage.
Revenue Segmentation: The Strategic Mix
This visual comparison dissects how TE Connectivity Ltd. and Sandisk Corporation diversify their income streams and where their primary sector bets lie:
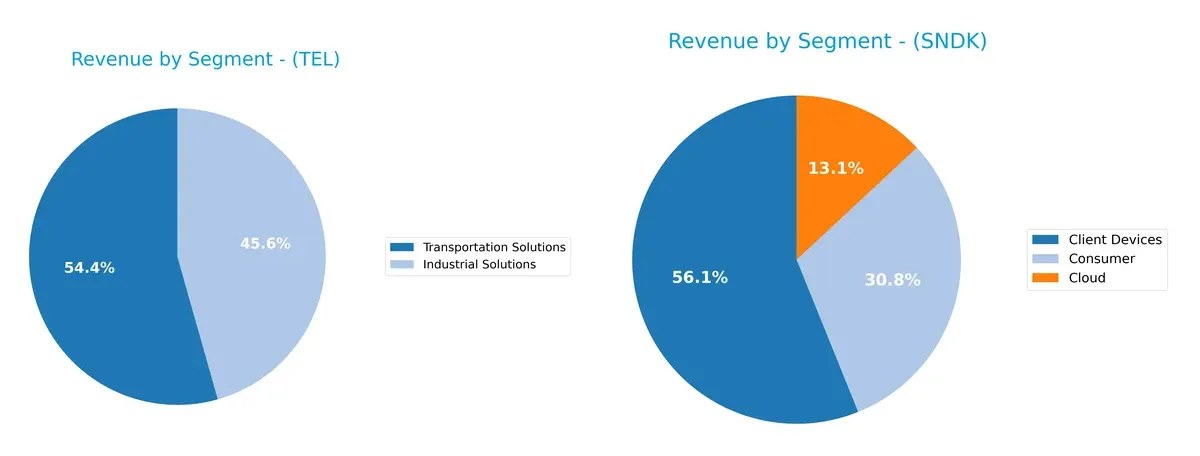
TE Connectivity leans heavily on Transportation Solutions, anchoring $9.4B in 2025, while Industrial Solutions add $7.9B. This signals a strong infrastructure focus with moderate diversification. Sandisk’s revenue pivots on Client Devices at $4.1B, with Consumer ($2.3B) and Cloud ($960M) trailing, showing a more balanced but tech-centric mix. TE’s concentration implies infrastructure dominance; Sandisk faces less segment risk but depends on volatile tech demand.
Strengths and Weaknesses Comparison
This table compares the strengths and weaknesses of TE Connectivity Ltd. and Sandisk Corporation:
TE Connectivity Ltd. Strengths
- Diverse segments including Industrial and Transportation
- Favorable net margin of 10.78%
- Strong interest coverage at 42.61
- Moderate debt-to-assets at 26.12%
- Global presence across multiple regions
- High fixed asset turnover of 3.96
Sandisk Corporation Strengths
- Favorable P/E ratio at -4.17 indicating undervaluation
- Low debt-to-equity ratio of 0.22
- Favorable PB ratio of 0.74
- Strong fixed asset turnover at 11.88
- Quick ratio at 2.11 indicates liquidity
- Presence in key regions like China and US
TE Connectivity Ltd. Weaknesses
- Unfavorable high P/E at 35.0
- Unfavorable PB ratio of 5.12
- Neutral ROIC of 8.82% below WACC of 9.07%
- Neutral ROE at 14.64%
- Asset turnover moderate at 0.68
- No dividend yield advantage
Sandisk Corporation Weaknesses
- Negative net margin of -22.31%
- Negative ROE at -17.81%
- Negative ROIC at -11.89%, WACC high at 25.93%
- Unfavorable current ratio of 3.56 (too high)
- Negative interest coverage at -22.48
- Zero dividend yield
TE Connectivity shows solid profitability and financial stability with a broad global footprint but faces valuation concerns. Sandisk struggles with profitability and coverage metrics despite strong asset utilization and attractive valuation multiples. These contrasts highlight differing strategic challenges and market positions.
The Moat Duel: Analyzing Competitive Defensibility
A structural moat is the only shield protecting long-term profits from relentless competitive erosion in dynamic markets:
TE Connectivity Ltd.: Intangible Assets and Global Scale
TE Connectivity leverages deep intangible assets and a vast global footprint, showing stable gross margins near 35%. However, declining ROIC warns of weakening capital efficiency in 2026.
Sandisk Corporation: Cost Advantage in NAND Flash Storage
Sandisk’s cost advantage in NAND flash tech fuels rapid revenue growth but suffers from severe margin erosion and negative EBIT, signaling a fragile moat amid fierce innovation pressures.
Intangible Assets vs. Cost Advantage in a Declining ROIC Landscape
Both firms face shrinking moats, but TE Connectivity’s diversified global reach gives it a wider competitive buffer than Sandisk’s cost-focused edge. TE is better positioned to defend market share despite margin pressures.
Which stock offers better returns?
Over the past 12 months, TE Connectivity Ltd. and Sandisk Corporation exhibited strong bullish trends with significant price gains, though recent trading dynamics reveal contrasting momentum shifts.

Trend Comparison
TE Connectivity Ltd. gained 55.07% over the last year, showing a bullish trend with decelerating price acceleration. Recent weeks reflect a mild -1.43% decline, signaling short-term neutral pressure.
Sandisk Corporation surged 1494.95% in the same period, driven by accelerating momentum. Recent gains accelerated further with a 191.88% rise, supported by strong buyer dominance and elevated volatility.
Sandisk significantly outperformed TE Connectivity, delivering the highest market returns. Its accelerating trend contrasts with TE’s deceleration and recent short-term softness.
Target Prices
Analysts present a bullish consensus for both TE Connectivity Ltd. and Sandisk Corporation.
| Company | Target Low | Target High | Consensus |
|---|---|---|---|
| TE Connectivity Ltd. | 238 | 306 | 270.29 |
| Sandisk Corporation | 220 | 1000 | 675 |
TE Connectivity’s consensus target of 270.29 exceeds its current price of 215.79, indicating upside potential. Sandisk’s consensus target at 675 shows a significant premium over its current 584.55, reflecting strong analyst optimism despite recent volatility.

Don’t Let Luck Decide Your Entry Point
Optimize your entry points with our advanced ProRealTime indicators. You’ll get efficient buy signals with precise price targets for maximum performance. Start outperforming now!
How do institutions grade them?
The following tables summarize recent institutional grades for TE Connectivity Ltd. and Sandisk Corporation:
TE Connectivity Ltd. Grades
Here are the latest grades assigned by reputable firms for TE Connectivity Ltd.:
| Grading Company | Action | New Grade | Date |
|---|---|---|---|
| Oppenheimer | Upgrade | Outperform | 2026-01-27 |
| Barclays | Maintain | Overweight | 2026-01-23 |
| Wells Fargo | Maintain | Equal Weight | 2026-01-22 |
| Truist Securities | Maintain | Hold | 2026-01-22 |
| UBS | Maintain | Buy | 2026-01-14 |
| Truist Securities | Maintain | Hold | 2025-12-19 |
| Wells Fargo | Maintain | Equal Weight | 2025-12-09 |
| Barclays | Maintain | Overweight | 2025-11-21 |
| Truist Securities | Maintain | Hold | 2025-11-21 |
| TD Cowen | Maintain | Buy | 2025-11-17 |
Sandisk Corporation Grades
The table below shows recent grades from well-known institutions for Sandisk Corporation:
| Grading Company | Action | New Grade | Date |
|---|---|---|---|
| Barclays | Maintain | Equal Weight | 2026-02-02 |
| Citigroup | Maintain | Buy | 2026-02-02 |
| Jefferies | Maintain | Buy | 2026-01-30 |
| Wedbush | Maintain | Outperform | 2026-01-30 |
| RBC Capital | Maintain | Sector Perform | 2026-01-30 |
| Goldman Sachs | Maintain | Buy | 2026-01-30 |
| Morgan Stanley | Maintain | Overweight | 2026-01-30 |
| Cantor Fitzgerald | Maintain | Overweight | 2026-01-30 |
| Citigroup | Maintain | Buy | 2026-01-20 |
| Wells Fargo | Maintain | Equal Weight | 2026-01-15 |
Which company has the best grades?
Sandisk Corporation consistently receives higher grades such as Buy and Outperform from several firms. TE Connectivity’s grades range from Hold to Outperform but lean towards Hold and Equal Weight. Investors may view Sandisk’s stronger consensus grades as a signal of better near-term confidence.
Risks specific to each company
The following categories identify the critical pressure points and systemic threats facing both firms in the 2026 market environment:
1. Market & Competition
TE Connectivity Ltd.
- Faces moderate competition in diverse connectivity and sensor markets but benefits from broad industry exposure and stable demand.
Sandisk Corporation
- Operates in highly competitive NAND flash and storage markets with rapid innovation cycles and strong price pressures.
2. Capital Structure & Debt
TE Connectivity Ltd.
- Maintains a balanced debt-to-equity ratio at 0.52 and strong interest coverage of 42.61, indicating solid financial stability.
Sandisk Corporation
- Displays lower debt levels (DE 0.22) but suffers from negative interest coverage, signaling financial stress and potential liquidity issues.
3. Stock Volatility
TE Connectivity Ltd.
- Exhibits moderate volatility with beta of 1.235, reflecting typical sector risk and manageable price fluctuations.
Sandisk Corporation
- Experiences high volatility with beta near 4.8, exposing investors to significant market swings and elevated risk.
4. Regulatory & Legal
TE Connectivity Ltd.
- Operates globally with exposure to diverse regulatory environments but benefits from well-established compliance frameworks.
Sandisk Corporation
- Faces regulatory scrutiny in the US tech sector, with evolving data and storage regulations increasing legal risk.
5. Supply Chain & Operations
TE Connectivity Ltd.
- Benefits from a diversified global supply chain, reducing single-point failures and operational disruptions.
Sandisk Corporation
- Relies on specialized NAND flash supply chains vulnerable to semiconductor shortages and geopolitical disruption.
6. ESG & Climate Transition
TE Connectivity Ltd.
- Demonstrates moderate ESG integration with ongoing improvements in energy efficiency and sustainable product design.
Sandisk Corporation
- Has room to enhance ESG practices, particularly in managing electronic waste and energy-intensive manufacturing.
7. Geopolitical Exposure
TE Connectivity Ltd.
- Based in Switzerland with diversified international markets, moderately insulated from US-China trade tensions.
Sandisk Corporation
- US-based with significant exposure to China for manufacturing and sales, increasing geopolitical risk amid trade conflicts.
Which company shows a better risk-adjusted profile?
TE Connectivity faces manageable market and financial risks with solid capital structure and moderate volatility. Sandisk struggles with severe financial stress, high stock volatility, and concentrated geopolitical exposure. TE’s Altman Z-score of 5.3 and strong Piotroski score of 7 highlight robust financial health. Sandisk’s negative margins and interest coverage, plus beta near 4.8, signal elevated risk. TE Connectivity presents the superior risk-adjusted profile, supported by stable debt metrics and diversified operations, while Sandisk’s financial distress and geopolitical sensitivity remain key concerns.
Final Verdict: Which stock to choose?
TE Connectivity Ltd. (TEL) wields a superpower in operational efficiency and stable cash flow generation. Its disciplined capital allocation supports a solid balance sheet. A point of vigilance remains in its premium valuation multiples, which could temper near-term upside. TEL suits investors targeting steady, moderate growth in resilient sectors.
Sandisk Corporation (SNDK) boasts a strategic moat grounded in rapid revenue growth and innovative R&D investment. Its balance sheet shows conservative leverage, offering a safety cushion relative to TEL. However, ongoing profitability challenges and negative returns raise caution flags. SNDK fits well in portfolios focusing on high-risk, high-reward turnaround scenarios.
If you prioritize operational stability and consistent value creation, TEL emerges as the compelling choice due to its proven efficiency and financial resilience. However, if you seek aggressive growth potential with a tolerance for volatility, SNDK offers superior revenue acceleration and innovation momentum despite its current profitability headwinds.
Disclaimer: Investment carries a risk of loss of initial capital. The past performance is not a reliable indicator of future results. Be sure to understand risks before making an investment decision.
Go Further
I encourage you to read the complete analyses of TE Connectivity Ltd. and Sandisk Corporation to enhance your investment decisions: