Home > Comparison > Technology > SNDK vs SANM
The strategic rivalry between Sandisk Corporation and Sanmina Corporation shapes the Technology sector’s hardware landscape. Sandisk excels as a product-focused innovator in NAND flash storage, while Sanmina operates as a diversified contract manufacturer serving complex industrial and defense markets. This head-to-head reflects a contrast between specialized product leadership and integrated manufacturing scale. I will assess which business model offers superior risk-adjusted returns for diversified investors navigating ongoing sector volatility.
Table of contents
Companies Overview
Sandisk Corporation and Sanmina Corporation each hold significant positions in the technology hardware sector, shaping key industry segments.
Sandisk Corporation: NAND Flash Storage Pioneer
Sandisk leads as a developer and manufacturer of NAND flash-based storage devices, including solid state drives and removable cards. Its revenue stems from selling these high-performance memory solutions. In 2026, Sandisk focuses strategically on expanding its product portfolio and leveraging technological innovation within flash technology.
Sanmina Corporation: Integrated Manufacturing Solutions Leader
Sanmina operates primarily as a provider of integrated manufacturing and supply chain services for complex electronics. It generates revenue through end-to-end solutions from design to after-market support across diverse sectors like aerospace and communications. Its 2026 strategy emphasizes enhancing manufacturing execution software and expanding service offerings globally.
Strategic Collision: Similarities & Divergences
Both companies compete within the hardware and equipment space but diverge sharply in business models—Sandisk emphasizes proprietary flash memory products, while Sanmina relies on a broad manufacturing ecosystem. Their primary battleground lies in serving technology OEMs with either specialized components or comprehensive manufacturing services. This contrast defines distinct investment profiles: Sandisk’s innovation-driven growth versus Sanmina’s operational scale and service diversity.
Income Statement Comparison
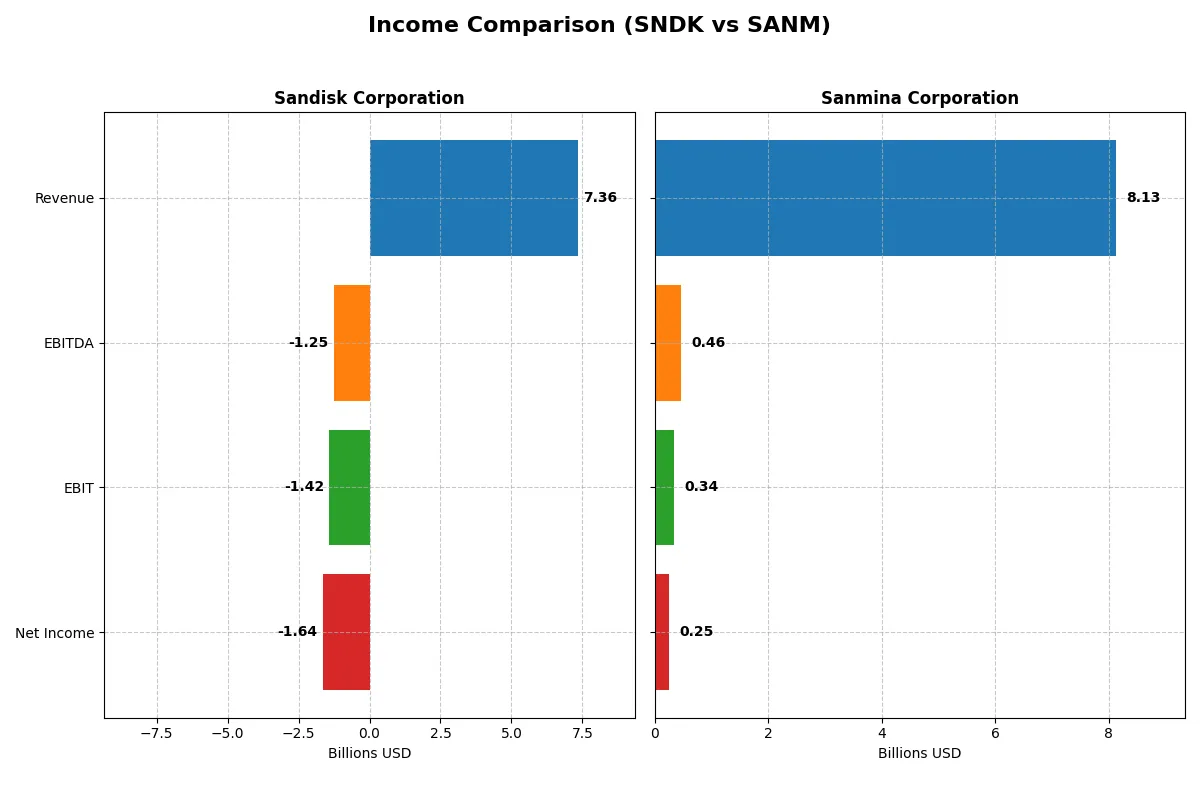
This data dissects the core profitability and scalability of both corporate engines to reveal who dominates the bottom line:
| Metric | Sandisk Corporation (SNDK) | Sanmina Corporation (SANM) |
|---|---|---|
| Revenue | 7.36B | 8.13B |
| Cost of Revenue | 5.14B | 7.41B |
| Operating Expenses | 3.59B | 362M |
| Gross Profit | 2.21B | 716M |
| EBITDA | -1.25B | 463M |
| EBIT | -1.42B | 344M |
| Interest Expense | 63M | 4.30M |
| Net Income | -1.64B | 246M |
| EPS | -11.32 | 4.56 |
| Fiscal Year | 2025 | 2025 |
Income Statement Analysis: The Bottom-Line Duel
This income statement comparison exposes which company runs its operations with greater efficiency and profitability over recent years.
Sandisk Corporation Analysis
Sandisk’s revenue declined 25% from 2022 to 2025 but rebounded 10% in the latest year to $7.35B. Despite growing gross profit by 106% year-over-year, it posted a steep net loss of $-1.64B in 2025, reflecting a negative net margin of -22%. Its operating inefficiencies and high expenses eroded bottom-line momentum significantly.
Sanmina Corporation Analysis
Sanmina’s revenue grew steadily by 21% overall, reaching $8.13B in 2025 with a moderate 8.8% gross margin. It achieved a positive net income of $246M in 2025, maintaining a 3% net margin. Although EBIT dipped slightly last year, the company sustains consistent profitability and modest margin expansion, signaling stable operational control.
Steady Profitability vs. Volatile Losses
Sanmina outperforms Sandisk by maintaining profitability and steady revenue growth, while Sandisk suffers from severe margin contractions and large net losses. For investors, Sanmina’s profile offers a more reliable earnings foundation, whereas Sandisk’s steep losses reflect ongoing fundamental challenges.
Financial Ratios Comparison
These vital ratios act as a diagnostic tool to expose the underlying fiscal health, valuation premiums, and capital efficiency of these companies:
| Ratios | Sandisk Corporation (SNDK) | Sanmina Corporation (SANM) |
|---|---|---|
| ROE | -17.8% | 10.4% |
| ROIC | -11.9% | 9.0% |
| P/E | -4.17 | 25.59 |
| P/B | 0.74 | 2.67 |
| Current Ratio | 3.56 | 1.72 |
| Quick Ratio | 2.11 | 1.02 |
| D/E | 0.22 | 0.17 |
| Debt-to-Assets | 15.7% | 6.7% |
| Interest Coverage | -21.9 | 82.5 |
| Asset Turnover | 0.57 | 1.39 |
| Fixed Asset Turnover | 11.88 | 11.91 |
| Payout ratio | 0% | 0% |
| Dividend yield | 0% | 0% |
| Fiscal Year | 2025 | 2025 |
Efficiency & Valuation Duel: The Vital Signs
Ratios act as a company’s DNA, revealing hidden risks and operational excellence that shape investor confidence and portfolio decisions.
Sandisk Corporation
Sandisk struggles with negative profitability, posting a -17.81% ROE and -22.31% net margin, signaling operational challenges. Its valuation appears attractive with a P/E of -4.17 and P/B of 0.74, indicating a potentially undervalued stock. Sandisk does not pay dividends, focusing instead on reinvestment through R&D at 15.4% of revenue.
Sanmina Corporation
Sanmina delivers modest profitability, with a 10.45% ROE and 3.03% net margin, reflecting cautious operational efficiency. The stock trades at a stretched P/E of 25.59 and a neutral P/B of 2.67, suggesting premium valuation. Despite no dividends, Sanmina’s strong free cash flow and low debt support shareholder value through financial stability and growth.
Valuation Stress Test: Undervaluation vs. Operational Resilience
Sanmina offers a better balance of operational efficiency and financial health, with fewer red flags than Sandisk’s negative returns. Investors seeking stability amid modest growth may prefer Sanmina, while those focusing on value and turnaround potential might watch Sandisk more closely.
Which one offers the Superior Shareholder Reward?
I see Sandisk Corporation (SNDK) pays no dividends and faces negative free cash flow, signaling reinvestment struggles. Its buybacks are negligible, undermining shareholder returns. Sanmina Corporation (SANM) also skips dividends but generates positive free cash flow (8.6B in 2025) and executes modest buybacks. SANM’s distribution model balances growth with capital return, unlike SNDK’s loss-heavy stance. Historically, firms with stable FCF and disciplined buybacks like SANM outperform peers. I conclude SANM offers a more sustainable and attractive total return profile in 2026.
Comparative Score Analysis: The Strategic Profile
The radar chart reveals the fundamental DNA and trade-offs of Sandisk Corporation and Sanmina Corporation, highlighting their financial strengths and vulnerabilities:
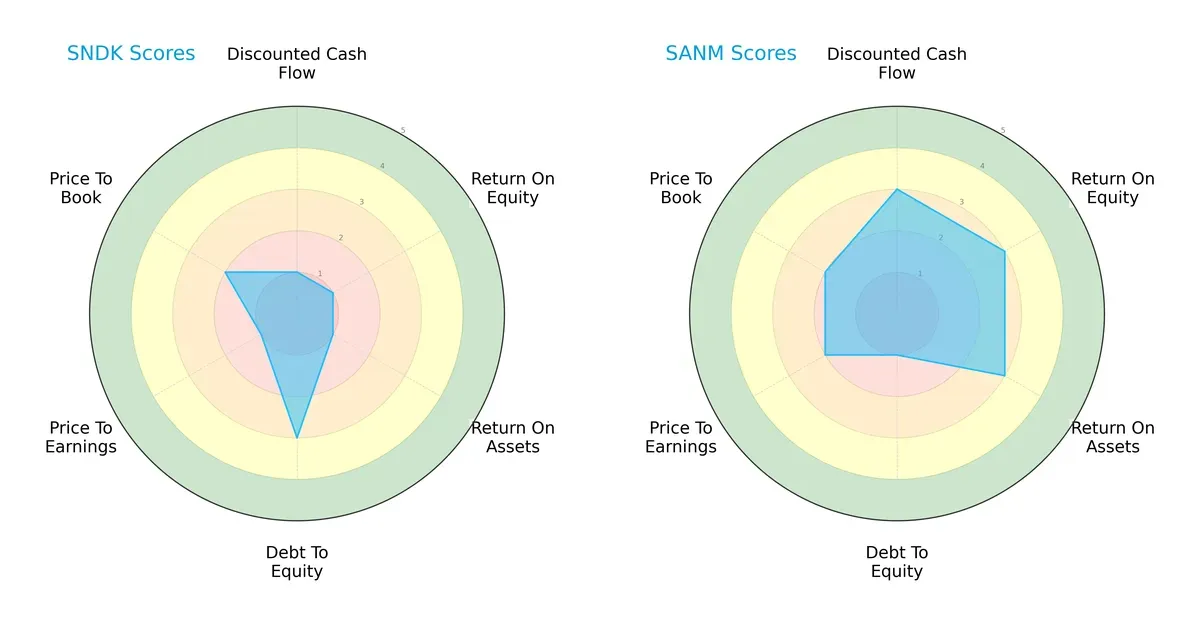
Sanmina leads comfortably in operational efficiency with strong DCF, ROE, and ROA scores, reflecting better capital allocation and asset use. Sandisk shows moderate debt management but struggles with profitability and valuation metrics. Sanmina’s profile is more balanced, while Sandisk relies on a defensive debt position amid weak earnings.
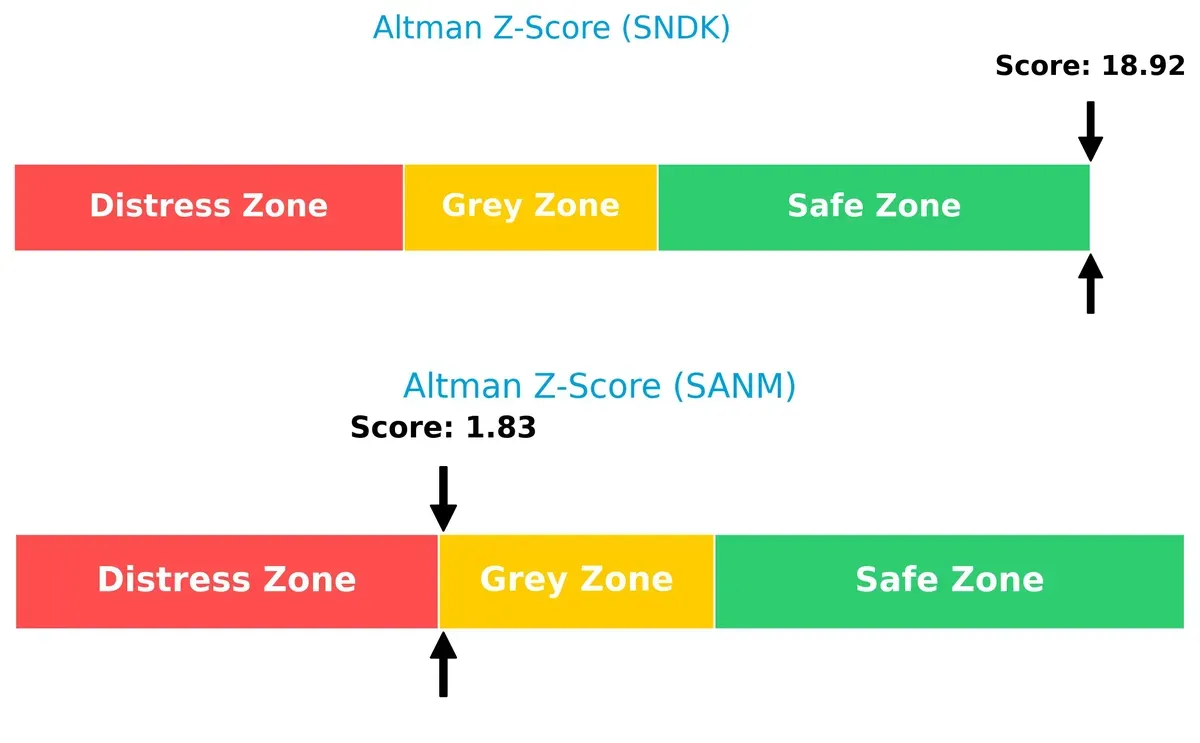
Bankruptcy Risk: Solvency Showdown
Sandisk’s Altman Z-Score of 18.9 places it firmly in the safe zone, signaling robust long-term survival potential. Sanmina’s score of 1.8 situates it in the grey zone, indicating moderate bankruptcy risk in this economic cycle:
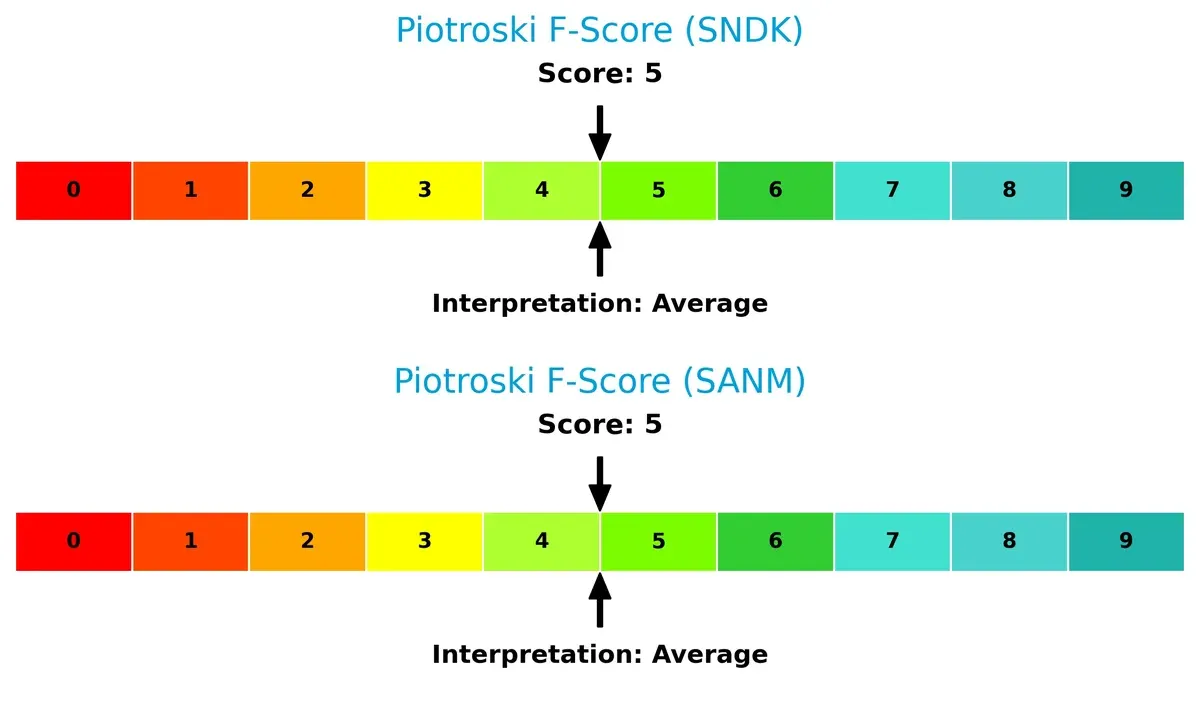
Financial Health: Quality of Operations
Both companies score a 5 on the Piotroski F-Score, reflecting average financial health. Neither shows acute red flags, but this middling score suggests room for operational improvement to strengthen their investment cases:
How are the two companies positioned?
This section dissects Sandisk and Sanmina’s operational DNA by comparing revenue distribution and internal dynamics, including strengths and weaknesses. The goal is to confront their economic moats and identify which model offers the most resilient, sustainable advantage today.
Revenue Segmentation: The Strategic Mix
This visual comparison dissects how Sandisk Corporation and Sanmina Corporation diversify their income streams and reveals where their primary sector bets lie:
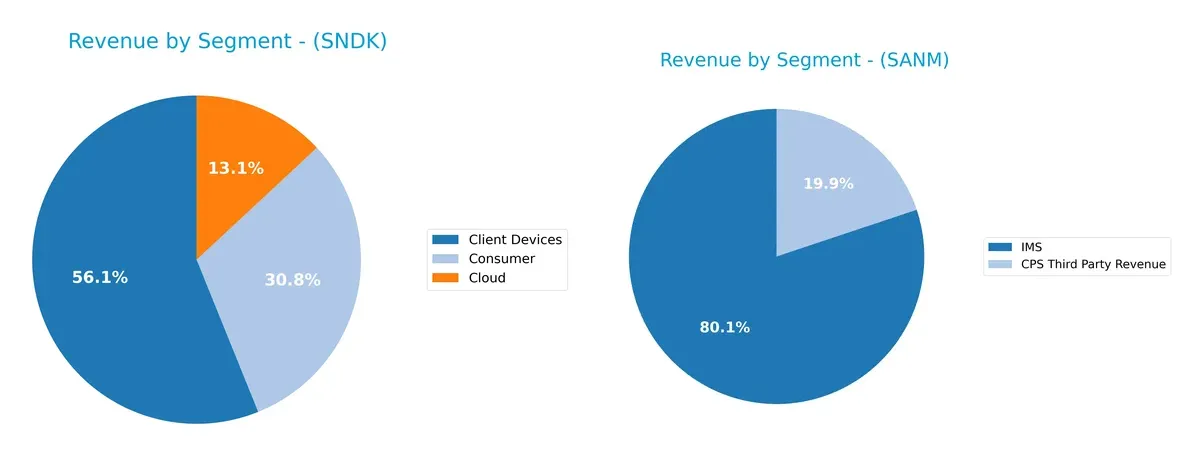
Sandisk anchors its revenue with Client Devices at $4.13B, supplemented by Consumer at $2.27B and Cloud at $960M, showing moderate diversification. Sanmina, however, pivots heavily on its IMS segment at $6.51B, dwarfing its CPS Third Party Revenue at $1.62B. Sandisk’s mix suggests balanced exposure across end markets, while Sanmina’s dominance in IMS implies concentration risk but also infrastructure leadership in manufacturing services.
Strengths and Weaknesses Comparison
This table compares the Strengths and Weaknesses of Sandisk Corporation and Sanmina Corporation:
Sandisk Corporation Strengths
- Diverse revenue streams across Client Devices, Cloud, and Consumer segments
- Strong global presence with significant sales in China, EMEA, and US
- Favorable quick ratio and low debt-to-assets indicate solid liquidity and conservative leverage
- High fixed asset turnover shows efficient asset use
Sanmina Corporation Strengths
- Balanced revenue from CPS Third Party and IMS segments offering diversification
- Favorable current and quick ratios signal good short-term financial health
- Strong interest coverage underlines ability to service debt comfortably
- Broad geographic diversification across Americas, Asia Pacific, and EMEA
- Consistent fixed asset turnover highlights operational efficiency
Sandisk Corporation Weaknesses
- Negative net margin, ROE, and ROIC reflect profitability challenges
- High WACC suggests costly capital structure
- Unfavorable interest coverage raises solvency concerns
- Zero dividend yield may deter income-focused investors
Sanmina Corporation Weaknesses
- Slightly positive but low net margin indicates thin profitability
- PE ratio is relatively high, possibly overvalued
- Zero dividend yield limits shareholder income
- ROE and ROIC remain neutral, showing moderate capital efficiency
Sandisk’s key strengths lie in its diversified product lines and global market penetration, but profitability and capital cost issues weigh heavily. Sanmina demonstrates healthier liquidity and operational efficiency, supported by geographic and segment diversification, yet profitability margins and valuation metrics warrant monitoring. Both companies face distinct financial challenges that shape their strategic priorities.
The Moat Duel: Analyzing Competitive Defensibility
A structural moat is the only reliable shield protecting long-term profits from relentless competitive erosion. Let’s examine how Sandisk and Sanmina defend their turf:
Sandisk Corporation: Intangible Assets Driving Innovation
Sandisk’s moat stems from proprietary NAND flash technology and brand strength, evident in stable gross margins despite heavy R&D. Yet, declining ROIC signals margin pressure and eroding value in 2026.
Sanmina Corporation: Cost Advantage and Scale Efficiency
Sanmina leverages manufacturing scale and integrated supply chains, generating positive margins and modest ROIC stability. This cost moat supports steady revenue growth and positions it well for industrial expansion.
Verdict: Proprietary Tech vs. Manufacturing Scale
Sandisk’s intangible asset moat is deeper but currently under siege, with profitability shrinking. Sanmina’s cost advantage is narrower but more sustainable. I see Sanmina better poised to defend market share in 2026.
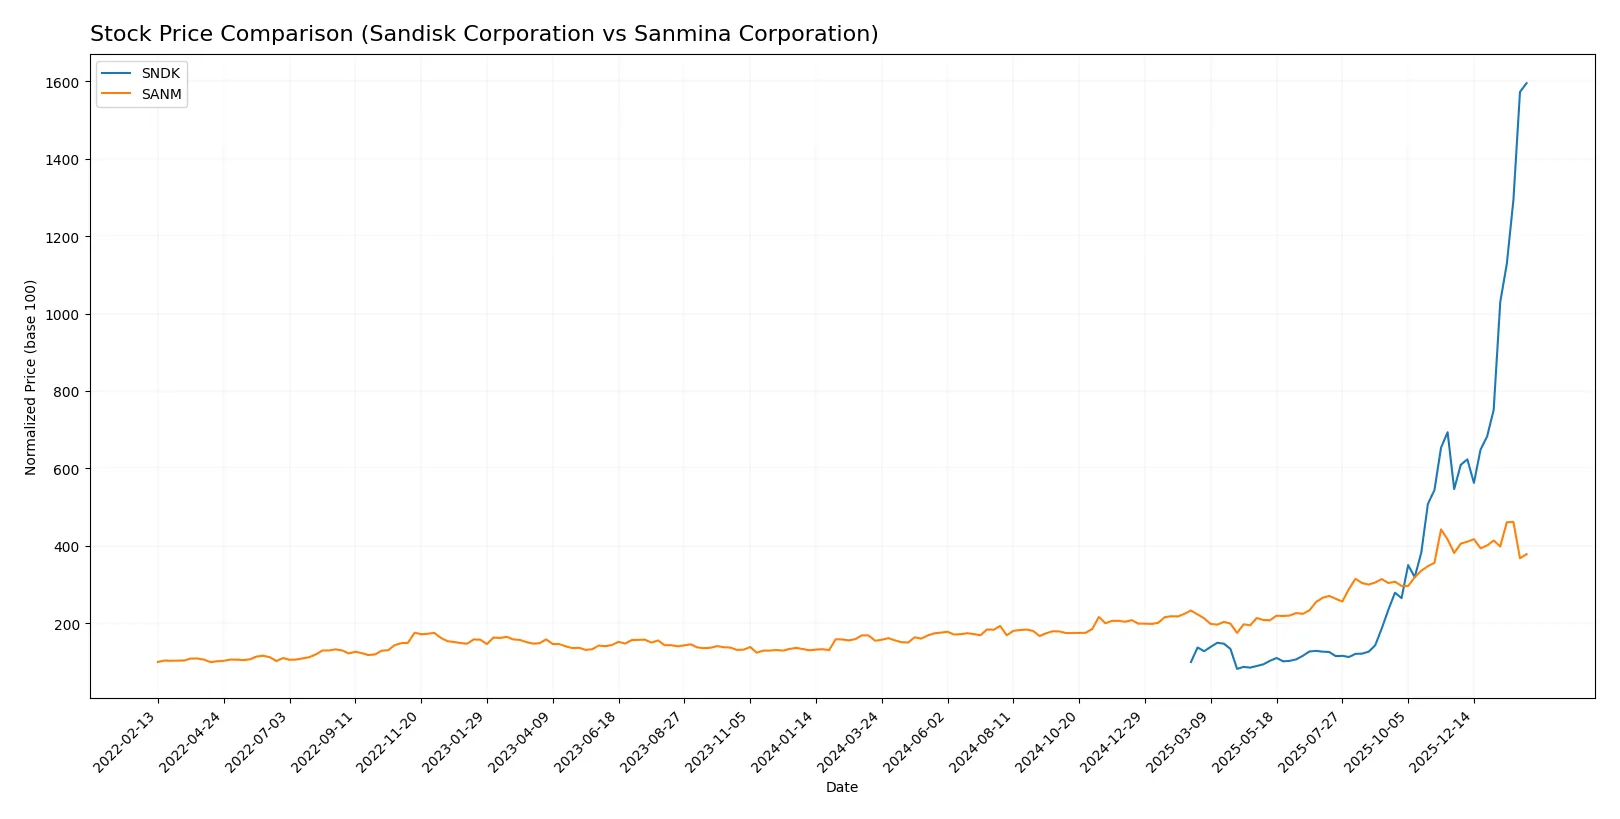
Which stock offers better returns?
Over the past 12 months, Sandisk Corporation’s stock soared with strong acceleration, while Sanmina Corporation’s price rose more modestly and recently flattened, reflecting contrasting momentum and trading dynamics.
Trend Comparison
Sandisk’s stock gained 1494.95% over the past year, exhibiting a bullish trend with accelerating momentum and a high volatility level (std deviation 139.16). The price peaked at 584.55 and bottomed at 30.11.
Sanmina’s stock increased 144.41% over the same period, maintaining a bullish but decelerating trend. Volatility remained moderate (std deviation 32.15), with a peak of 177.83 and a low of 57.79. The recent trend showed a slight negative change of -0.81%.
Comparing both, Sandisk delivered the highest market performance with a significantly stronger price appreciation and accelerating bullish momentum over the last 12 months.
Target Prices
Analysts present a wide target price range for Sandisk Corporation and a firm target for Sanmina Corporation.
| Company | Target Low | Target High | Consensus |
|---|---|---|---|
| Sandisk Corporation | 220 | 1000 | 675 |
| Sanmina Corporation | 200 | 200 | 200 |
Sandisk’s consensus target at 675 suggests upside from the current 585 price, reflecting optimism despite volatility. Sanmina’s fixed target of 200 signals modest growth potential above its 146 stock price.

Don’t Let Luck Decide Your Entry Point
Optimize your entry points with our advanced ProRealTime indicators. You’ll get efficient buy signals with precise price targets for maximum performance. Start outperforming now!
How do institutions grade them?
Sandisk Corporation Grades
Here are the latest grades given to Sandisk Corporation by various institutions:
| Grading Company | Action | New Grade | Date |
|---|---|---|---|
| Barclays | Maintain | Equal Weight | 2026-02-02 |
| Citigroup | Maintain | Buy | 2026-02-02 |
| Jefferies | Maintain | Buy | 2026-01-30 |
| Wedbush | Maintain | Outperform | 2026-01-30 |
| RBC Capital | Maintain | Sector Perform | 2026-01-30 |
| Goldman Sachs | Maintain | Buy | 2026-01-30 |
| Morgan Stanley | Maintain | Overweight | 2026-01-30 |
| Cantor Fitzgerald | Maintain | Overweight | 2026-01-30 |
| Citigroup | Maintain | Buy | 2026-01-20 |
| Wells Fargo | Maintain | Equal Weight | 2026-01-15 |
Sanmina Corporation Grades
Below are the recent grades assigned to Sanmina Corporation by recognized grading firms:
| Grading Company | Action | New Grade | Date |
|---|---|---|---|
| Argus Research | Maintain | Buy | 2026-01-28 |
| B of A Securities | Maintain | Neutral | 2025-07-11 |
| B of A Securities | Maintain | Neutral | 2025-06-09 |
| B of A Securities | Upgrade | Neutral | 2025-01-29 |
| Craig-Hallum | Maintain | Hold | 2024-11-05 |
| Craig-Hallum | Downgrade | Hold | 2024-04-30 |
| Sidoti & Co. | Upgrade | Buy | 2022-11-08 |
| Sidoti & Co. | Upgrade | Buy | 2022-11-07 |
| Sidoti & Co. | Downgrade | Neutral | 2022-10-31 |
| Sidoti & Co. | Downgrade | Neutral | 2022-10-30 |
Which company has the best grades?
Sandisk Corporation consistently earns stronger grades than Sanmina Corporation, with multiple ‘Buy,’ ‘Outperform,’ and ‘Overweight’ ratings. This suggests investors might view Sandisk as having more favorable prospects or stability. Sanmina’s grades trend closer to ‘Neutral’ or ‘Hold,’ indicating more cautious sentiment.
Risks specific to each company
The following categories identify the critical pressure points and systemic threats facing both firms in the 2026 market environment:
1. Market & Competition
Sandisk Corporation
- Faces intense competition in NAND flash and storage solutions, with price pressure and rapid tech cycles.
Sanmina Corporation
- Operates in diverse manufacturing sectors, but competition in EMS and components compresses margins.
2. Capital Structure & Debt
Sandisk Corporation
- Low debt-to-equity (0.22) and debt-to-assets (15.7%) indicate conservative leverage.
Sanmina Corporation
- Even lower leverage (debt-to-equity 0.17, debt-to-assets 6.7%), reflecting financial prudence.
3. Stock Volatility
Sandisk Corporation
- High beta of 4.8 signals extreme volatility and high market risk.
Sanmina Corporation
- Beta near 1.0 suggests stock moves closely with market, less volatile.
4. Regulatory & Legal
Sandisk Corporation
- Exposure to tech sector regulations and IP litigation risks.
Sanmina Corporation
- Faces regulatory scrutiny in defense, aerospace, and medical verticals.
5. Supply Chain & Operations
Sandisk Corporation
- Dependent on NAND flash supply, vulnerable to semiconductor shortages.
Sanmina Corporation
- Complex global supply chains with multi-industry exposure increase operational risk.
6. ESG & Climate Transition
Sandisk Corporation
- Pressure to reduce carbon footprint in manufacturing NAND products.
Sanmina Corporation
- Must address ESG in diverse sectors, including aerospace and automotive.
7. Geopolitical Exposure
Sandisk Corporation
- US-based but semiconductor supply chains exposed to Asia-Pacific tensions.
Sanmina Corporation
- Global footprint with significant exposure to geopolitical risks in supply and defense contracts.
Which company shows a better risk-adjusted profile?
Sandisk’s most impactful risk is its extreme stock volatility paired with unprofitable operations and negative returns. Sanmina’s key risk lies in complex supply chains and geopolitical exposure, despite steadier margins and better financial stability. Sanmina shows a stronger risk-adjusted profile, supported by a safer Altman Z-score and moderate leverage. Sandisk’s -22% net margin and 4.8 beta raise significant alarms about financial health and market risk.
Final Verdict: Which stock to choose?
Sandisk Corporation’s superpower lies in its impressive liquidity and efficient fixed asset utilization, marking it as a potential turnaround candidate. However, its persistent value destruction and declining profitability warrant caution. It fits best in aggressive growth portfolios willing to embrace elevated risk for possible high rewards.
Sanmina Corporation benefits from a solid operational moat supported by consistent cash flow and strong asset turnover. Its financial stability surpasses Sandisk’s, offering a more balanced risk profile. This makes it suitable for GARP investors seeking steady growth without excessive volatility.
If you prioritize high-risk, high-reward scenarios, Sandisk could be compelling due to its bullish price momentum and liquidity strength despite profitability challenges. However, if you seek steadier returns with better operational efficiency and financial resilience, Sanmina offers superior stability and a more moderate growth trajectory.
Disclaimer: Investment carries a risk of loss of initial capital. The past performance is not a reliable indicator of future results. Be sure to understand risks before making an investment decision.
Go Further
I encourage you to read the complete analyses of Sandisk Corporation and Sanmina Corporation to enhance your investment decisions: