Salesforce, Inc. (CRM) and Workday, Inc. (WDAY) are two leading players in the software application industry, focusing on enterprise cloud solutions. Both companies serve overlapping markets with innovative platforms that streamline business operations and customer engagement. Their distinct approaches to technology and growth strategies make them worthy of comparison. In this article, I will help you determine which company presents the most compelling investment opportunity in 2026.

Table of contents
Companies Overview
I will begin the comparison between Salesforce and Workday by providing an overview of these two companies and their main differences.
Salesforce Overview
Salesforce, Inc. specializes in customer relationship management technology designed to connect companies with their customers globally. Its Customer 360 platform facilitates collaboration to deliver personalized experiences. Salesforce offers diverse services including sales, service, marketing, commerce, analytics through Tableau, and integration with MuleSoft. The company serves multiple industries and supports business app development for various company sizes, emphasizing a comprehensive, cloud-based ecosystem.
Workday Overview
Workday, Inc. provides enterprise cloud applications focused on financial management and human capital management (HCM). Its solutions enable organizations to manage accounting, financial processes, supplier contracts, employee lifecycle, and workforce planning. Workday also incorporates analytics and machine learning to improve operational insights and efficiency. The company targets professional services, healthcare, education, government, and retail sectors, positioning itself as a key cloud provider for enterprise resource planning and workforce management.
Key similarities and differences
Both Salesforce and Workday operate within the software application industry, offering cloud-based solutions tailored to business needs. They serve a broad range of industries and emphasize analytics and integration capabilities. However, Salesforce focuses more on customer relationship management and commerce platforms, while Workday specializes in financial and human capital management applications. Their employee counts differ significantly, with Salesforce employing over 76K staff compared to Workday’s 20K, reflecting scale and scope differences in their business models.
Income Statement Comparison
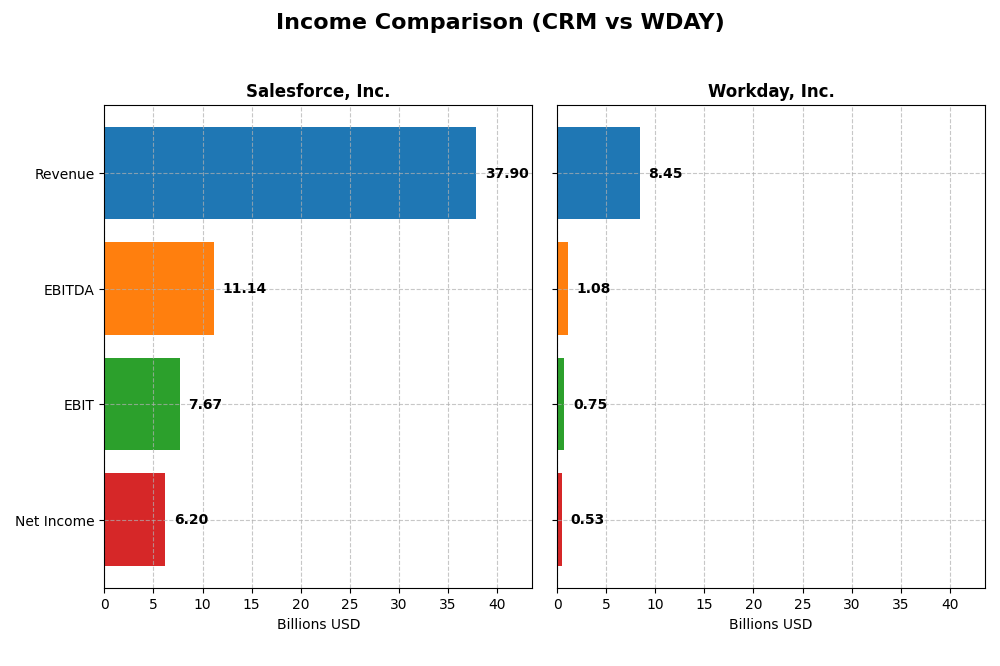
The table below presents a side-by-side comparison of key income statement metrics for Salesforce, Inc. and Workday, Inc. for fiscal year 2025, illustrating their financial performance.
| Metric | Salesforce, Inc. (CRM) | Workday, Inc. (WDAY) |
|---|---|---|
| Market Cap | 219B | 50B |
| Revenue | 37.9B | 8.45B |
| EBITDA | 11.1B | 1.08B |
| EBIT | 7.67B | 752M |
| Net Income | 6.2B | 526M |
| EPS | 6.44 | 1.98 |
| Fiscal Year | 2025 | 2025 |
Income Statement Interpretations
Salesforce, Inc.
Salesforce’s revenue and net income steadily increased from 21.3B in 2021 to 37.9B and 6.2B in 2025, respectively. Margins remained strong, with a favorable gross margin of 77.2% and net margin of 16.4% in 2025. The latest year showed solid revenue growth of 8.7% and a notable net income rise of 37.8%, reflecting improved profitability.
Workday, Inc.
Workday’s revenue rose from 4.3B in 2021 to 8.4B in 2025, with net income swinging from losses to 526M in 2025. Margins were mixed; gross margin was favorable at 75.5%, but the EBIT margin was neutral at 8.9%. The recent year showed strong revenue growth of 16.4%, though net margin and EPS declined, indicating margin pressure despite top-line gains.
Which one has the stronger fundamentals?
Salesforce demonstrates more consistent profitability with higher and stable margins, alongside sustained growth in revenue and net income. Workday’s revenue growth is stronger overall, with impressive net income gains but recent margin and EPS declines. Salesforce’s higher margin stability and favorable income growth suggest more robust fundamentals in the current comparison.
Financial Ratios Comparison
The table below presents the most recent key financial ratios for Salesforce, Inc. (CRM) and Workday, Inc. (WDAY) for fiscal year 2025, allowing a direct comparison of their operational efficiency, profitability, liquidity, and leverage.
| Ratios | Salesforce, Inc. (CRM) | Workday, Inc. (WDAY) |
|---|---|---|
| ROE | 10.1% | 5.8% |
| ROIC | 7.9% | 2.7% |
| P/E | 53.0 | 132.2 |
| P/B | 5.37 | 7.69 |
| Current Ratio | 1.06 | 1.85 |
| Quick Ratio | 1.06 | 1.85 |
| D/E (Debt-to-Equity) | 0.19 | 0.37 |
| Debt-to-Assets | 11.1% | 18.7% |
| Interest Coverage | 26.5 | 3.64 |
| Asset Turnover | 0.37 | 0.47 |
| Fixed Asset Turnover | 7.03 | 5.36 |
| Payout Ratio | 24.8% | 0% |
| Dividend Yield | 0.47% | 0% |
Interpretation of the Ratios
Salesforce, Inc.
Salesforce exhibits a mix of strong and weak ratios in 2025, with favorable metrics like net margin at 16.35% and strong interest coverage of 28.18, while facing unfavorable high PE and PB ratios. The current and quick ratios show adequate liquidity. Dividend yield is low at 0.47%, indicating modest shareholder returns supported by cautious payout and buyback policies.
Workday, Inc.
Workday’s ratios reflect challenges with unfavorable returns on equity and invested capital, and a high PE ratio of 132.15, suggesting valuation concerns. However, liquidity ratios are favorable with a current ratio of 1.85. The company does not pay dividends, likely focusing on reinvestment and growth strategies instead of direct shareholder returns.
Which one has the best ratios?
Salesforce’s ratios are slightly more favorable overall, balancing profitability and liquidity with moderate leverage. Workday shows higher liquidity but weaker profitability and valuation metrics, resulting in a neutral stance. Salesforce’s better returns and interest coverage contrast with Workday’s growth-focused profile lacking dividend distribution.
Strategic Positioning
This section compares the strategic positioning of Salesforce, Inc. and Workday, Inc. including Market position, Key segments, and disruption:
Salesforce, Inc.
- Leading market cap of $219B with competitive pressure in cloud CRM software.
- Diverse revenue streams: Sales, Service, Marketing, Commerce, Platform, Analytics.
- Exposure to technological disruption through integration, analytics, and platform innovation.
Workday, Inc.
- Smaller market cap of $50B, competing in enterprise cloud applications.
- Concentrated on subscription services in financial and human capital management.
- Focus on cloud spend management and augmented analytics to enhance operations.
Salesforce, Inc. vs Workday, Inc. Positioning
Salesforce exhibits a diversified approach across multiple cloud-based CRM segments, while Workday concentrates on finance and HR cloud applications. Salesforce’s broad portfolio offers multiple revenue drivers, contrasting with Workday’s focused subscription model.
Which has the best competitive advantage?
Both companies have a slightly unfavorable MOAT, shedding value but improving profitability. Salesforce’s larger scale and diversified segments suggest a broader competitive positioning, whereas Workday’s narrower focus may limit its moat despite growth in ROIC.
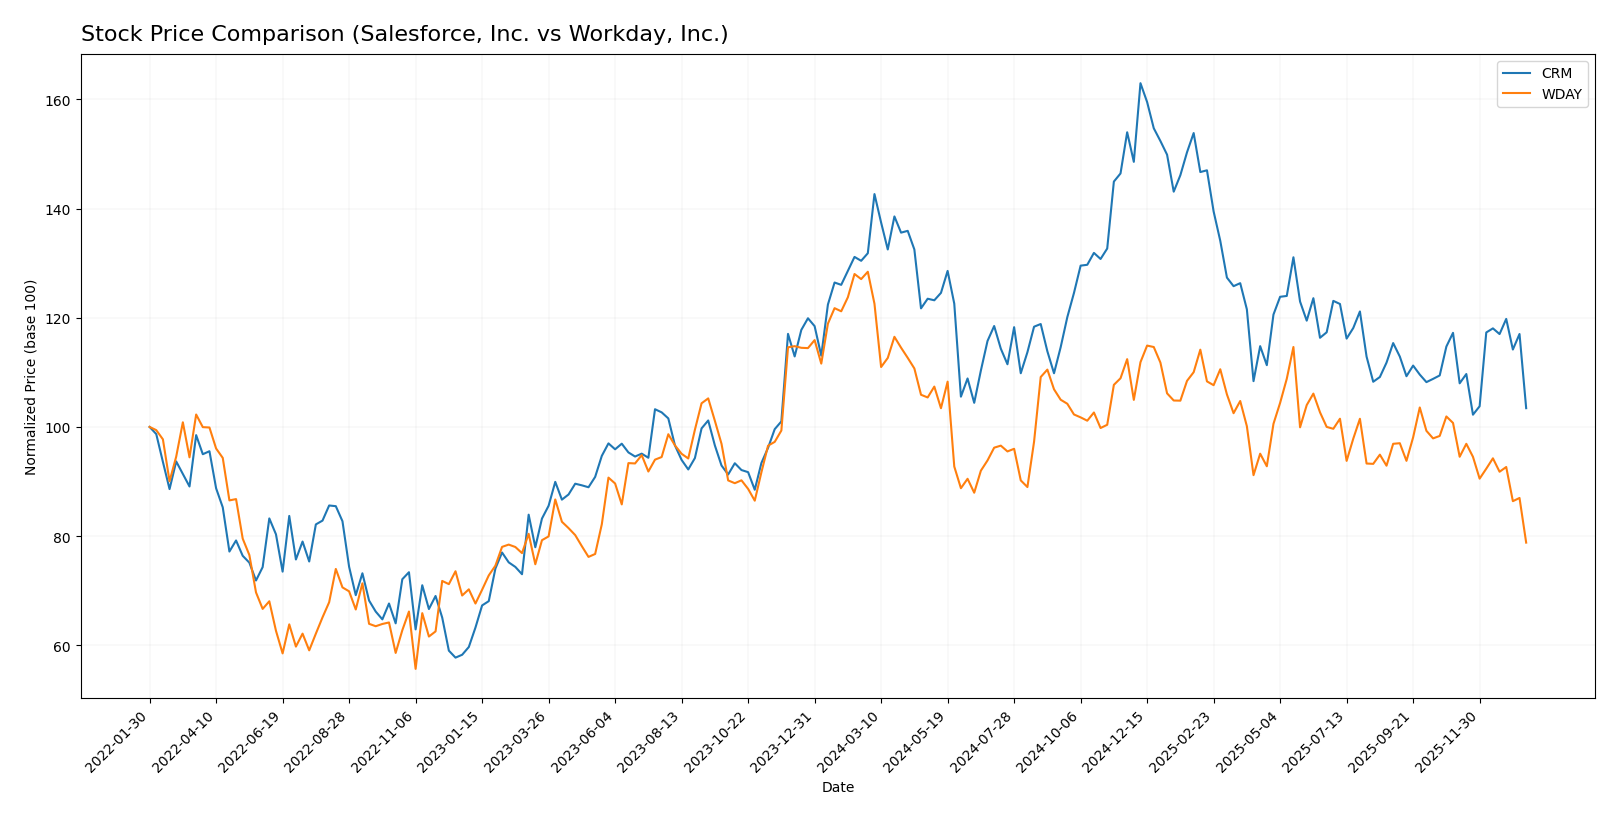
Stock Comparison
The stock price chart highlights significant bearish trends for both Salesforce, Inc. and Workday, Inc. over the past 12 months, with notable price declines and distinct trading volume dynamics.
Trend Analysis
Salesforce, Inc. experienced a 21.53% price decline over the past year, indicating a bearish trend with accelerating downward momentum and high volatility between $227.11 and $361.99. Recent months show a milder 11.77% decrease.
Workday, Inc. recorded a more pronounced 38.63% drop over the same period, confirming a bearish trend but with decelerating losses and moderate volatility between $187.71 and $305.88. Recent trading revealed a sharper 21.76% decline.
Comparing both, Salesforce, Inc. has delivered a better market performance with a smaller percentage loss and signs of trend stabilization, whereas Workday, Inc. shows deeper depreciation and stronger seller dominance in volume.
Target Prices
Analysts present a cautiously optimistic consensus for Salesforce, Inc. and Workday, Inc., suggesting potential upside from current prices.
| Company | Target High | Target Low | Consensus |
|---|---|---|---|
| Salesforce, Inc. | 400 | 250 | 324.17 |
| Workday, Inc. | 320 | 235 | 274.47 |
The consensus target prices for both companies exceed their current trading prices, indicating analyst expectations of moderate growth potential ahead. Salesforce’s target consensus of 324.17 is well above its current 229.18, while Workday’s 274.47 target consensus also suggests upside from its 186.89 price.
Analyst Opinions Comparison
This section compares analysts’ ratings and grades for Salesforce, Inc. and Workday, Inc.:
Rating Comparison
Salesforce, Inc. Rating
- Rating: B+, categorized as Very Favorable
- Discounted Cash Flow Score: 4, Favorable
- Return on Equity Score: 4, Favorable
- Return on Assets Score: 4, Favorable
- Debt To Equity Score: 3, Moderate
- Overall Score: 3, Moderate
Workday, Inc. Rating
- Rating: B-, categorized as Very Favorable
- Discounted Cash Flow Score: 4, Favorable
- Return on Equity Score: 3, Moderate
- Return on Assets Score: 3, Moderate
- Debt To Equity Score: 2, Moderate
- Overall Score: 2, Moderate
Which one is the best rated?
Based strictly on the provided data, Salesforce holds a higher rating (B+) and scores better on ROE, ROA, debt-to-equity, and overall score compared to Workday, which has a B- rating and generally lower scores.
Scores Comparison
Here is a comparison of the Altman Z-Score and Piotroski Score for Salesforce, Inc. and Workday, Inc.:
Salesforce, Inc. Scores
- Altman Z-Score: 5.26, indicating a safe financial zone with low bankruptcy risk.
- Piotroski Score: 7, classified as strong financial health.
Workday, Inc. Scores
- Altman Z-Score: 4.41, also in the safe zone with low bankruptcy risk.
- Piotroski Score: 6, considered average financial strength.
Which company has the best scores?
Salesforce shows a higher Altman Z-Score and a stronger Piotroski Score than Workday. Both are in the safe zone for bankruptcy risk, but Salesforce’s scores suggest better overall financial health based on the provided data.
Grades Comparison
This section presents a comparison of the latest grades assigned to Salesforce, Inc. and Workday, Inc. by reputable grading companies:
Salesforce, Inc. Grades
The following table summarizes recent grades from established financial institutions for Salesforce, Inc.:
| Grading Company | Action | New Grade | Date |
|---|---|---|---|
| Barclays | Maintain | Overweight | 2026-01-12 |
| RBC Capital | Maintain | Sector Perform | 2026-01-05 |
| Morgan Stanley | Maintain | Overweight | 2025-12-09 |
| Citigroup | Maintain | Neutral | 2025-12-08 |
| DA Davidson | Maintain | Neutral | 2025-12-05 |
| Citizens | Maintain | Market Outperform | 2025-12-04 |
| Deutsche Bank | Maintain | Buy | 2025-12-04 |
| Wedbush | Maintain | Outperform | 2025-12-04 |
| Northland Capital Markets | Maintain | Market Perform | 2025-12-04 |
| Canaccord Genuity | Maintain | Buy | 2025-12-04 |
The consensus for Salesforce shows a predominance of “Buy” and “Overweight” ratings, indicating a generally positive market outlook.
Workday, Inc. Grades
The following table presents recent grades from credible grading companies for Workday, Inc.:
| Grading Company | Action | New Grade | Date |
|---|---|---|---|
| Barclays | Maintain | Overweight | 2026-01-12 |
| RBC Capital | Maintain | Outperform | 2026-01-05 |
| TD Cowen | Maintain | Buy | 2025-11-26 |
| Needham | Maintain | Buy | 2025-11-26 |
| Barclays | Maintain | Overweight | 2025-11-26 |
| Keybanc | Maintain | Overweight | 2025-11-26 |
| JP Morgan | Maintain | Overweight | 2025-11-26 |
| UBS | Maintain | Neutral | 2025-11-26 |
| Citigroup | Maintain | Neutral | 2025-11-26 |
| Wells Fargo | Maintain | Overweight | 2025-11-26 |
Workday’s grades predominantly include “Overweight” and “Buy” ratings, reflecting a generally favorable recommendation from analysts.
Which company has the best grades?
Both Salesforce and Workday receive predominantly positive grades with consensus “Buy” ratings. Salesforce has more “Strong Buy” categorizations, while Workday displays a consistent “Overweight” trend. This suggests investors might view Salesforce as slightly more favored, potentially affecting portfolio decisions based on analyst confidence.
Strengths and Weaknesses
Here is a comparative overview of key strengths and weaknesses of Salesforce, Inc. (CRM) and Workday, Inc. (WDAY) based on their recent financial and operational data.
| Criterion | Salesforce, Inc. (CRM) | Workday, Inc. (WDAY) |
|---|---|---|
| Diversification | Highly diversified revenue streams across multiple clouds and services, with 2025 revenue exceeding $37B across 6 segments | Less diversified, heavily reliant on Subscription Services (~$7.7B in 2025) and Professional Services (~$728M) |
| Profitability | Net margin 16.35% (favorable), ROIC 7.95% (neutral), slightly unfavorable valuation ratios (PE 53.04, PB 5.37) | Lower profitability with net margin 6.23% (neutral), ROIC 2.73% (unfavorable), high valuation multiples (PE 132.15, PB 7.69) |
| Innovation | Strong innovation indicated by growing ROIC trend (+761.9%) despite currently shedding value | Also growing ROIC trend (+161.9%) but at a slower pace; shedding value but improving profitability |
| Global presence | Extensive global footprint supported by large-scale cloud platforms and services | Growing global presence but less extensive than CRM; primarily focused on cloud-based HR and financial management |
| Market Share | Leading market position in CRM and cloud solutions with substantial revenue growth and scale | Niche market leader in enterprise HR and finance cloud software, but smaller scale and market reach |
Salesforce demonstrates strong diversification and profitability with robust revenue growth across multiple segments, while Workday shows promising growth but remains more concentrated in fewer segments with lower profitability. Both face valuation challenges, and investors should weigh growth potential against the current value creation indicators.
Risk Analysis
Below is a comparative table highlighting key risks for Salesforce, Inc. (CRM) and Workday, Inc. (WDAY) based on the latest 2025 data:
| Metric | Salesforce, Inc. (CRM) | Workday, Inc. (WDAY) |
|---|---|---|
| Market Risk | Beta 1.27 indicates moderate volatility; P/E high at 53.0, suggesting sensitivity to market sentiment | Beta 1.14, less volatile than CRM; very high P/E at 132.1, indicating elevated valuation risk |
| Debt Level | Low debt-to-equity ratio of 0.19; strong interest coverage (28.2x) | Higher debt-to-equity at 0.37; lower interest coverage (6.6x) but still manageable |
| Regulatory Risk | Moderate, given global operations and data privacy regulations | Moderate, focus on cloud applications with compliance needs in multiple sectors |
| Operational Risk | Large scale with 76K employees; integration challenges post acquisitions (Slack, Tableau) | Smaller workforce (20K); dependency on continuous innovation in cloud services |
| Environmental Risk | Technology sector with low direct environmental impact; moderate risk from supply chain | Similar sector profile; increasing focus on sustainable cloud operations |
| Geopolitical Risk | Exposure to global markets, potential trade tensions | Also exposed internationally but less diversified than CRM |
In synthesis, market risk and valuation appear most impactful. Salesforce’s broader scale and moderate debt profile reduce financial risk, while Workday’s high valuation and higher leverage present more caution. Both face operational complexities tied to innovation and regulatory compliance in a competitive tech environment.
Which Stock to Choose?
Salesforce, Inc. (CRM) shows strong income growth with favorable margins and increasing profitability, alongside low debt levels and a solid B+ rating. Its financial ratios are slightly favorable, reflecting stable operations but some valuation concerns.
Workday, Inc. (WDAY) exhibits robust revenue growth and improving profitability, though with higher debt and less efficient capital use. Its financial ratios are neutral overall, and it holds a B- rating, indicating moderate financial strength with some valuation drawbacks.
Investors seeking relatively stable profitability and moderate risk might find Salesforce’s metrics more appealing, while those with a tolerance for higher variability and growth potential could view Workday’s profile as interesting; both companies show improving profitability but are currently shedding value.
Disclaimer: Investment carries a risk of loss of initial capital. The past performance is not a reliable indicator of future results. Be sure to understand risks before making an investment decision.
Go Further
I encourage you to read the complete analyses of Salesforce, Inc. and Workday, Inc. to enhance your investment decisions: