In the fast-evolving technology sector, Salesforce, Inc. (CRM) and Unity Software Inc. (U) stand out as innovators in software applications, each shaping distinct yet overlapping markets. Salesforce excels in customer relationship management with a comprehensive cloud platform, while Unity leads in interactive 3D content creation across multiple devices. This comparison explores their growth strategies and market positions to help you decide which company offers the most compelling investment opportunity today.
Table of contents
Companies Overview
I will begin the comparison between Salesforce, Inc. and Unity Software Inc. by providing an overview of these two companies and their main differences.
Salesforce Overview
Salesforce, Inc. is a leading provider of customer relationship management (CRM) technology aimed at connecting companies with their customers globally. Its Customer 360 platform supports sales, service, marketing, commerce, and analytics, enabling businesses to deliver personalized experiences. With a broad industry reach including financial services and healthcare, Salesforce offers scalable solutions and professional services through direct sales and partners. Headquartered in San Francisco, it employs over 76K people.
Unity Overview
Unity Software Inc. develops an interactive real-time 3D content platform used by creators and developers to produce and monetize 2D and 3D content across multiple devices such as mobiles, PCs, consoles, and AR/VR hardware. Its software targets artists, designers, engineers, and architects worldwide, with distribution via online stores, sales teams, and resellers across numerous countries. Based in San Francisco, Unity employs nearly 5K people and focuses on enabling interactive content creation.
Key similarities and differences
Both Salesforce and Unity operate in the technology sector under software application industries, headquartered in San Francisco, and listed on the NYSE. Salesforce focuses on CRM and enterprise customer solutions with a large workforce and broad industry applications, while Unity specializes in real-time 3D content creation platforms targeting interactive media developers with a smaller employee base. Their business models differ in market focus and product scope but share a technology-driven approach to serving global customers.
Income Statement Comparison
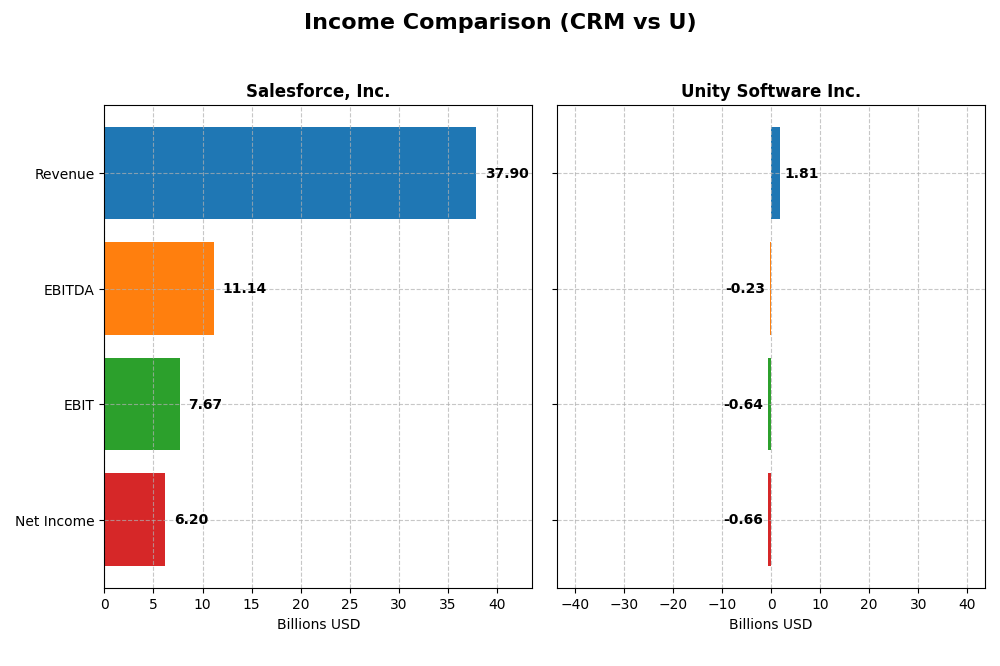
Below is a side-by-side comparison of the most recent full fiscal year income statement metrics for Salesforce, Inc. and Unity Software Inc.
| Metric | Salesforce, Inc. (CRM) | Unity Software Inc. (U) |
|---|---|---|
| Market Cap | 218.2B | 18.9B |
| Revenue | 37.9B | 1.81B |
| EBITDA | 11.1B | -235M |
| EBIT | 7.67B | -644M |
| Net Income | 6.20B | -664M |
| EPS | 6.44 | -1.68 |
| Fiscal Year | 2025 | 2024 |
Income Statement Interpretations
Salesforce, Inc.
Salesforce has shown strong revenue growth from $21.3B in 2021 to nearly $37.9B in 2025, with net income rising from $4.1B to $6.2B over the same period. Margins are generally favorable, with a gross margin of 77.19% and a net margin of 16.35% in 2025. The most recent year saw revenue growth of 8.72% and a significant 37.82% increase in net margin, indicating improving profitability.
Unity Software Inc.
Unity’s revenue increased from $772M in 2020 to $1.8B in 2024, though net income remained negative, with a loss of $664M in 2024 despite some improvement from prior years. The gross margin is favorable at 73.48%, but the EBIT margin is deeply negative at -35.49%. Revenue declined by 17.1% in the latest year, but EBIT and EPS showed some recovery, with EPS growth of 22.22%.
Which one has the stronger fundamentals?
Salesforce exhibits stronger fundamentals, supported by consistent revenue and net income growth, robust margins, and favorable income statement evaluations. Unity faces challenges with sustained net losses, negative EBIT margin, and recent revenue decline, despite some operational improvements. Overall, Salesforce’s financial performance and margin stability present a more favorable income statement profile.
Financial Ratios Comparison
This table presents the latest available financial ratios for Salesforce, Inc. and Unity Software Inc., enabling a side-by-side comparison of their key financial metrics as of fiscal year 2025 and 2024 respectively.
| Ratios | Salesforce, Inc. (CRM) FY 2025 | Unity Software Inc. (U) FY 2024 |
|---|---|---|
| ROE | 10.13% | -20.81% |
| ROIC | 7.95% | -12.78% |
| P/E | 53.04 | -13.40 |
| P/B | 5.37 | 2.79 |
| Current Ratio | 1.06 | 2.50 |
| Quick Ratio | 1.06 | 2.50 |
| D/E (Debt-to-Equity) | 0.19 | 0.74 |
| Debt-to-Assets | 11.07% | 34.94% |
| Interest Coverage | 26.49 | -32.08 |
| Asset Turnover | 0.37 | 0.27 |
| Fixed Asset Turnover | 7.03 | 18.35 |
| Payout ratio | 24.80% | 0% |
| Dividend yield | 0.47% | 0% |
Interpretation of the Ratios
Salesforce, Inc.
Salesforce shows a mix of strong and weak ratios. It has a favorable net margin at 16.35% and good interest coverage of 28.18, but elevated PE at 53.04 and PB at 5.37 are unfavorable, signaling potential valuation concerns. The company pays dividends with a low yield of 0.47%, reflecting conservative shareholder returns amid strong cash flow coverage.
Unity Software Inc.
Unity’s ratios indicate challenges, with unfavorable net margin (-36.63%), ROE (-20.81%), and interest coverage (-27.34). Its valuation appears attractive with a favorable negative PE, but high debt levels and zero dividend yield highlight risks. Unity prioritizes reinvestment and growth, explaining the absence of dividends and a focus on expanding its platform.
Which one has the best ratios?
Salesforce’s overall ratios are slightly favorable, balancing profitability and financial health despite valuation concerns. Unity’s profile is slightly unfavorable, burdened by negative profitability and cash flow issues despite strong liquidity. Based on the ratio evaluations, Salesforce presents a more stable financial footing compared to Unity.
Strategic Positioning
This section compares the strategic positioning of Salesforce and Unity, focusing on market position, key segments, and exposure to technological disruption:
Salesforce, Inc.
- Leading CRM provider with strong market cap and competitive pressure in software applications.
- Diverse segments: Sales, Service, Marketing, Commerce, Analytics, Integration, and Professional Services.
- Exposure through platform innovation and integration tools; potential disruption from evolving cloud and AI technologies.
Unity Software Inc.
- Smaller market cap, operating in interactive real-time 3D content software with higher beta.
- Concentrated on Create and Operate Solutions for 2D/3D content across multiple device platforms.
- Faces technological disruption risks in real-time 3D content, AR/VR, and platform monetization.
Salesforce vs Unity Positioning
Salesforce employs a diversified business model across multiple cloud services and platforms, benefiting from scale but facing broad competitive pressures. Unity focuses on niche interactive 3D content creation and operation, which is more specialized but may limit market breadth.
Which has the best competitive advantage?
Both companies are shedding value with negative ROIC compared to WACC. Salesforce shows improving profitability and a slightly unfavorable moat, while Unity’s declining ROIC indicates a very unfavorable moat and weaker competitive advantage.
Stock Comparison
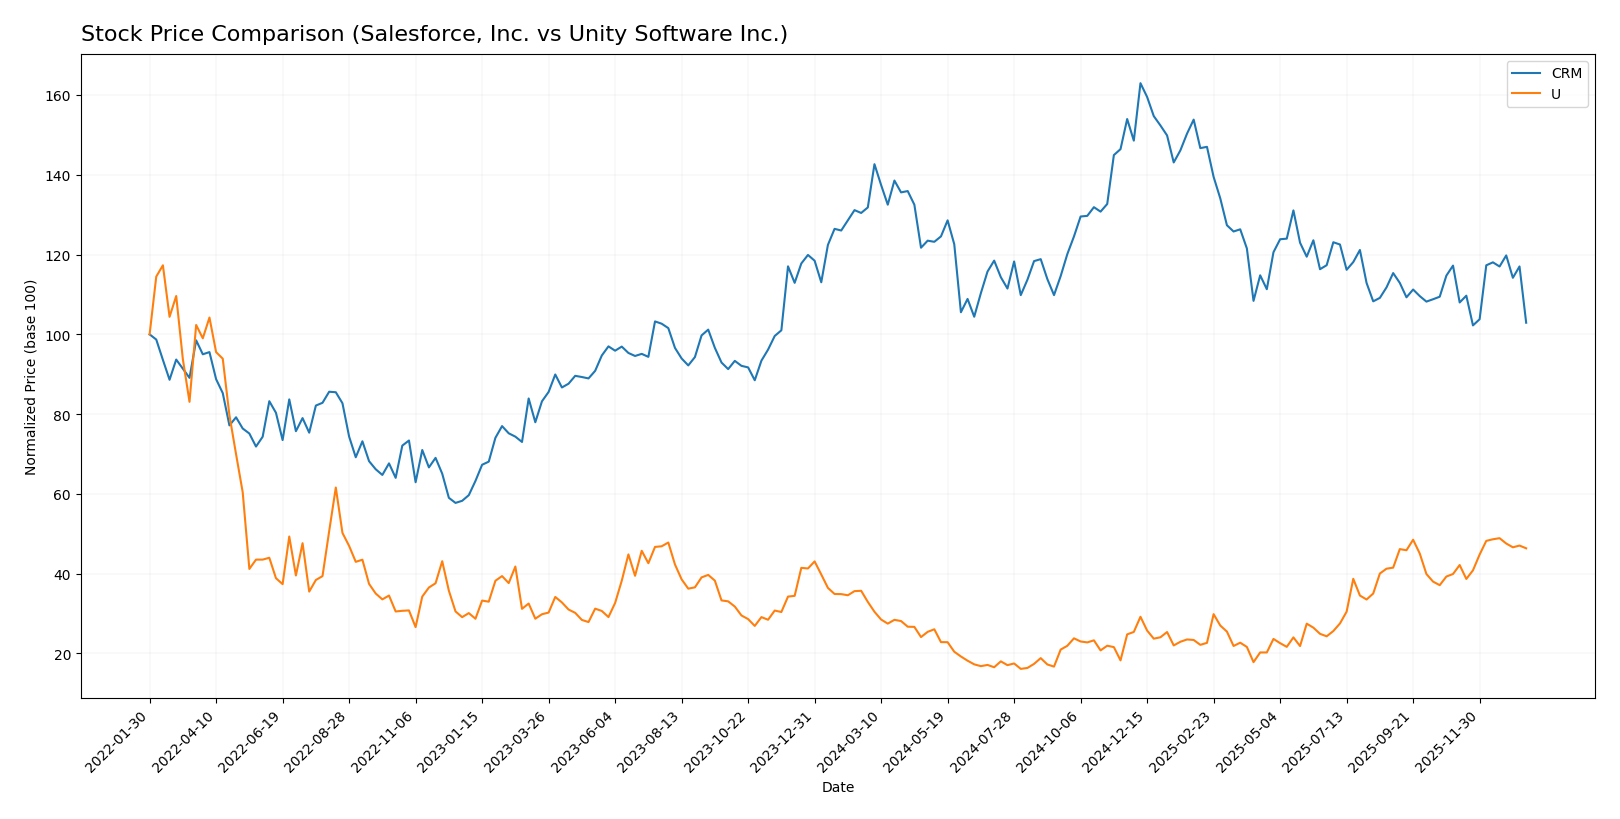
The stock price movements of Salesforce, Inc. (CRM) and Unity Software Inc. (U) over the past 12 months reveal contrasting trading dynamics, with CRM experiencing a sustained decline while U shows a pronounced upward trajectory.
Trend Analysis
Salesforce, Inc. (CRM) has exhibited a bearish trend over the past 12 months with a price decline of 21.93%, showing acceleration in downward momentum and a high volatility level with a standard deviation of 31.8. The stock reached a high of 361.99 and a low of 227.11 during this period.
Unity Software Inc. (U) demonstrated a bullish trend over the same 12-month period, with a price increase of 40.79% accompanied by accelerating gains and lower volatility at a standard deviation of 9.1. Its price ranged from a low of 15.32 to a peak of 46.42.
Comparing both stocks, Unity Software has delivered the highest market performance with a strong positive price change, contrasting with Salesforce’s significant decline.
Target Prices
The consensus target prices for Salesforce, Inc. and Unity Software Inc. indicate potential upside from current levels.
| Company | Target High | Target Low | Consensus |
|---|---|---|---|
| Salesforce, Inc. | 400 | 250 | 324.17 |
| Unity Software Inc. | 60 | 39 | 50.98 |
Analysts expect Salesforce’s stock to rise significantly from its current price of $228.25, while Unity Software’s consensus target of $50.98 also suggests upside from its current $44.26 price.
Analyst Opinions Comparison
This section compares analysts’ ratings and grades for Salesforce, Inc. and Unity Software Inc.:
Rating Comparison
Salesforce, Inc. Rating
- Rating: B+ indicating a very favorable overall assessment.
- Discounted Cash Flow Score: 4, favorable indication of valuation.
- ROE Score: 4, showing efficient profit generation from equity.
- ROA Score: 4, reflecting strong asset utilization.
- Debt To Equity Score: 3, moderate financial risk position.
- Overall Score: 3, moderate summary financial standing.
Unity Software Inc. Rating
- Rating: D+ representing a very unfavorable overall assessment.
- Discounted Cash Flow Score: 1, very unfavorable valuation perspective.
- ROE Score: 1, indicating poor efficiency in generating profit from equity.
- ROA Score: 1, reflecting weak asset utilization.
- Debt To Equity Score: 1, very unfavorable financial risk profile.
- Overall Score: 1, very unfavorable summary financial standing.
Which one is the best rated?
Salesforce, Inc. is clearly better rated than Unity Software Inc., with higher scores in discounted cash flow, ROE, ROA, debt-to-equity, and overall assessments, reflecting a stronger financial position.
Scores Comparison
Here is a comparison of the Altman Z-Score and Piotroski Score for both companies:
Salesforce, Inc. Scores
- Altman Z-Score: 5.26, indicating a safe zone and low bankruptcy risk.
- Piotroski Score: 7, considered strong financial health.
Unity Software Inc. Scores
- Altman Z-Score: 2.93, falling in the grey zone with moderate bankruptcy risk.
- Piotroski Score: 4, reflecting average financial strength.
Which company has the best scores?
Salesforce has the best scores with a higher Altman Z-Score placing it in the safe zone and a stronger Piotroski Score compared to Unity, which is in the grey zone with average financial strength.
Grades Comparison
Here is a comparison of the latest reliable grades assigned to Salesforce, Inc. and Unity Software Inc.:
Salesforce, Inc. Grades
This table summarizes recent grades from reputable grading companies for Salesforce, Inc.:
| Grading Company | Action | New Grade | Date |
|---|---|---|---|
| Barclays | Maintain | Overweight | 2026-01-12 |
| RBC Capital | Maintain | Sector Perform | 2026-01-05 |
| Morgan Stanley | Maintain | Overweight | 2025-12-09 |
| Citigroup | Maintain | Neutral | 2025-12-08 |
| DA Davidson | Maintain | Neutral | 2025-12-05 |
| Citizens | Maintain | Market Outperform | 2025-12-04 |
| Deutsche Bank | Maintain | Buy | 2025-12-04 |
| Wedbush | Maintain | Outperform | 2025-12-04 |
| Northland Capital Markets | Maintain | Market Perform | 2025-12-04 |
| Canaccord Genuity | Maintain | Buy | 2025-12-04 |
Salesforce’s grades are generally positive with multiple “Buy,” “Overweight,” and “Outperform” ratings, indicating broad confidence in the stock.
Unity Software Inc. Grades
This table presents recent grades from verified grading companies for Unity Software Inc.:
| Grading Company | Action | New Grade | Date |
|---|---|---|---|
| Morgan Stanley | Maintain | Overweight | 2026-01-13 |
| Goldman Sachs | Maintain | Neutral | 2026-01-13 |
| Wells Fargo | Maintain | Overweight | 2026-01-08 |
| Jefferies | Maintain | Buy | 2026-01-05 |
| Piper Sandler | Upgrade | Overweight | 2025-12-11 |
| BTIG | Upgrade | Buy | 2025-12-11 |
| Wells Fargo | Upgrade | Overweight | 2025-12-05 |
| Arete Research | Upgrade | Buy | 2025-12-01 |
| Citigroup | Maintain | Buy | 2025-11-11 |
| Wells Fargo | Maintain | Equal Weight | 2025-11-07 |
Unity’s grades show an upward trend with multiple recent upgrades and “Buy” or “Overweight” ratings, reflecting growing analyst optimism.
Which company has the best grades?
Both Salesforce and Unity hold “Buy” consensus ratings, but Salesforce receives more consistent “Buy” and “Overweight” grades from a larger number of firms. Unity shows recent positive upgrades, suggesting improving sentiment. Investors may note Salesforce’s broader analyst support versus Unity’s emerging momentum.
Strengths and Weaknesses
Below is a comparison of key strengths and weaknesses of Salesforce, Inc. (CRM) and Unity Software Inc. (U) based on their recent financial and operational data.
| Criterion | Salesforce, Inc. (CRM) | Unity Software Inc. (U) |
|---|---|---|
| Diversification | Highly diversified product portfolio across multiple cloud services generating $38B+ in revenue (2025). | More focused on Create and Operate Solutions, less diversified, with $1.8B revenue (2024). |
| Profitability | Positive net margin (16.35%), neutral ROIC (7.95%), but slightly unfavorable valuation multiples (PE 53). | Negative net margin (-36.63%), negative ROIC (-12.78%), reflecting ongoing losses. |
| Innovation | Strong innovation with growing ROIC trend and expanding cloud service offerings. | Innovation challenged by declining ROIC and shrinking profitability. |
| Global presence | Extensive global footprint with strong market penetration in enterprise cloud software. | Growing but smaller global presence focused on gaming and real-time 3D platforms. |
| Market Share | Leading market share in CRM and cloud services segments with consistent revenue growth. | Smaller market share with niche focus, facing intense competition. |
Key takeaways: Salesforce demonstrates strong diversification, solid profitability, and a growing return on invested capital, signaling potential value creation despite slightly high valuation. Unity struggles with profitability and value creation but maintains a solid position in its niche with growth opportunities in its core segments. Caution is advised with Unity due to its negative returns and declining profitability trend.
Risk Analysis
Below is a comparative risk table for Salesforce, Inc. (CRM) and Unity Software Inc. (U) based on the most recent 2025 and 2024 data:
| Metric | Salesforce, Inc. (CRM) | Unity Software Inc. (U) |
|---|---|---|
| Market Risk | Beta 1.27; moderate volatility | Beta 2.05; high volatility |
| Debt level | Low debt-to-equity 0.19; favorable | Moderate debt-to-equity 0.74; neutral |
| Regulatory Risk | Moderate; operates globally with compliance demands | Moderate; emerging tech with evolving regulations |
| Operational Risk | Large scale, complex integrations; manageable | High due to rapid growth and innovation demands |
| Environmental Risk | Low; software sector with minimal direct impact | Low; software sector with minimal direct impact |
| Geopolitical Risk | Exposure through global operations | Exposure through global operations |
Salesforce’s most likely and impactful risks relate to market volatility and integration complexity but benefits from strong financial stability and low debt. Unity faces higher market risk with beta above 2, moderate debt, and operational challenges given its rapid expansion and negative profitability. Caution is advised with Unity due to financial distress signals despite growth potential.
Which Stock to Choose?
Salesforce, Inc. (CRM) has shown favorable income evolution with revenue growth of 8.72% in the last year and a strong net margin of 16.35%. Its financial ratios are slightly favorable overall, supported by low debt levels and solid profitability, though valuation multiples appear high. The company’s debt metrics and interest coverage are favorable, and its rating is very favorable at B+.
Unity Software Inc. (U) presents an unfavorable income evolution marked by a negative net margin of -36.63% and declining profitability over the years. Its financial ratios are slightly unfavorable, with higher leverage and weak returns, despite a bullish stock trend. The company’s rating is very unfavorable at D+, reflecting financial instability and value destruction concerns.
For investors prioritizing financial stability and consistent profitability, Salesforce’s profile might appear more favorable due to its stronger rating and income statement. Conversely, those with a higher risk tolerance or growth focus might interpret Unity’s accelerating stock trend and revenue growth as potential, despite weaker fundamentals. The choice could depend on the investor’s risk appetite and strategy.
Disclaimer: Investment carries a risk of loss of initial capital. The past performance is not a reliable indicator of future results. Be sure to understand risks before making an investment decision.
Go Further
I encourage you to read the complete analyses of Salesforce, Inc. and Unity Software Inc. to enhance your investment decisions: